
A Spectral Mapping Method for EMG-based
Recognition of Silent Speech
Matthias Janke, Michael Wand and Tanja Schultz
Cognitive Systems Lab, Karlsruhe Institute of Technology
Karlsruhe, Germany
Abstract. This paper reports on our latest study on speech recognition based
on surface electromyography (EMG). This technology allows for Silent Speech
Interfaces since EMG captures the electrical potentials of the human articulatory
muscles rather than the acoustic speech signal. Therefore, our technology enables
speech recognition to be applied to silently mouthed speech. Earlier experiments
indicate that the EMG signal is greatly impacted by the mode of speaking. In this
study we analyze and compare EMG signals from audible, whispered, and silent
speech. We quantify the differences and develop a spectral mapping method to
compensate for these differences. Finally, we apply the spectral mapping to the
front-end of our speech recognition system and show that recognition rates on
silent speech improve by up to 12.3% relative.
1 Introduction
Automatic Speech Recognition (ASR) has matured to a point where it is successfully
applied to ubiquitous applications and devices, such as telephone-based services and
mobile personal digital assistants. Despite their success, speech-driven technologies
still face two major challenges: recognition performance degrades significantly in the
presence of noise, and confidential or private communication in public places are jeop-
ardized by audible speech. Both of these challenges are addressed by Silent Speech
Interfaces (SSI). A Silent Speech Interface is an electronic system enabling to commu-
nicate by speech without the necessity of emitting an audible acoustic signal.
In this paper, we present our most recent investigations in electromyographic (EMG)
speech recognition, where the activation potentials of the articulatory muscles are di-
rectly recorded from the subject’s face via surface electrodes
1
. This approach has two
major advantages: firstly, it is able to recognize silent speech, where not even a whis-
pering sound is uttered. Secondly, the required technology is mobile, lightweight, and
comes at very reasonable costs.
The use of EMG for speech recognition dates back to the mid 1980s, when Sugie
and Tsunoda published a first study on Japanese vowel discrimination [1]. Competitive
performance was first reported by [2], who achieved an average word error rate of 7%
1
Strictly spoken, the technology is called surface electromyography, however we use the abbre-
viation EMG for simplicity.
Janke M., Wand M. and Schultz T. (2010).
A Spectral Mapping Method for EMG-based Recognition of Silent Speech.
In Proceedings of the 1st International Workshop on Bio-inspired Human-Machine Interfaces and Healthcare Applications, pages 22-31
DOI: 10.5220/0002814100220031
Copyright
c
SciTePress

on a 10-word vocabulary of English digits. A good performance could be achieved even
when words were spoken non-audibly, i.e. when no acoustic signal was produced [3],
suggesting this technology could be used to communicate silently. While the former ap-
proaches used words as model units, [4] successfully demonstrated that phonemes can
be used as modeling units for EMG-based speech recognition, paving the way for large
vocabulary continuous speech recognition. Recent results include advances in acoustic
modeling using a clustering scheme on phonetic features, which represent properties of
a given phoneme, such as the place or the manner of articulation. In [5], we report that
a recognizer based on such bundled phonetic features performs more than 30% better
than a recognizer based on phoneme models only.
While reliable automatic recognition of silent speech is currently heavily investi-
gated and recent performance results come within useful reach, little is known about
the EMG signal variations resulting from differences in human articulation between au-
dible and silent speech production. Therefore, this paper studies the variations in the
EMG signal caused by speaking modes. We distinguish audible EMG, i.e. EMG signals
recorded on normally pronounced speech, whispered EMG, i.e. EMG signals recorded
on whispered speech, and silent EMG, i.e. signals from silently mouthed speech.
Maier-Hein [6] was the first to investigate cross-modal speech recognition perfor-
mance, i.e. models were trained on EMG signals from audible speech and tested on
EMG signals from silent speech, and vice versa. The results suggested that the EMG
signals are impacted by the speaking mode. Also, it was found that performance differ-
ences were lower for those speakers who had more practice in speaking silently while
using the system.
Since the capability to recognize silent speech is the focus of Silent Speech Inter-
faces in general, and EMG-based speech recognition in particular, we consider it very
crucial to investigating how the difference between speaking audibly or silently affects
the articulation and the measured EMG signal. Furthermore, it is of very high interest
to the silent speech research community how to compensate for these differences for
the purpose of speech recognition.
In [7] we performed first experiments on cross-modal recognition of continuous
speech based on units which were smaller than words. We showed that the difference
between audible and silent speaking modes has a significant negative impact on recog-
nition performance. We also conducted preliminary experiments on comparing the dif-
ferences between recordings of audible and silent EMG and postulated a correlation be-
tween signal energy levels and cross-modal recognition performance. The current study
is a continuation of these initial experiments. Here, we investigate the spectral content
of the EMG signals of audible, whispered and silent speech, showing that there is a
correlation between similar spectral contents and good recognition performance across
different speaking modes. We then present a spectral mapping method which serves
to reduce the discrepancies between spectral contents in different speaking modes. We
perform additional experiments on whispered speech, since this speaking mode can be
seen as an in-between of audible and silent speech: On the one hand, it is generally
softer than audible speech and does not involve any vocal chord vibration, on the other
hand, whispered speech still provides acoustic feedback to the speaker.
23

The remainder of the paper is organized as follows: In section 2 we describe the
data corpus which we used for this study. Section 3 documents our EMG-based speech
recognizer. Section 4 specifies our analytic experiments, and in section 5 we apply the
results to our EMG-based speech recognizer. Section 6 concludes the paper.
2 Data Corpus
For our experiments, we recorded a corpus of EMG signals of audible, whispered, and
silent speech of seven male speakers and one female speaker, aged between 24 and 28
years. Each speaker recorded between one and six sessions. The recording protocol was
as follows: In a quiet room, the speaker read 50 English sentences for three times, first
audibly, then in whispered speech, and at last silently mouthed. In each part we recorded
one BASE set of 10 sentences which were identical for all speakers and all sessions,
and one SPEC set of 40 sentences, which varied across sessions. In each session, these
sentence sets were the same for all three parts, so that the database covers all three
speaking modes with parallel utterances. The total of 50 BASE and SPEC utterances in
each part were recorded in random order. In all recognition experiments, the 40 SPEC
utterances are used for training, and the 10 BASE utterances are used as test set.
For EMG recording we used a computer-controlled 6-channel EMG data acquisi-
tion system (Varioport, Becker-Meditec, Germany). All EMG signals were sampled at
600 Hz and filtered with an analog high-pass filter with a cut-off frequency at 60Hz.
We adopted the electrode positioning from [6] which yielded optimal results. Our elec-
trode setting uses five channels and captures signals from the levator angulis oris, the
zygomaticus major, the platysma, the anterior belly of the digastric and the tongue. In
the audible and whispered parts, we parallely recorded the audio signal with a standard
close-talking microphone connected to an USB soundcard.
Speaker # Sessions
Average Session Length in [sec]
(Training/Testing)
audible whispered silent
1 3 190/54 222/62 198/55
2 6 162/44 164/45 163/46
3 1 189/52 197/53 221/57
4 2 169/44 168/43 184/48
5 1 182/49 193/51 185/48
6 1 151/43 151/94 156/42
7 1 188/51 189/52 189/49
8 1 158/41 164/44 170/44
TOTAL 16 2753/751 2876/837 2863/775
Fig. 1. Electrode positioning (left), properties of the data corpus (right).
The collected data is intended to be comparable to the EMG-PIT corpus of EMG
recordings of audible and silent speech [5]. However, the EMG-PIT corpus lacks whis-
pered recordings, which we perceived as essential for our investigation. Figure 1 shows
the electrode positioning and the final corpus of utterances which we used for this study.
24
3 The EMG-based Silent Speech Recognizer
For all recognition experiments we apply our EMG speech recognition system based on
three-state left-to-right fully continuous Hidden-Markov-Models [5], which are used to
model phonetic features (PFs) representing phoneme-based properties. The modeling
details are not required for the understanding of the remainder of this paper and are
therefore omitted. The interested reader is refered to [5].
3.1 Feature Extraction
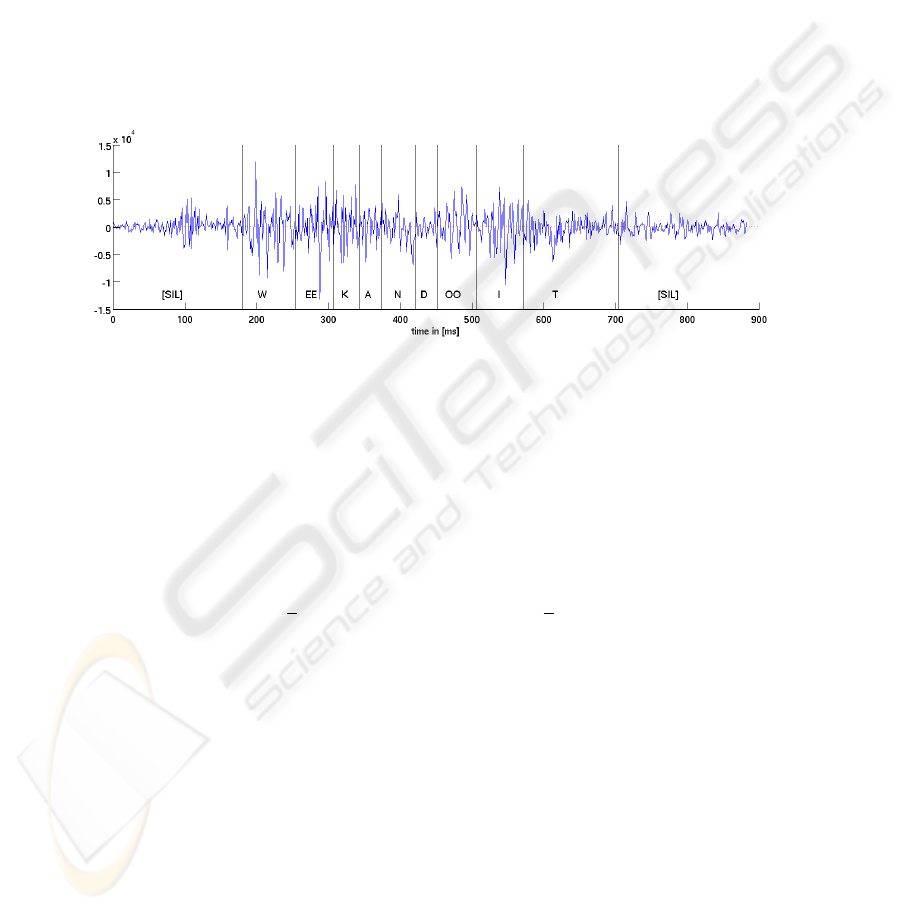
Figure 2 gives an example for a raw EMG signal (one channel) of the utterance “We
can do it”. At the bottom of the signal the phoneme alignment is displayed.
Fig. 2. Example for the EMG signal (channel 1) of the utterance “We can do it”.
The feature extraction is based on time-domain features [4]. Here, for any given
feature f ,
¯
f is its frame-based time-domain mean, P
f
is its frame-based power, and
z
f
is its frame-based zero-crossing rate. S(f , n) is the stacking of adjacent frames of
feature f in the size of 2n + 1 (−n to n) frames.
For an EMG signal with normalized mean x[n], the nine-point double-averaged
signal w[k] is defined as
w[n] =
1
9
4
X
n=−4
v[n], where v[n] =
1
9
4
X
n=−4
x[n].
The rectified high-frequency signal is r[n] = |x[n]−w[n]|. In baseline experiments with
audible EMG, the best word error rate is obtained with the following feature, which we
use in this study as well:
TD15 = S(f2, 15), where f2 = [ ¯w, P
w
, P
r
, z
r
, ¯r].
As in [7], frame size and frame shift were set to 27 ms resp. 10 ms. In all cases, we
apply LDA on the TD15 feature to generate a final feature with 32 coefficients.
25

3.2 Cross-modal Initialization
Initializing an EMG-based Continuous Silent Speech recognizer is a challenging task
since in order to initialize acoustic models representing sub-word units (phonemes or
phonetic features), one needs a time-alignment of the training material, i.e. information
about the phoneme boundaries in the training utterances. Our previous works on audible
EMG data used a conventional speech recognizer on the parallel-recorded audio stream
in order to create such a time-alignment and then forced-aligned the training sentences.
However, this method is infeasible for silent EMG, and information on the phoneme
boundaries is not readily available.
We employ two kinds of initialization methods for the silent EMG recognizer [7].
Both methods rely on the existence of a “base recognizer”, which must be trained in
advance on audible or whispered EMG by using the parallel-recorded audio stream.
These methods are as follows:
Cross-modal Testing. We directly use the base recognizer to decode the silent EMG
test set.
Cross-modal Labeling. We use trained models from the base recognizer to create a
time-alignment for the silent EMG data. Then we forced-align the silent EMG data
and do a full training run. This means that we create specific acoustic models for
silent EMG.
For decoding, we use the trained acoustic model together with a trigram Broadcast
News language model giving a perplexity on the test set of 24.24. The decoding vocabu-
lary is restricted to the words appearing in the test set, which results in a test vocabulary
of 108 words.
4 Spectral Analysis of Audible, Whispered and Silent EMG
4.1 Spectral Density Comparison
As a first experiment, we computed the power spectral density (PSD) of the EMG
recordings of each session on a per-utterance and per-channel basis and then averaged
over the utterances of each session and each speaking mode. For the PSD computation,
we used Welch’s method [8], which works as follows:
– The input signal is divided into an integer number of segments with a 30 samples
window length with 67% overlap.
– Each segment is windowed with one Hamming window to reduce spectral distor-
tion.
Thus for each session we obtained the average spectral contents of the audible, whis-
pered, and silent EMG recordings. Since the EMG signals were sampled with 600 Hz,
the frequency range is between 0 and 300 Hz.
The left-hand side of figure 3 shows the average power spectral density of EMG
channel 1 for the three sessions of Speaker 1, who has moderate experience in speaking
silently. The curve shapes look similar, but the amplitudes differ for the speaking modes.
26
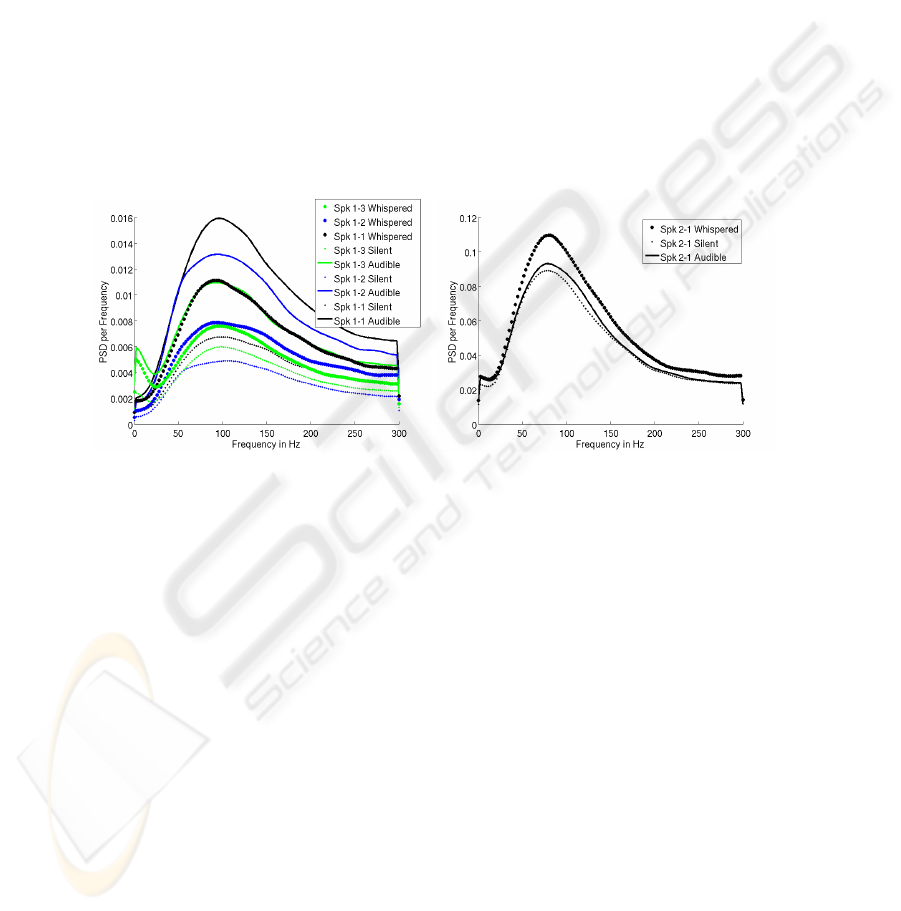
This speaker has an average Word Error Rate (WER) of 32.3% on audible EMG, while
the Cross-Modal Labeling experiment gives a WER of 87.8% on silent EMG. Whis-
pered speech is recognized with 51.2% WER. The right-hand side of figure 3 charts the
PSD of a speaker well practiced in speaking silently, with good recognition rates for
all speaking modes. The shape of the PSD curves is very similar to those of speaker 1,
and the ratio between the energy contents per frequency is much closer to one than for
speaker 1. Also note that the average signal energy is an order of magnitude higher than
for speaker 2. For speaker 2 the WERs are 34.3% for audible EMG (which is about the
same as for speaker 1), but only 6.1% for whispered EMG, and 26.3% for silent EMG.
The good performance for whispered speaking mode might be related to the higher
energy.
Except for some recordings which contained 50 Hz power line noise, the PSD
shapes look quite similar across channels. Based on physiological differences and indi-
vidual articulation charateristics the maximal values of the PSD differ. The maximum
PSD on channel 1 varies between 0.017 and 0.22 for the eight speakers.
Fig. 3. PSD (Channel 1) of three Sessions of Speaker 1 (left) and Session 1 of Speaker 2 (right)
with audible, whispered and silent speech.
These examples suggest that the recognition rates on silent speech and the similarity
of the PSD curves are related to each other. In order to quantify this statement, we
performed the following computations, individually for each session:
1. We computed the ratio of audible EMG and silent EMG PSD of each channel for
each frequency bin and took the mean of this ratio over the frequency bins. This
gives a value representing the spectral energy discrepancy between audible and
silent EMG.
2. We calculated the WER difference between audible EMG and silent EMG (Cross-
Modal Labeling Experiment) as a measure for the disparity of EMG recognition
performance on audible and silent speech. Note that except for one session, all
speakers perform better results with audible than silent speech.
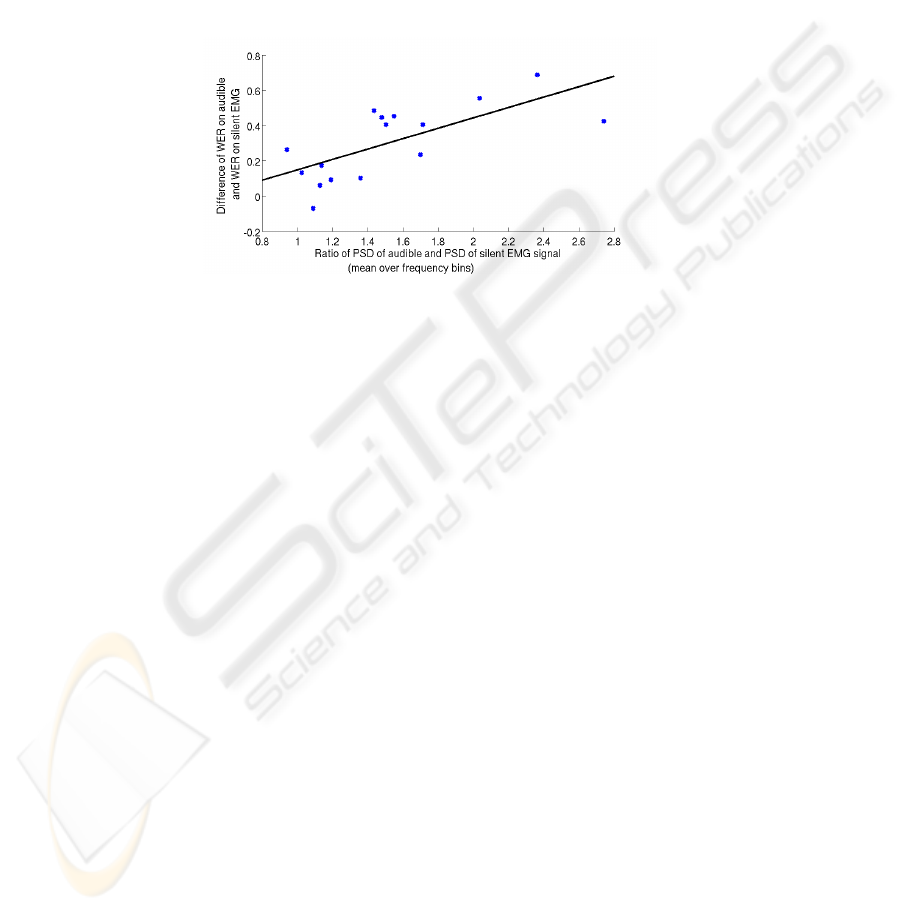
A scatter plot of these values for each of the 16 sessions and for EMG channel 1 is
shown in figure 4. The correlation coefficient is 0.67 and indicates that speakers with
27
high spectral energy difference between speaking modes tend to have a high difference
in audible and silent speech recognition performance. The scatter plots for EMG chan-
nels 2 to 6 show quite similar characteristics, the correlation coefficients for the other
channels are 0.44 for channel 2, 0.66 for channel 3, 0.74 for channel 4, and 0.75 for
channel 6. In some recordings of sessions 1-2, channel 2 shows noticeable power line
noise, which appears in the PSD graph as a high peak centered around 50 Hz. This
explains why the correlation coefficient for channel 2 is much lower than for the other
channels: When session 1-2 is removed from the computation, the correlation coeffi-
cient for channel 2 increases to 0.72.
Fig. 4. Scatter plot comparing the ratio between power spectral density (PSD) of audible EMG
and PSD of silent EMG and the difference of word error rates (WER) on silent and audible EMG
for each session, with regression line. The PSD is for EMG channel 1 only and was maximized
over frequency bins. The WER for silent EMG is from the “Cross-Modal Labeling” system.
4.2 Comparison based on Phoneme Classes
As a final experiment, we investigated the relationship between the spectral contents of
audible and silent speech in more detail. It may be assumed that computing the spectral
contents of the EMG signal on a per-utterance basis is a rather coarse way to analyze
the highly time-variant EMG signal. Therefore we split up the signals into frames with
a length of 27ms and a frame shift of 10ms, which is the same windowing used by the
EMG recognizer. We then grouped the frames according to the phonetic features they
represented. As our first experiment, we compared the spectral components of vowels
and consonants taken from the audible EMG signal and the silent EMG signal. Figure
5 shows the PSDs for consonants and vowels of session 3 of speaker 2.
While the PSD shapes of silent and audible consonants differ only little, there is a
noticeable difference in the vowel PSD chart. A reason for the higher vowel PSD in
audible EMG could be the fact that (English) vowels are syllable peaks and thus major
articulatory targets. When the speaker lacks acoustic feedback while articulating, this
might have the consequence that acoustic targets are not fully reached any more, thus
causing a less intense vowel articulation. However, further research on this question is
necessary.
28
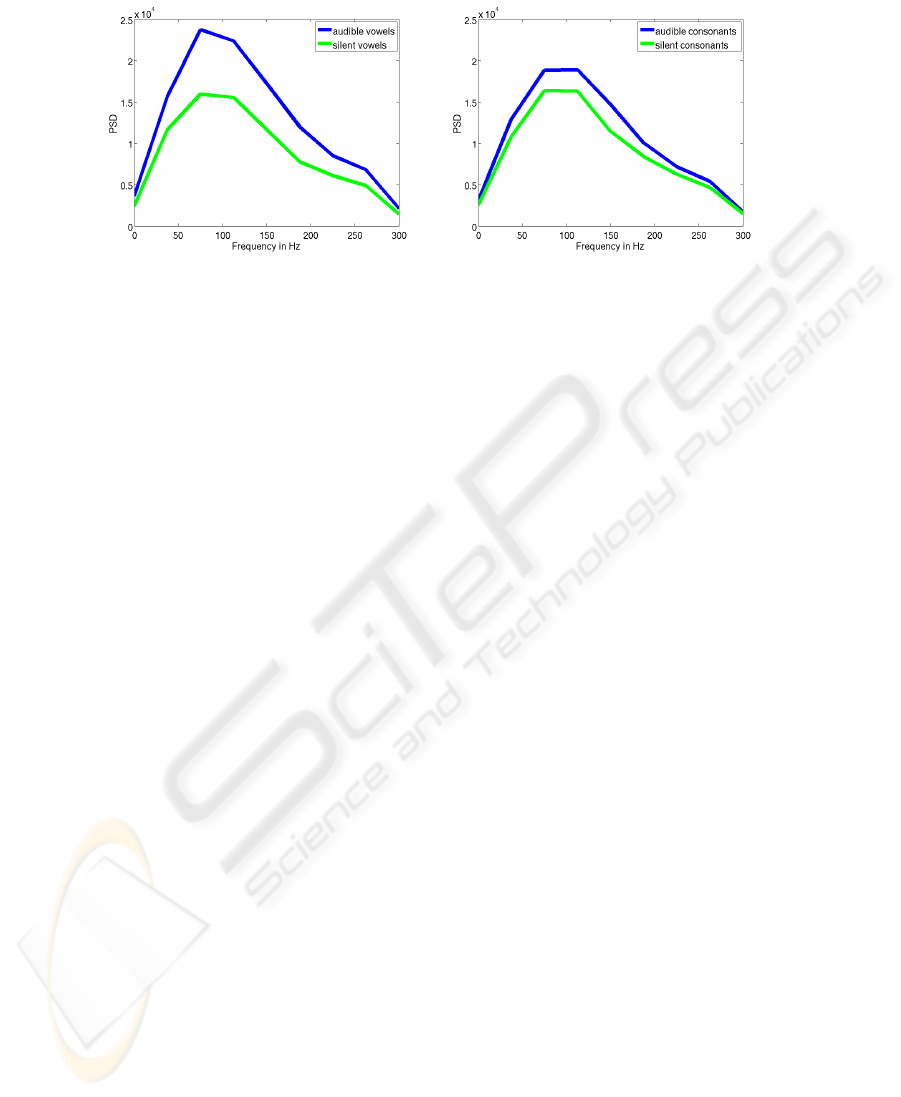
Fig. 5. PSD of EMG signal of audibly versus silently uttered vowels (left) and consonants (right)
occurring in session 2-3.
5 Spectral Mapping and Recognition Experiments
With the information we obtained about the relationship between the spectral contents
of EMG signals of audible, whispered and silent speech and the recognition perfor-
mance of the respective cross-modal recognizers, we developed a spectral mapping
method which is applied to the silent EMG signals. This mapping is applied indepen-
dently to each channel and each session and works as follows:
1. We define a “base speaking mode” (audible or whispered) for this experiment.
2. We compute the PSD ratio between the target silent EMG and the EMG signal of
the base speaking mode (as a function of the frequency). The result is averaged over
all utterances of one session. We call this ratio mapping factor.
3. Each utterance is transformed into the frequency domain by the Fast Fourier Trans-
form (FFT), then each resulting frequency component is multiplied by the corre-
sponding mapping factor, and the resulting frequency representation of the signal
is transformed back into the time domain by application of the inverse FFT.
4. After this procedure, the transformed signal is used for the training and testing
process as usual. We tested both Cross-Modal Testing and Cross-Modal Labeling
on the transformed silent EMG, where the transformation was computed with the
same base speaking mode which was also used to train the base EMG recognizer.
The resulting WERs for silent EMG and an audible EMG base system are charted
in Figure 6. One can see that particularly for Cross-Modal Testing, spectral mapping
indeed yields a large improvement: The average WER without spectral mapping is
62.13%, which by our mapping approach is improved to 54.58%. So we achieved a
relative improvement of 12.3%. Note that the improvements for Speaker 2 tend to be
slighly smaller, which can be explained by the fact that this speaker is most experienced
in speaking silently and tends to have good recognition rates for both silent and audible
speech. The Cross-Modal Labeling System yields an average WER of 54.36%; with
spectral mapping this is improved by 6.74% relative to 50.7%.
The overall improvement for cross-modal labeling is smaller than for cross-modal
testing. This may be explained by the fact that cross-modal testing directly applies the
29
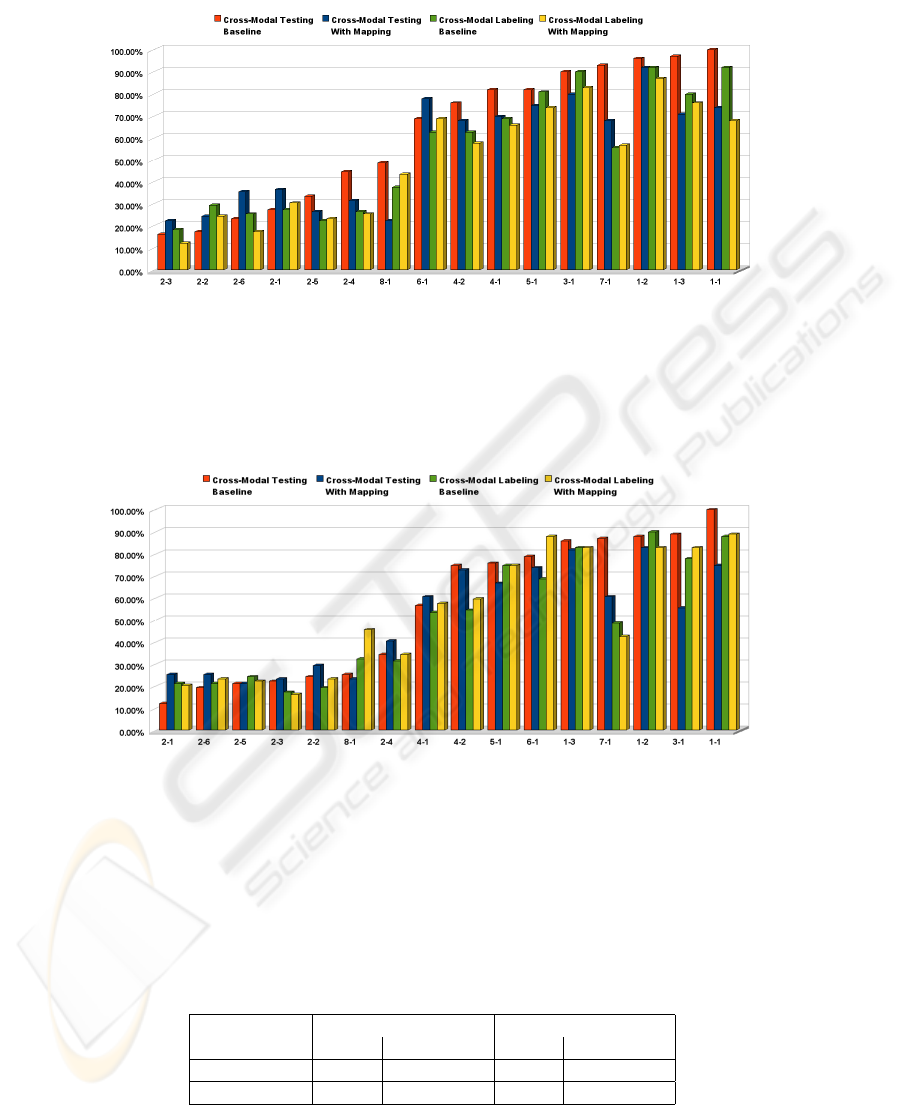
Fig. 6. Word Error Rates for the silent/audible mapped data.
recognizer trained on audible or whispered EMG to silent EMG, whereas cross-modal
labeling means that a full training is performed on the silent EMG data, which should
lessen the influence of the difference between the speaking modes.
Fig. 7. Word Error Rates for the silent/whispered mapped data.
As a next step, we performed the same set of experiments with whispered EMG as
the base system. The resulting word error rates can be seen in figure 7. As with the
audible EMG base system, spectral mapping improves the resulting WER in the cross-
modal testing experiment from 55.88% to 51.07%, which is a relative improvement of
8.6%. However, in the case of Cross-Modal Labeling, the Word Error Rate increases
from 50.31% to 52.77%. The resulting Word Error Rates for the spectral mapping ex-
periments are summarized in the following table:
Cross-Modal Testing Cross-Modal Labeling
Baseline With Mapping Baseline With Mapping
audible/silent 62.13% 54.48% 54.36% 50.70%
whispered/silent 55.88% 51.07% 50.31% 52.77%
30

In particular, it can be seen that for three out of four experiments, particularly when
no spectral mapping is performed, using whispered EMG is superior to using audible
EMG as the base signal. This supports our earlier claim that whispered speech is an
in-between of audible (normal) and silent speech.
6 Conclusions
Using EMG signals captured from the articulatory muscles, we compared the discrep-
ancies between different speaking modes, analyzing corresponding audible, whispered
and silent utterances. We showed that EMG signals from audible speech generally have
a higher spectral power than EMG signals from silent speech, and that this power ratio
and the Word Error Rate difference between speech recognition on audible and silent
EMG correlate with a correlation coefficient of up to 0.75. With this information a map-
ping from silent to audible/whispered EMG could be achieved, which resulted in 12.3%
relative improvement in our audible-to-silent Cross-Modal Testing System.
References
1. Sugie, N., Tsunoda, K.: A Speech Prosthesis Employing a Speech Synthesizer – Vowel Dis-
crimination from Perioral Muscle Activities and Vowel Production. IEEE Trans. Biomed.
Eng. 32 (1985) 485 – 490
2. Chan, A., Englehart, K., Hudgins, B., Lovely, D.: Myoelectric Signals to Augment Speech
Recognition. Medical and Biological Engineering and Computing 39 (2001) 500 – 506
3. Jorgensen, C., Lee, D., Agabon, S.: Sub Auditory Speech Recognition Based on EMG/EPG
Signals. In: Proceedings of International Joint Conference on Neural Networks (IJCNN),
Portland, Oregon (2003) 3128 – 3133
4. Jou, S.C., Schultz, T., Walliczek, M., Kraft, F., Waibel, A.: Towards Continuous Speech
Recognition using Surface Electromyography. In: Proc. Interspeech, Pittsburgh, PA (2006)
573 – 576
5. Schultz, T., Wand, M.: Modeling Coarticulation in Large Vocabulary EMG-based Speech
Recognition. (Speech Communication Journal, 2009, to appear)
6. Maier-Hein, L., Metze, F., Schultz, T., Waibel, A.: Session Independent Non-Audible Speech
Recognition Using Surface Electromyography. In: IEEE Workshop on Automatic Speech
Recognition and Understanding, San Juan, Puerto Rico (2005) 331 – 336
7. Wand, M., Jou, S.C.S., Toth, A.R., Schultz, T.: Impact of Different Speaking Modes on EMG-
based Speech Recognition. In: Proc. Interspeech. (2009)
8. Welch, P.: The use of fast fourier transform for the estimation of power spectra: A method
based on time averaging over short, modified periodograms. Audio and Electroacoustics,
IEEE Transactions on 15 (1967) 70–73
31
