EVALUATION OF PREYS / PREDATORS SYSTEMS FOR VISUAL
ATTENTION SIMULATION
M. Perreira Da Silva, V. Courboulay, A. Prigent and P. Estraillier
L3i, University of La Rochelle, Avenue M. Crépeau, 17042 La Rochelle cedex 0, France
Keywords:
Visual attention, Preys / predators, Evaluation.
Abstract:
This article evaluates different improvements of Laurent Itti’s (Itti et al., 1998) visual attention model. Sixteen
persons have participated in a qualitative evaluation protocol on a database of 48 images. Six different methods
were evaluated, including a random fixations generation model.
A real time conspicuity maps generation algorithm is also described. Evaluations show that this algorithm
allows fast maps generation while improving saliency maps accuracy.
The results of this study reveal that preys / predators systems can help modelling visual attention. The relatively
good performances of our centrally biased random model also show the importance of the central preference
in attentional models.
1 INTRODUCTION
In (Perreira Da Silva et al., 2008), we have presented
a behavioural vision architecture designed to be an el-
ementary block for a virtual companion. In order to
be interactive, this companion needs a real time vi-
sion system. A clever way to reduce allocated com-
puter resource is to focus its attention on the most
salient scene elements. Many visual attention com-
puter models have been developed (Tsotsos et al.,
2005), (Bruce and Tsotsos, 2009), (Frintrop, 2006),
(Mancas, 2007), (Ouerhani, 2003), (Le Meur, 2005)
or (Hamker, 2005), nevertheless, they are often too
complex for a real time execution. Besides, time evo-
lution of the focus of attention is another weakness of
many models, due to unsuitable decision systems.
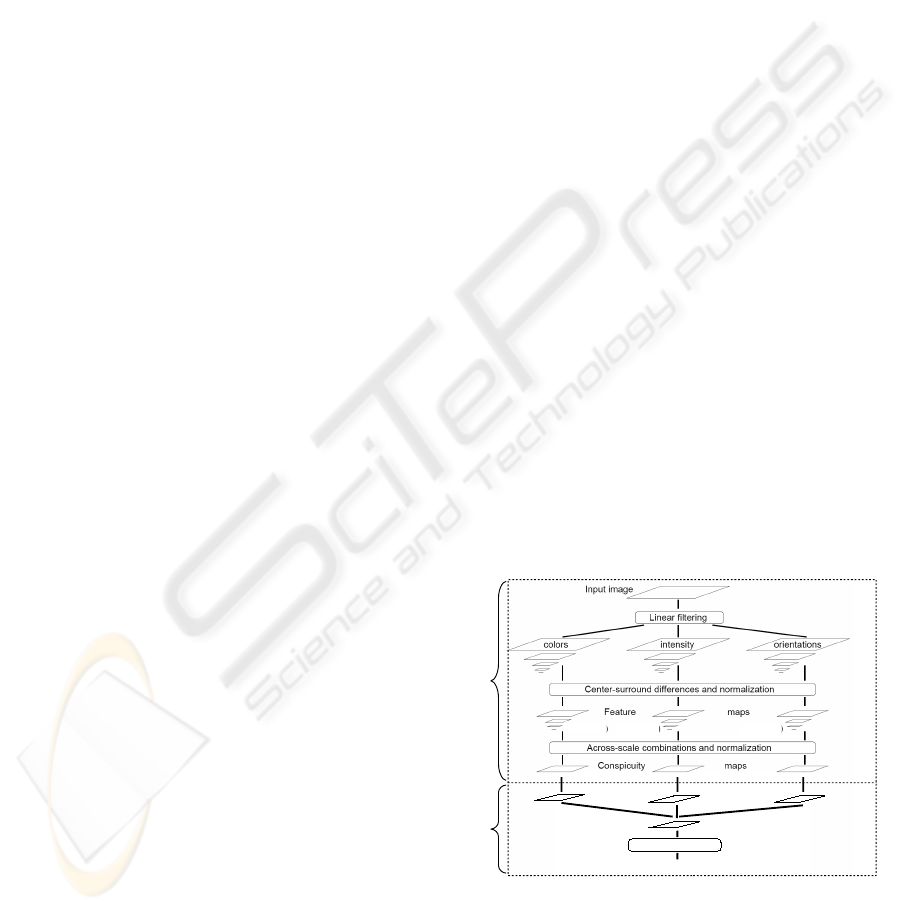
In this article, we propose a new method which
allows studying the temporal evolution of the visual
focus of attention. We have modified the classical al-
gorithm proposed by Itti in (Itti et al., 1998), in which
first part of his architecture relies on extraction on
three conspicuity maps based on low level computa-
tion. These three conspicuity maps are representative
of the three main human perceptual channels: colour,
intensity and orientation. In our architecture, these
low level computations are inspired from works pre-
sented in (Frintrop, 2006) (Frintrop et al., 2007), ac-
tually the way to accelerate computation, (i.e. the use
of integral images (Viola and Jones, 2004)) is reused
and extended to all maps. This real time computation
is described in section 2.
The second part of Itti’s architecture proposes a
medium level system which allows merging conspicu-
ity maps and then simulates a visual attention path on
the observed scene. The focus is determined by a win-
ner takes all and an inhibition of return algorithms.
We propose to substitute this second part by a preys /
predators system, in order to introduce a temporal pa-
rameter, which allows generating saccades, fixations
and more realistic paths (Figure 1).
Colors
curiosity
Intensity
curiosity
Orientation
curiosity
Interest
Attended location
Low level part of
original Itti's model
Preys / Predators
system
Global maximum
(Nx4 maps) (Nx2 maps) (Nx4 maps)
N = number of scales
(Nx4 maps)
(Nx2 maps)
(Nx4 maps)
(Nx4 maps)
Figure 1: Architecture of our visual attention model. This
diagram has been adapted from (Itti et al., 1998).
Prey / predators equations are particularly well
adapted for such a task. The main reasons are:
• prey predator systems are dynamic, they include
275
Perreira Da Silva M., Courboulay V., Prigent A. and Estraillier P. (2010).
EVALUATION OF PREYS / PREDATORS SYSTEMS FOR VISUAL ATTENTION SIMULATION.
In Proceedings of the International Conference on Computer Vision Theory and Applications, pages 275-282
DOI: 10.5220/0002815002750282
Copyright
c
SciTePress
intrinsically time evolution of their activities.
Thus, visual attention focus, seen as a predator,
could evolve dynamically;
• without any objective (top down information or
pregnancy), choosing a method for conspicuity
maps fusion is hard. A solution consists in de-
veloping a competition between conspicuity maps
and waiting for a natural balance in the preys /
predators system, reflecting the competition be-
tween emergence and inhibition of elements that
engage or not our attention;
• discrete dynamic systems can have a chaotic be-
haviour. Despite the fact that this property is
not often interesting, it is an important one for
us. Actually, it allows the emergence of original
paths and exploration of visual scene, even in non
salient areas, reflecting something like curiosity.
Finally, we present the results of experiments de-
signed to validate the relevance of these different im-
provements. We have decided to compare different
models, included those of (Itti et al., 1998), our im-
provements, and two random models (with or without
central bias).
In the following section, we present the approach
we have used to generate efficient and real time con-
spicuity maps.
2 REAL-TIME GENERATION OF
CONSPICUITY MAPS
Our solution is derived from work done in (Frintrop,
2006) and (Frintrop et al., 2007). The author uses
integral images (Viola and Jones, 2004) in order to
rapidly create conspicuity maps. Nevertheless, she
explains that these optimisations are only applied to
intensity and colour maps. Furthermore, she uses
many integral images (one for each multi-resolution
pyramid level of each conspicuity map), even if this
approach is sub-optimal it was chosen in order not
to change the original structure of their algorithm.
Lastly, integral image were not used for computing
the orientation map because results would have been
less accurate than using Gabor filters, but also because
is not trivial to compute oriented filters with angle dif-
ferent from 0 or 90deg with integral images.
To reach optimal processing times, we have de-
cided to use integral images for all the conspicuity
maps. As a consequence, Gabor filters were replaced
by simpler Haar like oriented band pass filter. Thus,
for all levels of On and Off intensity channel, R/G
and B/Y colour channels and 0 and 90deg oriented fil-
tered, we use integral images. For 45deg and 135 deg
maps, an oriented integral image is computed using
(Barczak, 2005) method.
All the information needed by multi-resolution
analysis is finally processed from only four integral
images.
The following results were obtained on a Compaq
nc8430 computer with 2Go of memory and an Intel
dual-core T2400 CPU 1.83 Ghz, using a C# imple-
mentation:
Resolution 160x120 320x240 640x480
Number of levels 3 4 5
Processing time 12ms 60ms 250ms
Accordingly, it is possible to stay in real time for
320x240 images. Nevertheless, these results are dif-
ficult to compare with those of (Frintrop et al., 2007)
mainly because:
• configurations are different (experiments and
hardware);
• programming languages (C# vs C++);
• levels of resolution is more numerous in our sys-
tem.
Regarding the last point, (Frintrop et al., 2007) as
(Itti et al., 1998) computes five levels, and only three
of them are used, those of lower resolution. In our
approach, we use all the resolution levels until a size
of 8x8 pixels, ensuring that a maximum amount of
information is taken into account.
By generalizing the use of integral images tech-
nique it is possible to compute more information in
reasonable computation time. Experimental results
presented in section 4 shows that out approach is
more efficient since our global system performance
is clearly better when we use our conspicuity maps.
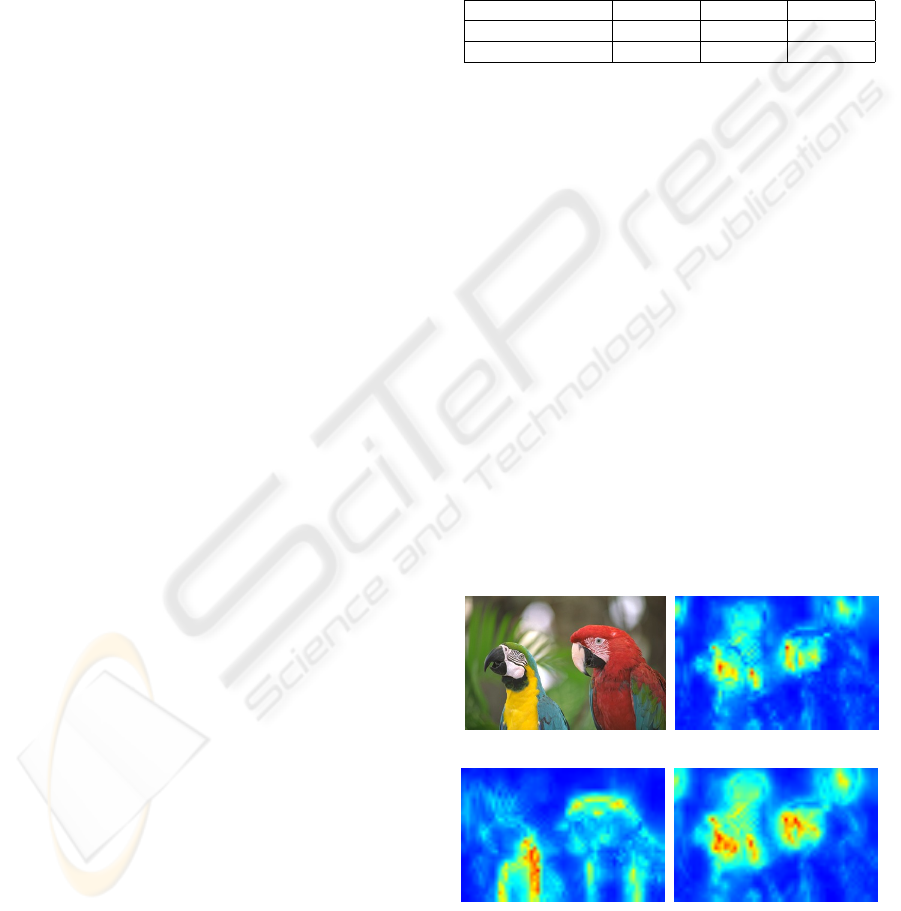
(a) (b)
(c) (d)
Figure 2: Sample real-time conspicuity maps : (a) Original
image; (b) Intensity conspicuity map; (c) colour conspicuity
map; (c) Orientation conspicuity map.
VISAPP 2010 - International Conference on Computer Vision Theory and Applications
276
2.1 A Fast and Simple Retinal Blur
Model
We have also studied the impact of the retinal blur
model on our system behaviour. Actually, since
scenes we see have a variable resolution (the closer
from the fovea we are, the sharper scenes are), it
could impact attentional models. Besides, we could
benefit of this gradual lack of details to compute our
model more quickly. Thus we do not compute a
multi-resolution pyramid, but a multi-resolution col-
umn. For example if we define a size of 16x16 for
representing the details of the finest resolution, we
will generate a Nx16 pixels column (N being the num-
ber of resolution levels we need). Figure 3 allows to
graphically comparing the two previous approaches
(pyramid vs column).
Figure 3: Left: a classical multi-resolutions pyramid. Right:
Multi-resolutions column with a width and height of 4 pix-
els.This kind of structure allows keeping only a part of the
initial information of the finest resolutions.
The following table presents computation times
with this new method. Figure 4 presents its influence
on conspicuity maps.
Resolution 160x120 320x240 640x480
Number of levels 3 4 5
Processing time 12ms 60ms 250ms
Processing time
with retinal blur 8ms 40ms 170ms
% of improvement 33% 33% 32%
Using the retinal blur model improves computa-
tion time by a 33% factor. However, benefit is not
higher than expected due to more complex interpola-
tions implied by the fusion of the different resolution
images. Nevertheless, an improvement generated by
this retinal blur is that the temporal focus of attention
is modified. Our visual attention focus is more sta-
ble, so potentially more credible knowing the fixation
time of human being (approximately 100 to 500 ms).
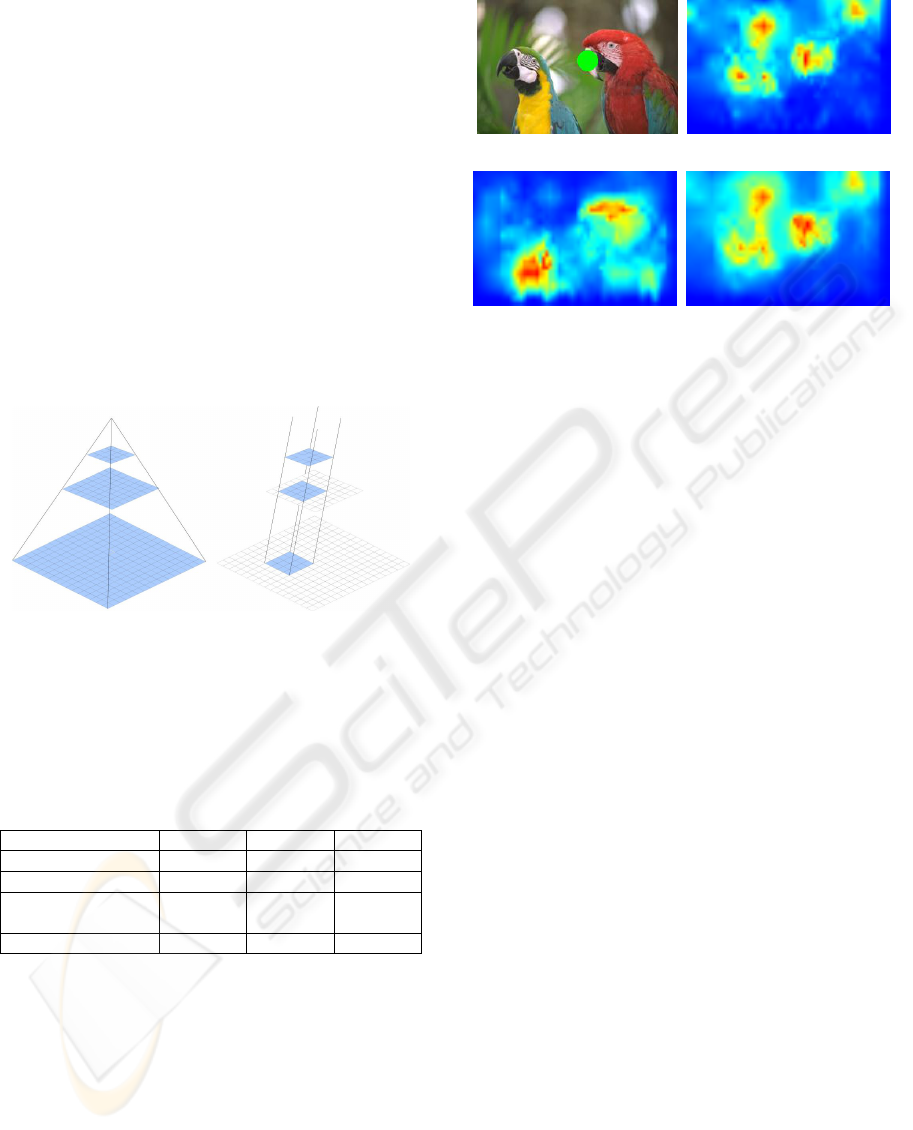
(a) (b)
(c) (d)
Figure 4: Sample real time conspicuity maps with reti-
nal blur simulation: (a) Original image. The green circle
represents the focus of attention; (b) Intensity conspicuity
map; (c) colour conspicuity map; (c) Orientation conspicu-
ity map.
3 REAL-TIME SIMULATION OF
THE TEMPORAL EVOLUTION
OF VISUAL ATTENTION
FOCUS
This section presents a fusion method used to mix the
conspicuity maps described above; interested reader
may refer to (Perreira Da Silva et al., 2009) for more
details on preys / predators system. We focus the fol-
lowing sections on describing the details necessary to
understand the results of the evaluation protocol used
to compare different models of attention.
3.1 Preys / Predators Systems and
Visual Attention Analysis
Preys / predators systems are defined by a set of
equations whose objective is to simulate the evolution
and the interactions of some colonies of preys and
predators. Interested reader can find more details
about these systems in (Murray, 2002). For our
system, we have based our work on (Lesser and
Murray, 1998) so as to represent the time evolution
of interest (or focus of attention) linked to, in a first
time (see section 6), a static image.
Traditionally, the evolution of preys / predators
systems is governed by a small set of simple rules, in-
spired from Volterra-Lotka (Murray, 2002) equations:
1. the growth rate of preys is proportional to their
population C and to a growth factor b;
EVALUATION OF PREYS / PREDATORS SYSTEMS FOR VISUAL ATTENTION SIMULATION
277

2. the growth rate of predators is proportional to their
predation rate CI (rate a which preys and preda-
tors encounter) and to a predation factor s;
3. preys and predators spread using a classical diffu-
sion rule, proportional to their Laplacian 4
C
and
a diffusion factor f ;
4. the mortality rate of predators m
I
is proportional
to their population I;
5. the mortality rate of preys mC is proportional to
their population, plus an additional mortality pro-
portional to the predation rate CI.
In order to simulate the time evolution of the focus
of attention, we propose a preys / predators system (as
described above) with the following features:
• the system is comprised of three types of preys
and one type of predators;
• these three types of preys represent the spacial dis-
tribution of the curiosity generated by our three
types of conspicuity maps (intensity, colour, ori-
entation);
• the predators represent the interest generated by
the consumption of curiosity (preys) associated to
the different conspicuity maps;
• the global maximum of the predators maps (inter-
est) represents the focus of attention at time t.
The equations described in subsection 3.2 were
obtained by building a preys / predators system which
integrates the above cited features.
3.2 Simulating the Evolution of the
Attentional Focus with a Preys /
Predators System
For each of the three conspicuity maps (colour, inten-
sity and orientation), the preys population C evolution
is governed by the following equation :
d
C
n
x,y
dt
= hC
∗n
x,y
+ h f 4
C
∗n
x,y
−m
C
C
n
x,y
− sC
n
x,y
I
x,y
with C
∗n
x,y
= C
n
x,y
+ wC
n
x,y
2
and n ∈ {c, i, o}, which
mean that this equation is valid for C
c
, C
i
and C
o
which represent respectively colour, intensity and
orientation populations.
The population of predators I, which consume the
three kinds of preys, is governed by the following
equation:
d
I
x,y
dt
= s(P
x,y
+ wI
2
x,y
) +s f 4
P
x,y
+wI
2
x,y
−m
I
I
x,y
with
P
x,y
=
∑
n∈{c,i,o}
(C
n
x,y
)I
x,y
and
h = b(1 − g + gG)(a ∗ R + (1 −a) ∗ S)(1 −e)
C represents the curiosity generated by the im-
age’s intrinsic conspicuity. It is produced by a sum
h of four factors:
• the image’s conspicuity S is generated using Lau-
rent Itti’s Neuromorphic Visual Toolkit (Itti et al.,
1998), or our real time algorithm. Its contribution
is inversely proportional to a;
• a source of random noise R simulates the high
level of noise that can be measured when mon-
itoring our brain activity (Fox et al., 2007). Its
importance is proportional to a;
• a Gaussian map G which simulates the central
bias generally observed during psycho-visual ex-
periments (Tatler, 2007). The importance of this
map is modulated by g;
• the entropy e of the conspicuity map (colour, in-
tensity or orientation). This map is normalized
between 0 and 1. C is modulated by 1 − e in order
to favour maps with a small number of local min-
imums. Explained in terms of preys / predators
system, we favour the growth of the most orga-
nized populations (grouped in a small number of
sites).
Like in (Lesser and Murray, 1998), a quadratic
term (modulated by w) has been added to the classi-
cal Volterra-Lotka equations. This term was added to
simulate non-linearitiy (positive feedback) in our sys-
tem. It enforces the system dynamics and facilitates
the emergence of chaotic behaviours by speeding up
saturation in some areas of the maps. Lastly, please
note that curiosity C is consumed by interest I, and
that the maximum of the interest map I at time t is the
location of the focus of attention.
During the experiments presented in section 4, the
following (empirically determined) parameters were
used:
a b g w m
C
m
I
s f
0.3 0.005 0.01 0.001 0.3 0.5 0.025 0.2
These parameters represent reasonable values that
can be used to obtain a system at equilibrium. Other
combinations are nevertheless possible. In particular,
these values can be varied within a range of plus or
VISAPP 2010 - International Conference on Computer Vision Theory and Applications
278
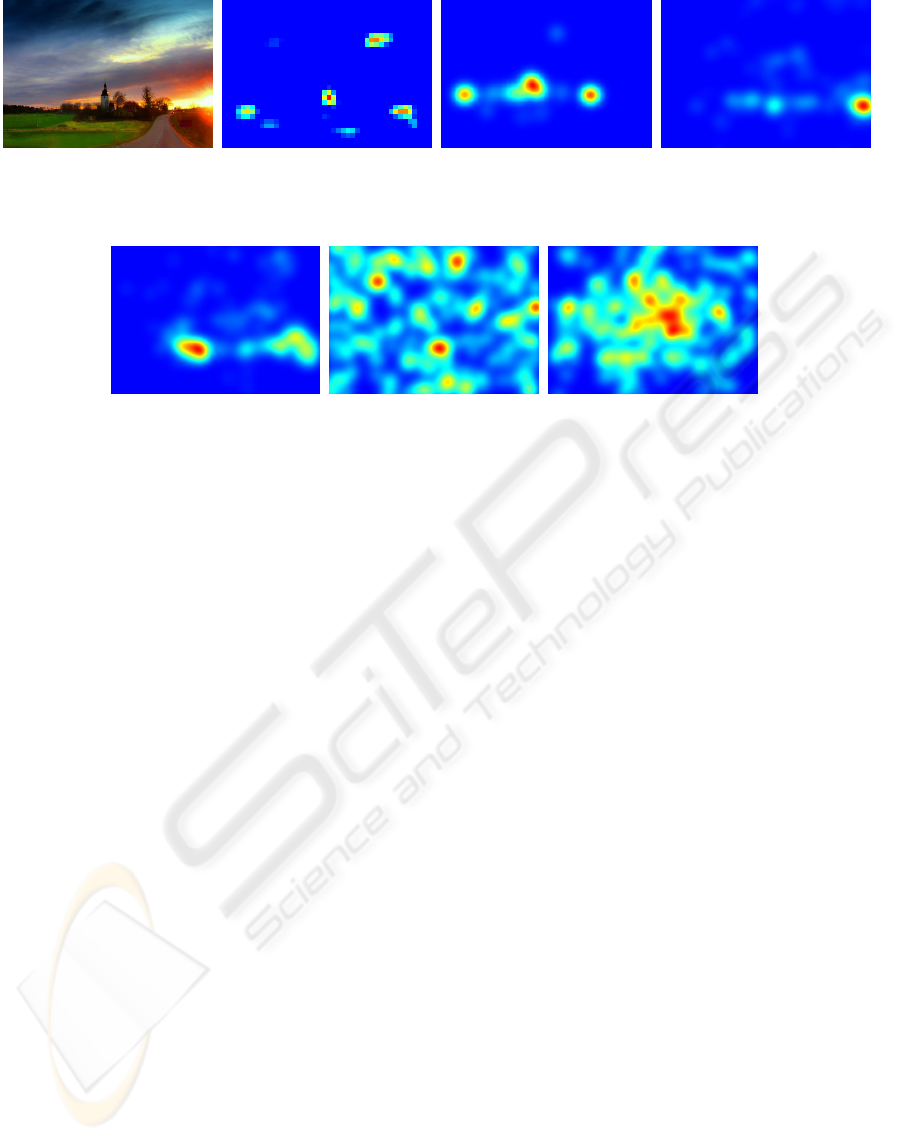
(a) Original image. (b) Saliency map processed
with the NVT (Itti et al.,
1998).
(c) NVT generated conspicu-
ity maps, fused with our preys
/ predators system.
(d) Real time conspicuity
maps (without retina simu-
lation) and preys / predators
fusion system.
(e) Real time conspicuity
maps (with retina simulation)
and preys / predators fusion
system.
(f) Random saliency map. (g) Center biased random
saliency map.
Figure 5: Sample image from the landscape category of the test database and associated results for different algorithms.
minus ±50% without compromising the system’s sta-
bility. Our system is thus quite robust to its parame-
ters variation.
4 EXPERIMENTS
We ran a series of experiments with a double objec-
tive. The first was to check that the simplifications we
have introduced in order to generate the conspicuity
maps in real time does not impact the predictive per-
formances of our model. The second was to estimate
the performances of our dynamical, preys / predators
based, conspicuity maps fusion system.
We compared the six following visual attention
models:
• Itti’s reference model (Itti et al., 1998) with de-
fault parameters (including the iterative normal-
ization). We used the open-source NVT imple-
mentation of these algorithms provided by the
iLab team. The tests were ran on still images. The
conspicuity maps used were the intensity, colour
and orientation ones.
• Our model based on preys / predators fusion ap-
plied on Itti’s conspicuity maps. We used the
model’s default parameters except for the prey’s
birth rate which was dropped to 0.05 (instead of
0.1) because of the more contrasted maps gener-
ated by Itti’s model. In order to avoid any loss of
information, the maps were not normalized.
• Our model based on preys / predators fusion ap-
plied on our standard real time conspicuity maps.
• Our model based on preys / predators fusion ap-
plied on our retinal blurred real time conspicuity
maps.
• A centrally biased random fixations generation
model. Actually this model is our preys / preda-
tors system with a equal to 1 (which mean that the
prey’s birth rate is driven only by randomness).
• A random fixations generation model without
central bias. This model is the same as cited above
but with a null g term.
4.1 Image Database
We collected a set of 48 images on the Flickr image
sharing website. The images were published under
the Attribution creative commons licence. We orga-
nized the database into 6 categories of 8 images:
• Abstract
• Animals
• City
• Flowers
• Landscapes
• Portraits
This categorization, allowed us to study the link
between the image categories and the performance of
the different visual attention models.
EVALUATION OF PREYS / PREDATORS SYSTEMS FOR VISUAL ATTENTION SIMULATION
279
(a) Abstract. (b) Animals.
(c) City. (d) Flowers.
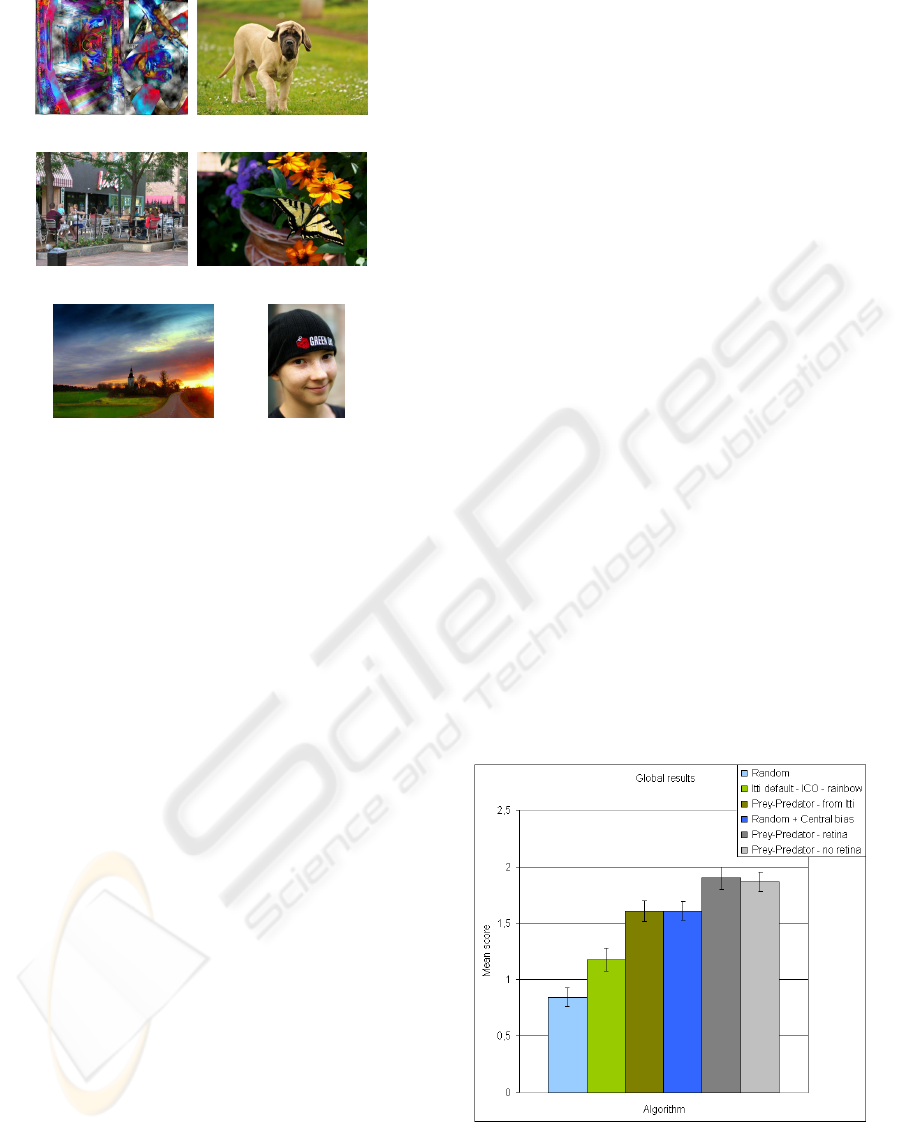
(e) Lanscapes. (f) Por-
taits.
Figure 6: Sample images from each of the six categories of
the experiment database.
4.2 Methods
Usually visual attention models performances are
evaluated by comparing the saliency maps gener-
ated by these models with heat-maps processed from
eye-tracking experiments. However, this evaluation
method is complex and suffers from known biases.
One of them is the semantic bias. This bias is due to
the fact that we need to display the images a few sec-
onds in order to capture enough eye fixations to build
a statistically valid heat-map. During that time our
brain starts analysing the meaning of the image which
affects the way we look at the image. Since that bias
can’t be avoided, we have decided to use an alterna-
tive evaluation method which does not require the use
of an eye tracker. That way, anybody can reproduce
our experiments. The subjects were asked to watch a
set of 288 image couples. Each couple is composed of
a reference image, randomly selected from the exper-
iment database, and a visual attention map generated
by one of the six algorithms evaluated. For each of
these couples the subject had to rate the potential of
the attention map to represent the different parts of
the image that attracts the attention of most people.
The rate scale was 0 (very bad) to 3 (very good). No
time limit was given, but the subjects were advised to
spend two or three seconds on each image so that the
experiment last no more than fifteen minutes. In or-
der to let the subjects become familiar with the exper-
iment without impacting or biasing the final results,
we choose to remove the ten first results from the fi-
nal analysis.
4.3 Participants
Sixteen participants (eleven men and five women)
took part in the experiment. They were aged from
21 to 57 years old.
5 RESULTS
Since the participant ratings were quite heteroge-
neous, we normalized each of their 288 marks so
that they have a constant mean and standard devia-
tion (with respective values 1.5 and 1). That way, we
had a more consistent dataset.
Figure 7 shows the mean results obtained by each
of the algorithms over the whole database. We no-
tice that our preys / predators fusion system glob-
ally improves the plausibility of the attention maps.
One can also note that the use of our real time con-
spicuity maps, despite its numerous simplifications
and approximations, also improves the overall predic-
tive performances of the attention models. However,
our (very simple) retina simulation algorithm does not
show and significant performance improvement. The
overall good performance of the central biased ran-
dom model is also quite surprising, but actually these
results are very dependent of the image category (see
Figure 8). Lastly and unsurprisingly, the full random
model obtains the worst performances.
Figure 7: Global results of the experiment for each evalu-
ated attention model. Black bars represent the 95% confi-
dence interval.
VISAPP 2010 - International Conference on Computer Vision Theory and Applications
280
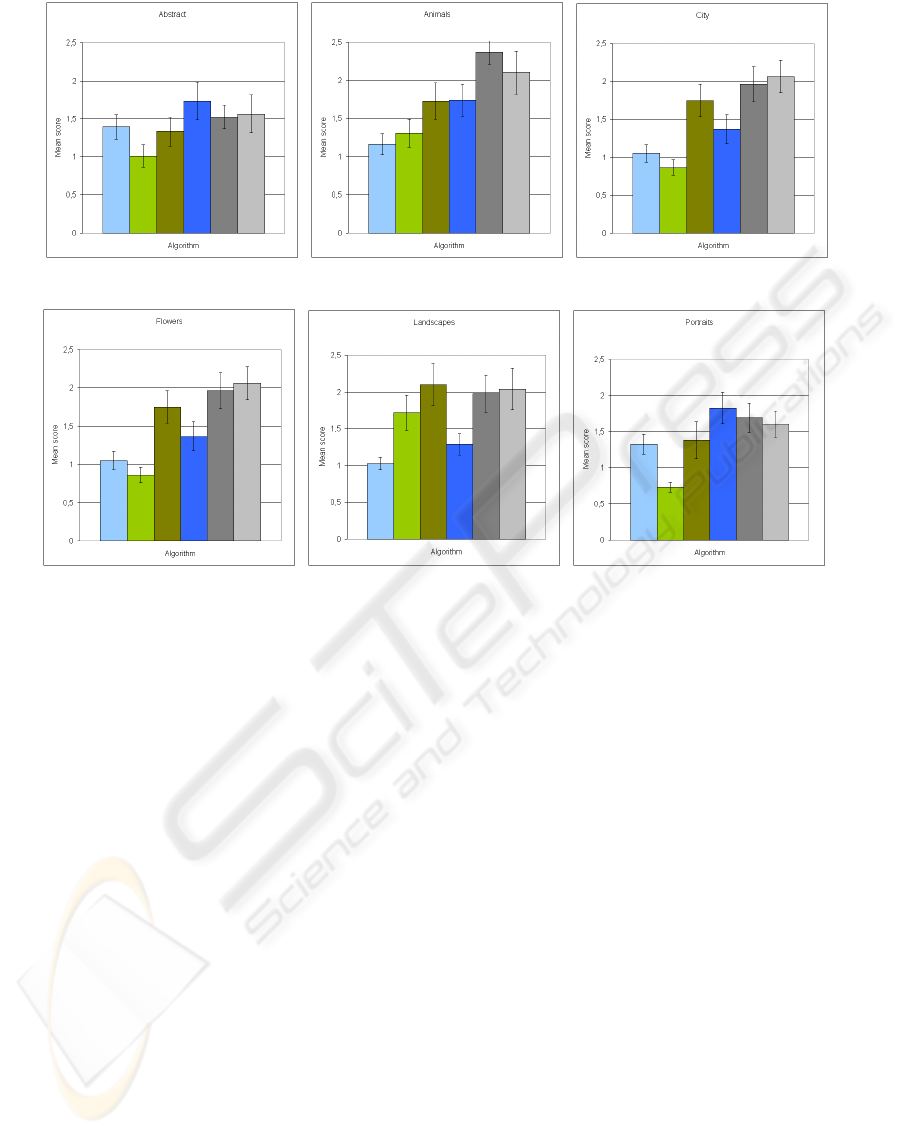
(a) Abstract (b) Animals (c) City
(d) Flowers (e) Landscapes (f) Portraits
Figure 8: Results of the experiments for each image category.
The results of the different algorithms for the six cat-
egories of our experiments database (Figure 8) are
quite variable:
• The centrally biased random model obtains the
best performances on the portraits and abstract
categories. This surprising phenomenon is partly
due to the photographer bias. Indeed, any pho-
tographer tends to centre his subject in the image.
This model also performs quite well on the ab-
stract category. It seems that defining the area s
of interest for this category is a very challenging
task; as a consequence, participants have accepted
the central choice as a least bad solution.
• Images from the abstract category are very hard
to rate. As a consequence, all models seem to
perform equally. For this kind of images, ran-
dom model are as good as other more sophisti-
cated models.
• Fusing the conspicuity maps with a preys / preda-
tors dynamical system significantly improves the
performances of Itti’s model for all categories, ex-
cept for landscapes were Itti’s algorithm already
performs well. In this case, the performances
seem superior to Itti’s model, but we can’t assert
this, since the 95% confidence interval for these
data is quite high.
6 DISCUSSIONS
This article shows that preys / predators based con-
spicuity maps fusion can be used to improve the plau-
sibility of visual attention models. Moreover, the re-
sults of the experiments performed by 16 participants
on a database of 48 images show the importance of
taking into account the central bias when building
new visual attention models. Finally, we have demon-
strated the good performances our method for real
time generation of conspicuity maps (with or without
simple retinal blur).
The results presented in this article are promising, but
they need to be confirmed by eye tracking experimen-
tation. Although eye tracking is far from being perfect
for visual attention analysis (see (Perreira Da Silva
et al., 2009)), it allows collecting the temporal evo-
lution of eye positions, which cannot be obtained by
another mean. Our future researches will focus on this
kind of experimentation, so as to validate the dynam-
ical behaviour of our model.
EVALUATION OF PREYS / PREDATORS SYSTEMS FOR VISUAL ATTENTION SIMULATION
281

REFERENCES
Barczak, A. L. C. (2005). Toward an efficient implementa-
tion of a rotation invariant detector using haar-like fea-
tures. In Image and Vision Computing New Zealand,
University of Otago, Dunedin.
Bruce, N. D. B. and Tsotsos, J. K. (2009). Saliency, at-
tention, and visual search: An information theoretic
approach. J. Vis., 9(3):1–24.
Fox, M. D., Snyder, A. Z., Vincent, J. L., and Raichle, M. E.
(2007). Intrinsic fluctuations within cortical systems
account for intertrial variability in human behavior.
Neuron, 56(1):171 – 184.
Frintrop, S. (2006). VOCUS: A Visual Attention System for
Object Detection and Goal-Directed Search. PhD the-
sis, University of Bonn.
Frintrop, S., Klodt, M., and Rome, E. (2007). A real-
time visual attention system using integral images. In
5th International Conference on Computer Vision Sys-
tems. University Library of Bielefeld.
Hamker, F. H. (2005). The emergence of attention by
population-based inference and its role in distributed
processing and cognitive control of vision. Computer
Vision and Image Understanding, 100(1-2):64 – 106.
Special Issue on Attention and Performance in Com-
puter Vision.
Itti, L., Koch, C., and Niebur, E. (1998). A model of
saliency-based visual attention for rapid scene analy-
sis. Pattern Analysis and Machine Intelligence, IEEE
Transactions on, 20(11):1254–1259.
Le Meur, O. (2005). Attention sélective en visualisation
d’images fixes et animées affichées sur écran : Mod-
èles et évaluation de performances - Applications.
PhD thesis, Ecole Polytechnique de l’Université de
Nantes.
Lesser, M. and Murray, D. (1998). Mind as a dynamical
system: Implications for autism. In Psychobiology of
autism: current research & practice.
Mancas, M. (2007). Computational Attention: Towards at-
tentive computers. PhD thesis, Faculté Polytechnique
de Mons.
Murray, J. D. (2002). Mathematical Biology: I. An In-
troduction. Interdisciplinary Applied Mathematics.
Springer.
Ouerhani, N. (2003). Visual Attention: From Bio-Inspired
Modeling to Real-Time Implementation. PhD thesis,
Institut de Microtechnique, Universitée de Neuchâtel.
Perreira Da Silva, M., Courboulay, V., Prigent, A., and Es-
traillier, P. (2008). Adaptativité et interactivité - vers
un système de vision comportemental. In MajecSTIC
2008.
Perreira Da Silva, M., Courboulay, V., Prigent, A., and
Estraillier, P. (2009). Attention visuelle et systèmes
proies / prédateurs. In XXIIe Colloque GRETSI -
Traitement du Signal et des Image, Dijon France.
Tatler, B. W. (2007). The central fixation bias in scene view-
ing: Selecting an optimal viewing position indepen-
dently of motor biases and image feature distributions.
Journal of Vision, 7(14):1–17.
Tsotsos, J. K., Liu, Y., Martinez-trujillo, J. C., Pomplun,
M., Simine, E., and Zhou, K. (2005). K.: Attending to
visual motion. CVIU, 100:3–40.
Viola, P. and Jones, M. J. (2004). Robust real-time face
detection. International Journal of Computer Vision
(IJCV), 57:137–154.
VISAPP 2010 - International Conference on Computer Vision Theory and Applications
282
