
THE POTENTIAL OF CONTOUR GROUPING FOR IMAGE
CLASSIFICATION
Christoph Rasche
Laboratorul de Analiza si Prelucrarea Imaginilor, Bucharest Politechnica University, Bucuresti, Romania
Keywords:
Image classification, Contour description, Contour grouping.
Abstract:
An image classification system is introduced, that is predominantly based on a description of contours and
their relations. A contour is described by geometric parameters characterizing its global aspects (arc or al-
ternating) and its local aspects (degree of curvature, edginess, symmetry). To express the relation between
contours, we use a multi-dimensional vector, whose parameters describe distances between contour points and
the contours’ local aspects. This allows comparing for instance L features or parallel contours with a simple
distance measure. The approach has been evaluated on two image collections (Caltech 101 and Corel) and
shows a reasonable categorization performance, yet its future lies in exploiting the preprocessing to understand
’parts’ of the image.
1 INTRODUCTION
Recent approaches to image classification have used
a variety of methods for their success. For instance
Oliva and Torralba use the Fourier transform to pre-
process gray-scale images of outdoor scenes (urban
and natural), whose spectra are then classified (Oliva
and Torralba, 2001); the group by Perona uses the
principal component analysis to classify rigid ob-
jects with clear silhouettes (the Caltech-101 collec-
tion (Fergus et al., 2007); others achieve compara-
ble performances using histograms of selected fea-
tures (Perronnin et al., 2006), systematic image his-
togramming (Lazebnik et al., 2006) and inspiration
by Gestalt laws (Bileschi and Wolf, 2007). These ap-
proaches are good at discriminating image categories,
but once the image is classified, their preprocessing
output does not allow to analyze the structure, for
instance to understand parts of the image or to de-
termine the orientation of the recognized object. To
carry out such a structural analysis it required a novel
processing of the image. For instance, in case of the
spatial envelope system by Oliva and Torralba, a pre-
processing based on local orientations was developed,
that allows for a visual search (Torralba et al., 2006),
an effort which appears to be a move toward a struc-
tural description. Clearly, a structural description is
still the most promising approach to a complete scene
understanding system.
The idea of structural description is typically as-
sociated with an exact reconstruction of the image,
starting for instance with image segmentation. This
direction is perceived as little promising for the task
of image classification given the wave of above men-
tioned attempts to ’directly’ classify (see also explicit
arguments by Oliva and Torralba in (Oliva and Tor-
ralba, 2001)). Furthermore, contours often appear
fragmented and seemingly do not allow for a straight-
forward assignment to their ’parts’. Still, contour and
structural-description approaches show their promise
in object-search systems, for instance as templates
of a ’Cubist’ representation (Nelson and Selinger,
1998) (see also (Shotton et al., 2008; Opelt and Prinz,
2006; Zheng et al., 2007); others develop learning al-
gorithms for edge detection for specific image sets
(Dollr et al., 2006); or try to use contour informa-
tion to detect junctions in natural images (Maire et al.,
2008). In this study, a structural description is pur-
sued that describes contour geometry and their rela-
tions very accurately; elaborate image segmentation
is avoided with the consequence of producing fre-
quent accidental detections, which however are made
negligible by a matching process using redundant cat-
egory representations. But because structure is de-
scribed exhaustively, it potentially allows a detailed
image analysis without the need of a novel prepro-
cessing.
One way to relate contours is to use the
symmetric-axis transform (Blum, 1973).
481
Rasche C. (2010).
THE POTENTIAL OF CONTOUR GROUPING FOR IMAGE CLASSIFICATION.
In Proceedings of the International Conference on Computer Vision Theory and Applications, pages 481-486
DOI: 10.5220/0002815904810486
Copyright
c
SciTePress

Though conceptually elegant, it suffers from sus-
ceptibility to speckled noise which leads to distor-
tions of the sym-axes, and it generates local rela-
tions only, meaning the sym-axes are formed only be-
tween immediately neighboring contours. However,
what it also requires are global relations (or group-
ings) between contours, whereby irrelevant contours
may lie in-between (e.g. speckled noise). The study
by Bileschi and Wolf is a step toward that direction
(Bileschi and Wolf, 2007): it relies on finding group-
ing principles from pixel correlations, that however
are time intensive (ca. 80 secs/image). Instead, a
grouping by contours would be less intensive and po-
tentially more powerful, yet has been hardly pursued.
That is the novelty of this study. To pursue such a
contour-based approach, it requires a method which
can reliably identify contours. We thereby use the
method described in (Rasche, 2009), that is summa-
rized in subsection 2.1. Subsection 2.2 explains the
grouping procedure tested in this study.
2 MODEL
2.1 Contour Description, Partitioning
and Extraction
The contour description is derived from distance dis-
tributions that in turn are obtained from systematic
measurements along the contour. For an arbitrary
contour a so-called local/global (LG) space is cre-
ated, which is a description analogous to the scale
space (fine/coarse space) but does not involve low-
pass filtering (Rasche, 2009). The contour’s global
geometry is classified into either arc (a) or alternat-
ing (w), whereby the values are scalar and express the
strength of these aspects. The contour’s local aspects
are described by the curvature parameter (b), that ex-
presses the circularity and amplitude of the arc and
alternating contour respectively; the edginess param-
eters, that expresses the sharpness of a curve (L fea-
ture or bow); the symmetry parameter, that expresses
the ’eveness’ of the contour.
Contours are partitioned as follows: if a contour
contains an ’end’ - a turn of 180 degrees - it is par-
titioned at its point of highest curvature. After ap-
plication of this rule, any contour appears either as
elongated in a coarse sense and can thus be classified
as either alternating or curved (w or a). An excep-
tion to this rule are smooth arcs, whose arc length is
larger than 180 degrees; they are extracted separately.
Exemplifying these two partitioning steps on the Ω
shape: the shape is havened and its circular part is
extracted.
An alternating contour may span several objects
(or parts) and that can be very characteristic to a
category (as for instance the vertical wiggly contour
for a person). Yet, its individual curved and straight
segments can form potentially useful groupings with
other contours of the structure. Thus, further parti-
tioning for the purpose of grouping meant also losing
potential category specificity. In this study, such al-
ternating contours are not further partitioned but any
straight or reasonably smooth, curved segment of suf-
ficient arc length is extracted from it. Such elemen-
tary segments can be identified using the LG space.
For a wiggly, natural contour such segments hardly
exist, but many object silhouettes contain multiple
such segments. Thus, the decomposition process does
not strictly partition the contours into separate seg-
ments, but will create partially overlapping segments
to some extent. Taking the Ω shape as the example
again, it is partitioned into 5 segments: one smooth
arc segment; two L features representing the corners;
and two straight segments (if of sufficient arc length).
The left graph in Figure 1 shows an example out-
put of this decomposition. The long smooth arc out-
lining the wheel shows multiple segment extractions
(straight and curved) because a) the segment is an el-
lipse, and b) due to the aliasing problem and the asso-
ciated difficulty of discriminating between a smooth
arc and a circularly aligned (open) polygon, that is
discriminating between circle and hexagon for in-
stance. Filtering techniques could resolve this latter
issue (Lowe, 1989), but would introduce additional
computation time, which we think can be avoided as
we merely intend to find the semantic content of the
image and not a precise reconstruction. In addition to
those contours (denoted as c), we use the symmetric-
axis descriptors a as in (Rasche, 2009).
2.2 Grouping
Relating all contours with each other is excessive and
leads to an unspecific structural description. Thus,
there need to be some constraints that reduce the num-
ber of all possible relations to a smaller set of mean-
ingful groupings. Such constraints have already been
described by Lowe for the purpose of determining the
orientation of objects in 3D space (Lowe, 1985). For
instance, closely spaced contour endpoints or paral-
lel lines are ’salient’ groupings which point to certain
object poses. In case of a description for an arbitrary
structure, the issue of grouping is more complexas es-
sentially any spatial arrangement of two contours can
be very category specific. Thus, the aim is therefore
to find criterions that eliminate irrelevant pairings and
VISAPP 2010 - International Conference on Computer Vision Theory and Applications
482

50 100 150 200 250 300
50
100
150
200
250
Smooth Arcs and Straight Segments (img=8904)
50 100 150 200 250 300
50
100
150
200
250
Figure 1: Decomposition output for an image (wheel chair from Caltech-101 collection). Left: Contour endpoints are marked
as small black circles; squares and circles denote straight and curved segments respectively (their size reflects segment length -
not curvature). Overlapping circles result from the global-to-local identification of elementary segments. Right: Smooth arcs
(thick gray [magenta]) and straight segments (thick stippled) after application of a simple smoothness criterion to individual
contours.
keep the potentially category-characteristic pairs. In
this study, we tested the following criterions:
1) Smoothness: only reasonably smooth contours
were allowed for pairs, by choosing segments (c)
with a low edginess value (see Figure 1 right graph).
See also (Felzenszwalb and McAllester, 2006) for a
method of finding salient curves.
2) Nearest Choice: For a given contour, only the
two most proximal contours are admitted as pairs.
Proximity is determined for the two endpoints and the
center point of a contour.
Those two criterions reduce the number of pair-
ings substantially, but they may already eliminate
some category-characteristic pairs, in particular the
nearest choice criterion as there could exist distinct
pairs on a global scale. We therefore used one pair-
ing that is salient independent of the intersegment dis-
tance of the two segments:
3) Closure: A contour pair that appeared as round
or as encapsulating an area, e.g. two curved segments
lying on opposite sides of a circle.
A contour-pair vector is created consisting of the
following parameters: the distance between the prox-
imal endpoints (d
c
); the distance between the center
points (d
c
); the distance between the distal endpoints
(d
o
), average contour length (l), the asymmetry of
contour lengths (y); the curvature values for the two
contours (b
1
and b
2
; obtained from the contour de-
scription):
p(o, d
c
, d
m
, d
o
, l, y, b
1
, b
2
). (1)
We also tested a texture descriptor t consisting of
the appearance dimensions of the sym-axis descrip-
tor only. And we also tested a ’cluster’ descriptor r,
which expresses the geometry of a contour cluster in a
statistical sense. Those descriptors are not explained
further for reason of brevity.
3 IMPLEMENTATION &
EVALUATION
The closure criterion was implemented by choosing
pairs whose distance between the center points was
larger than the distances between the end points by a
factor of 1.1; this is a simple but somewhat loose rule,
selecting also a small number of ’distorted’ pairings
(e.g. segments not facing each other symmetrically).
The preprocessing was carried out for four (spa-
tial) scales (σ=1,2,3,5). The average operation dura-
tion for a Caltech image at scale σ = 1 using Mat-
lab on an Intel 2GHz was: 1300ms for creating the
contour-pair vectors; 940ms for the cluster vectors;
another ca. 8 seconds were used for contour ex-
traction, description and sym-axes generation (total
ca. 10 secs). For scale σ = 5, the average image-
preprocessing duration was 4.8 seconds; for all 4
scales it was ca. 30 seconds.
THE POTENTIAL OF CONTOUR GROUPING FOR IMAGE CLASSIFICATION
483
Faces
1
Faces easy
2
Leopards
3
Motorbikes
4
accordion
5
airplanes
6
anchor
7
ant
8
barrel
9
bass
10
beaver
11
binocular
12
bonsai
13
brain
14
brontosaurus
15
buddha
16
butterfly
17
camera
18
cannon
19
car side
20
ceiling fan
21
cellphone
22
chair
23
chandelier
24
cougar body
25
cougar face
26
crab
27
crayfish
28
crocodile
29
crocodile head
30
cup
31
dalmatian
32
dollar bill
33
dolphin
34
dragonfly
35
electric guitar
36
elephant
37
emu
38
euphonium
39
ewer
40
CALTECH, LRE, s =3
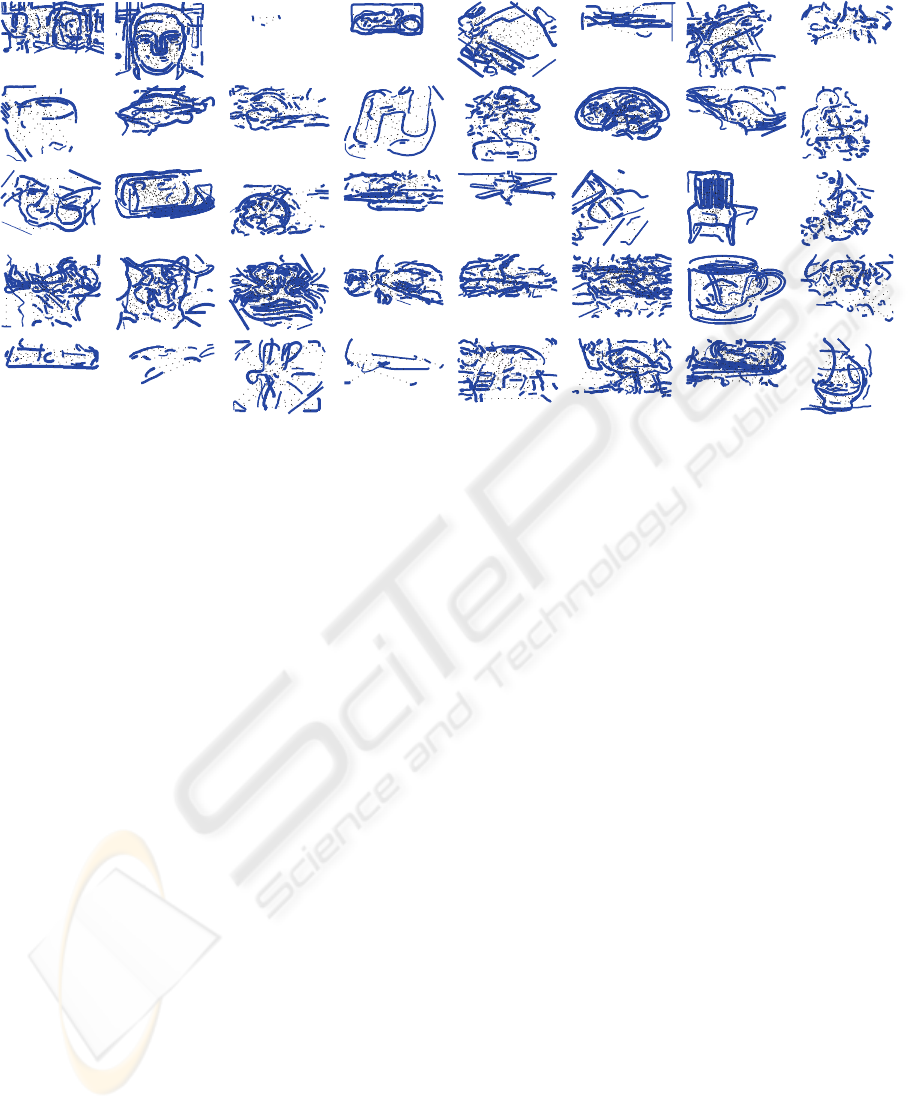
Figure 2: Category-specific contour pairs for the first 40 categories of the Caltech-101 collection (using two training images).
The thin dotted line connects a pair; contour thickness corresponds to the descriptor weight. A pair is obtained by comparing
the individual vectors of two images (of the same category).
The model was evaluated on the Caltech 101 col-
lection (Fergus et al., 2007) and the COREL collec-
tion (see e.g. (Rasche, 2009) for its use). In a learning
phase, category-specific descriptors (the ’Cubist’ rep-
resentation) were determined by finding similar de-
scriptors amongst two images of the same category
(see Figure 2 for contour pairs). Descriptor weights
were set by ’cross-correlating’ the Cubist representa-
tions and determining how often (rare) they occur in
any other categories.
In a testing (categorization) phase, the descriptors
of each Cubist representation are matched against the
descriptors of a test image. More specifically, the
descriptors v
j
of a test image were matched against
the category-specific descriptors v
i
of a category, re-
sulting in a distance matrix D
ij
. The shortest dis-
tance for each category-specific descriptor was se-
lected d
i
= max
j
D
ij
and multiplied with the descrip-
tor weights. A simple integration across descriptors
and scales, followed by a maximum search decided
on the preferred category.
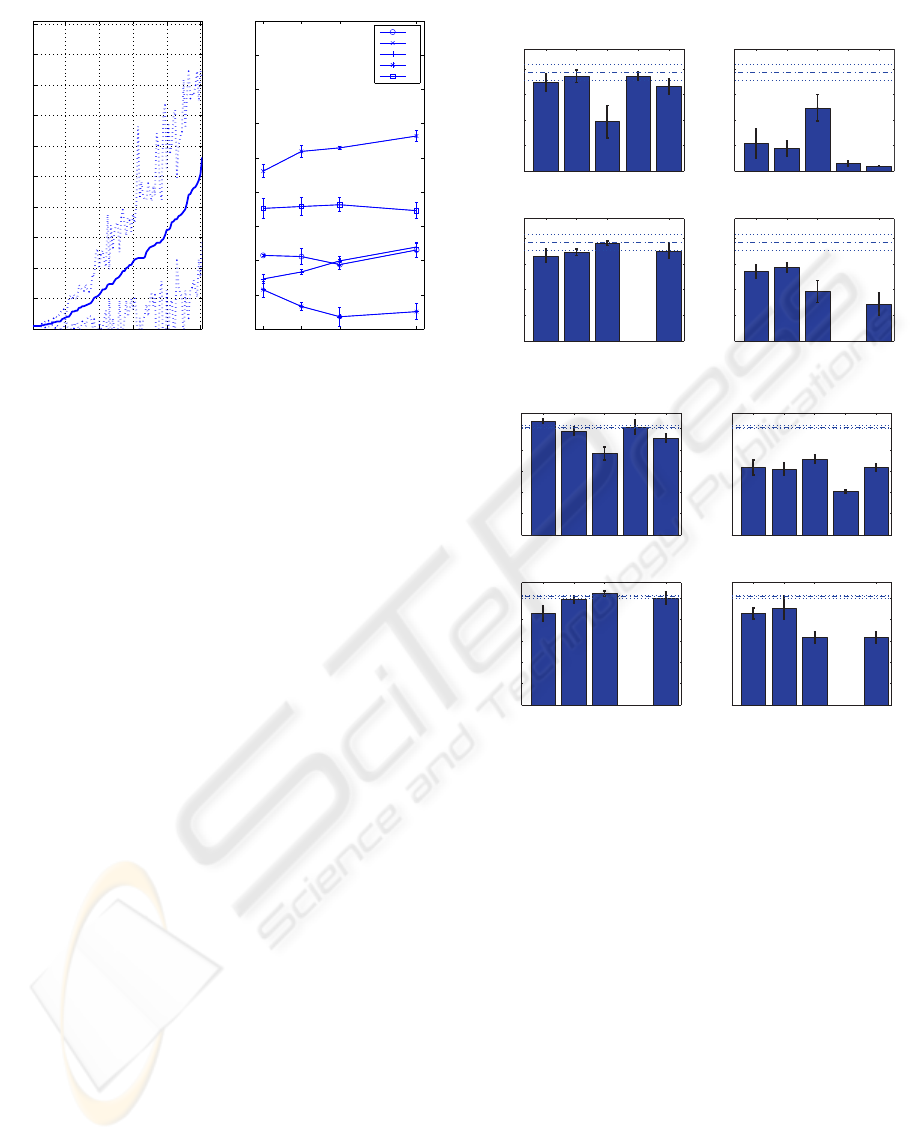
For two training images, the correct-
categorization performance was ca. 19 percent;
the average ranking value was ca. 16, that is the
rank number at which the correct category appears
(1=correct categorization; 51=random ranking). The
left graph in Figure 3 shows the average ranking
for all categories: about half of the categories were
ranked among the top 18; the last 10 categories
seemed randomly ranked (value around 51).
The average descriptor weight was highest for the
area vector, likely because the descriptor contained
the largest number of dimensions (12). Given the
small number of dimensions for the contour pair vec-
tor, its average weight was relatively high.
The performance for individual descriptors and
scales, as well as knock-out (leave-one-out) simula-
tions is depicted in Figure 4. The contour-pair de-
scriptor had the largest impact on performance, which
is evidenced by the large individual performance (ca.
13 percent, see ’Descriptor Individual’) and by the
significant performance decrease for a knock-out sim-
ulation (ca. 10 percent, see ’Descriptor KnockOut’).
Lower (spatial) scales were more effectivethan higher
spatial scales, e.g. 14 and 15 percent for scales 1 and
2.
For the COREL collection, the categorization per-
formance was slightly lower (17 percent, two training
images) and the performance pattern for the various
tests looked similar.
A learning process for 5 images was also tested
for the Caltech collection only. Firstly, category-
specific descriptors for each pair of images are de-
termined, followed by pooling the ones that were dif-
ferent amongst image pairs. The number of features
increased by ca. 40 percent, but the performance
increased only by 25 percent (Figure 4b), a rather
marginal increase. However the performance of in-
dividual descriptors increased by several folds except
for the pairing vector.
VISAPP 2010 - International Conference on Computer Vision Theory and Applications
484
20 40 60 80 100
0
10
20
30
40
50
60
70
80
90
100
Ordered Categories
Ranking no./Distinctness
Ranking
1 2 3 5
0.89
0.9
0.91
0.92
0.93
0.94
0.95
0.96
0.97
0.98
Scale
Average Weight
Avg. Weight/Descriptor
c
a
p
t
r1
Figure 3: Performance analysis for 2 training images.
Left: Average ranking with corresponding standard devi-
ation (dotted). Right: Average weight per descriptor and
scale. Error bars: standard deviation of crossfolds.
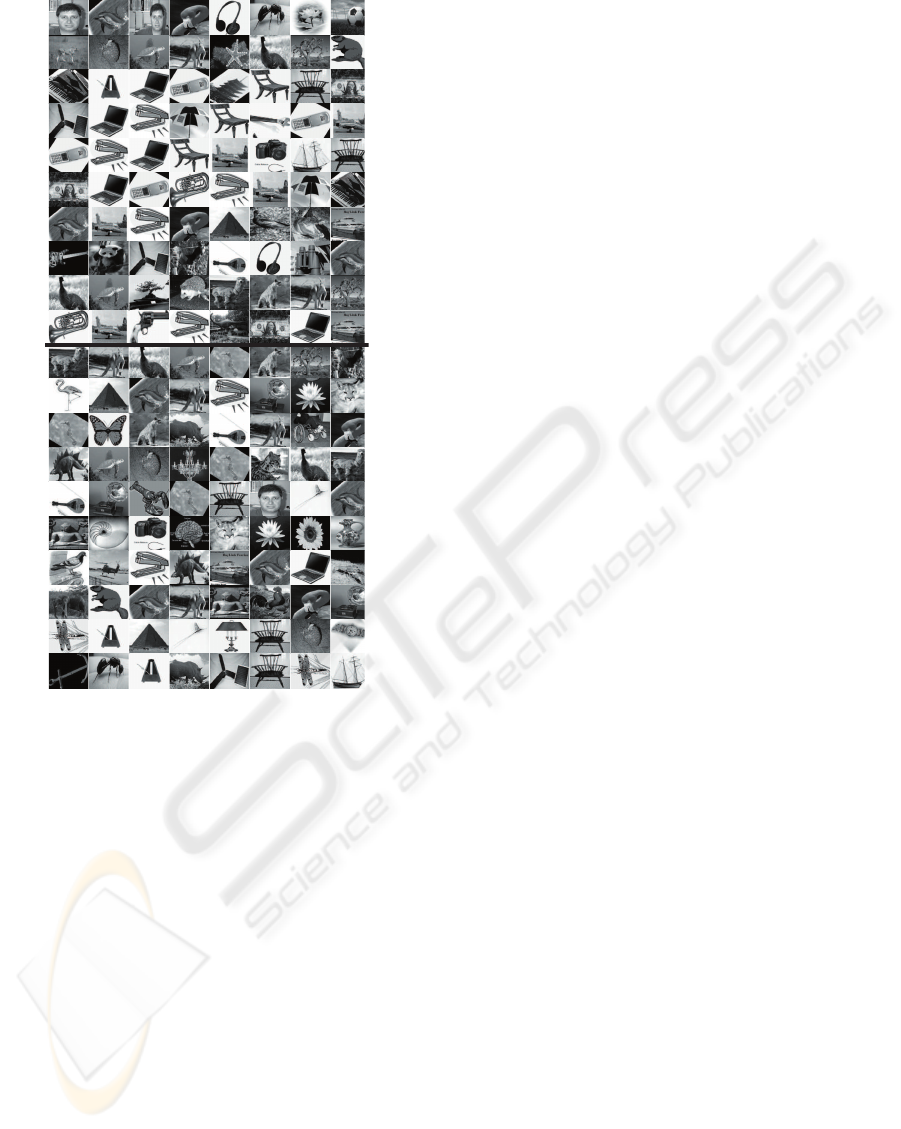
Figure 5 shows the 7 most similar categories for the
10 best- and worst-ranking categories. Even for the
worst-ranking categories the similar categories can
show structural similarities; sometimes, the similar
categories correspond to the same super-ordinate cat-
egory, e.g. animal categories would select other ani-
mals as similar categories.
4 DISCUSSION
The overall categorization performance (19 percent
for 2 training images) is not quite comparable yet to
other categorization attempts (up to 50 percent for 2
training images, see citations in introduction), but the
study demonstrates the power of expressing contours
as vectors and relating them by simple vector calcula-
tion. Furthermore and more importantly, the present
approach bears the possibility to interpret the prepro-
cessing output if a more detailed understanding of the
image is desired, e.g. the parameters describe very ac-
curately the geometry and spatial location of contours
and areas. This is a specificity that none of the other
image classification systems provides.
One potentially simple way to increase the per-
formance is to combine our approach with an ap-
proach that is based on appearance, e.g. (Perronnin
et al., 2006; Lowe, 2004). However, to implement a
complete image understanding system, it requires the
structural thoroughness as pursued here. There are
many other sites, where the system can be improved
but we expect the largest performance increase from
the following improvements: a) refined grouping, for
c a p t r1
0
5
10
15
20
Percent
Descriptor KnockOut
c a p t r1
0
5
10
15
20
Percent
Descriptor Individual
1 2 3 5
0
5
10
15
20
Percent
Scale Knock Out
1 2 3 5
0
5
10
15
20
Percent
Scale Individual
c a p t r1
0
5
10
15
20
25
Percent
Descriptor KnockOut
c a p t r1
0
5
10
15
20
25
Percent
Descriptor Individual
1 2 3 5
0
5
10
15
20
25
Percent
Scale Knock Out
1 2 3 5
0
5
10
15
20
25
Percent
Scale Individual
a 2 training images
b 5 training images
Figure 4: Performance (correct categorization) for 2 and
5 training images (a and b) for descriptor knock-out (up-
per left), individual descriptors (upper right), spatial scale
knock-out (lower left) and individual scale (lower right).
Note the performance increase for individual descriptors for
5 training images (compare upper right graph of a and b).
Stippled horizontal line: total performance; dotted lines and
error bars: standard deviation of crossfolds. c: contours; a:
areas; p: polygons; t: textures; r1: regions.
instance a grouping by geometrical similarity; b) fur-
ther distance measurements and parameterization, for
instance clusters of intersections; c) a probabilistic
formulation of the presence of descriptors for a cat-
egory representation; d) a better learning process.
THE POTENTIAL OF CONTOUR GROUPING FOR IMAGE CLASSIFICATION
485
y
n
e
r
Similar Categories...
___________________________________
BEST
WORST
Selected
Figure 5: Best and worst performing categories and their
most similar categories, top ten and bottom ten rows respec-
tively (Caltech 101). The first image in each row, represents
a randomly selected image of that category; the remaining
7 images represent the most similar categories with increas-
ing distance.
REFERENCES
Bileschi, S. and Wolf, L. (2007). Image representations be-
yond histograms of gradients: The role of gestalt de-
scriptors. In IEEE Computer Society Conference on
Computer Vision and Pattern Recognition, pages 1–8.
Blum, H. (1973). Biological shape and visual science (part
I). Journal of Theoretical Biology, 38:205–287.
Dollr, P., Tu, Z., and Belongie, S. (2006). Supervised learn-
ing of edges and object boundaries. In IEEE Computer
Society Conference on Computer Vision and Pattern
Recognition, pages 1964–1971.
Felzenszwalb, P. and McAllester, D. (2006). A min-cover
approach for finding salient curves. In IEEE Con-
ference on Computer Vision and Pattern Recognition,
page 185.
Fergus, R., Perona, P., and Zisserman, A. (2007). Weakly
supervised scale-invariant learning of models for vi-
sual recognition. International Journal Of Computer
Vision, 71(3):273–303.
Lazebnik, S., Schmid, C., and Ponce, J. (2006). Beyond
bags of features: Spatial pyramid matching for rec-
ognizing natural scene categories. In IEEE Computer
Society Conference on Computer Vision and Pattern
Recognition.
Lowe, D. G. (1985). Perceptual Organization and Visual
Recognition. Kluwer Academic Publishers, Boston.
Lowe, D. G. (1989). Organization of smooth image curves
at multiple scales. International Journal of Computer
Vision, 3:119–130.
Lowe, D. G. (2004). Distinctive image features from scale-
invariant keypoints. International Journal of Com-
puter Vision, 60(2):91–110.
Maire, M., Arbelez, P., Fowlkes, C., and Malik, J. (2008).
Using contours to detect and localize junctions in nat-
ural images. In IEEE Conference on Computer Vision
and Pattern Recognition, pages 1–8.
Nelson, R. C. and Selinger, A. (1998). A cubist approach to
object recognition. In Sixth International Conference
on Computer Vision.
Oliva, A. and Torralba, A. (2001). Modeling the shape of
the scene: A holistic representation of the spatial en-
velope. Int. J. Comput. Vision, 42(3):145–175.
Opelt, A. and Prinz, A. (2006). Fusing shape and appear-
ance information for object category detection. In
British Machine Vision Conference (BMVC).
Perronnin, F., Dance, C., Csurka, G., and Bressan, M.
(2006). Adapted vocabularies for generic visual cate-
gorization. In European Conference on Computer Vi-
sion, Graz, Austria, volume 4, pages 464–475.
Rasche, C. (2009). An approach to the parameterization
of structure for fast categorization. Int. J. Comput.
Vision.
Shotton, J., Blake, A., and Cipolla, R. (2008). Multi-
scale categorical object recognition using contour
fragments. IEEE Transactions of Pattern Analysis and
Machine Intelligence, 30(7):1270–1281.
Torralba, A., Castelhano, M. S., Oliva, A., and Hender-
son, J. M. (2006). Contextual guidance of eye move-
ments and attention in real-world scenes: the role of
global features in object search. Psychological Re-
view, 113:766–786.
Zheng, S., Tu, Z., and Yuille, A. L. (2007). Detecting object
boundaries using low-, mid, - and high-level informa-
tion. In IEEE Conference on Computer Vision and
Pattern Recognition, Minneapolis, USA, pages 1–8.
VISAPP 2010 - International Conference on Computer Vision Theory and Applications
486
