
ITERATIVE DENSE CORRESPONDENCE CORRECTION
THROUGH BUNDLE ADJUSTMENT FEEDBACK-BASED ERROR
DETECTION
Mauricio Hess-Flores
1
, Mark A. Duchaineau
2
, Michael J. Goldman
3
and Kenneth I. Joy
4
1,4
Institute for Data Analysis and Visualization, University of California - Davis, Davis, CA, U.S.A.
2,3
Lawrence Livermore National Laboratory, Livermore, CA, U.S.A.
Keywords:
Dense correspondences, Pose estimation, Scene reconstruction, Bundle adjustment, Resolution pyramid, Error
analysis.
Abstract:
A novel method to detect and correct inaccuracies in a set of unconstrained dense correspondences between
two images is presented. Starting with a robust, general-purpose dense correspondence algorithm, an initial
pose estimate and dense 3D scene reconstruction are obtained and bundle-adjusted. Reprojection errors are
then computed for each correspondence pair, which is used as a metric to distinguish high and low-error cor-
respondences. An affine neighborhood-based coarse-to-fine iterative search algorithm is then applied only on
the high-error correspondences to correct their positions. Such an error detection and correction mechanism
is novel for unconstrained dense correspondences, for example not obtained through epipolar geometry-based
guided matching. Results indicate that correspondences in regions with issues such as occlusions, repetitive
patterns and moving objects can be identified and corrected, such that a more accurate set of dense correspon-
dences results from the feedback-based process, as proven by more accurate pose and structure estimates.
1 INTRODUCTION
The computation of dense image correspondences has
been of great importance recently in several Computer
Vision applications. For example, the registration of
succesive frames in a video sequence into a common
coordinate system at the pixel level enables applica-
tions such as dense 3D reconstruction of the viewed
scene, segmentation of background and moving ob-
jects and data compression. The main problem with
the use of dense correspondences is that inaccuracies
in their estimation can arise whenever there are cer-
tain conditions such as occlusions and moving objects
present in the scene, and also in regions with little
texture or repetitive patterns. Such conditions do not
necessarily affect algorithmsfor sparse feature match-
ing, but certain applications, like the ones mentioned,
strictly call for the use of dense correspondences, and
any of these adverse conditions ultimately affect the
quality of such applications.
To this end, this paper describes a novel method
for detecting and correcting inaccurate dense cor-
respondences, giving the proof of concept for the
case of two input images. The detection and cor-
rection mechanism is enabled by feedback after es-
timating camera poses and scene structure from the
two views and applying bundle adjustment. Using re-
projection error after bundle adjustment as the met-
ric to separate high-error and low-error correspon-
dences, an affine neighborhood-based coarse-to-fine
iterative algorithm is applied to correct high-errorcor-
respondences. The main assumption is that the in-
put dense correspondence set must be unconstrained;
for example it cannot have been generated from tech-
niques such as guided matching (Hartley and Zisser-
man, 2004) for the algorithm to work. The reprojec-
tion error metric used to detect errors has no mean-
ing for correspondences constructed assuming a per-
fect fit of these to a given epipolar geometry, as will
be detailed later. An important motivation for using
feedback after bundle adjustment is to avoid applying
the correction mechanism to all available correspon-
dences, which would result in 10 − 20x slower pro-
cessing times during this phase. While it is not the ob-
jective of the work presented here to explicitly solve
for the occlusion problem in reconstruction or detect
moving objects, the end goal is to achieve the best
possible correspondenceaccuracy in such problem ar-
eas, even if it implies a higher computational expense,
which makes it important to apply only where neces-
400
Hess-Flores M., A. Duchaineau M., J. Goldman M. and I. Joy K. (2010).
ITERATIVE DENSE CORRESPONDENCE CORRECTION THROUGH BUNDLE ADJUSTMENT FEEDBACK-BASED ERROR DETECTION.
In Proceedings of the International Conference on Computer Vision Theory and Applications, pages 400-405
DOI: 10.5220/0002816104000405
Copyright
c
SciTePress

sary. Experimental results on real and synthetic data
sets indeed show an overall improvement in the ac-
curacy of the dense correspondence set after applying
the procedure.
Error detection for dense correspondences has
been done in the past, but either under simplify-
ing assumptions or with respect to ground-truth data.
In (Xiong and Matthies, 1997), matching errors are
identified and corrected, but only one specific scene
type is handled. The algorithm in (Mayoral and Au-
rnhammer, 2004) evaluates matching algorithms by
introducing an error surface from matching errors.
In both cases, the simplifying assumption of search-
ing for disparity along scanlines is made. An ex-
haustive overview and evaluation of dense correspon-
dence algorithms is given in (Scharstein and Szeliski,
2002), though the comparisons are done with respect
to ground-truth values. As for error correction, an al-
gorithm known as optimal triangulation (Hartley and
Zisserman, 2004) makes an attempt to correct corre-
spondences based on the pre-computed epipolar ge-
ometry between the scenes. However, such a cor-
rection, while mathematically correct and obtained
by minimizing a geometrically meaningful criterion,
does not necessarily produce matches that are correct
in reality; it also reduces reprojection error after re-
construction to zero, thus preventing error detection
using such a criteria.
An initial reconstruction of the scene from the two
input views is needed as part of the algorithm, so a
brief overview of the relevant literature on this sub-
ject is now given. In general, a reconstruction pipeline
consists of obtaining matches (correspondences) be-
tween the images, then computing the relative camera
poses between them and finally computing the struc-
ture of the scene. The matches used for the initial
pose estimation can either be sparse features (for ex-
ample corners) or dense correspondences, which as-
sign a correspondence in a destination image to each
source image position, and can be computed through
a variety of methods (Scharstein and Szeliski, 2002).
For two views, the epipolar geometry between them,
encapsulated by the fundamental matrix F (Hartley
and Zisserman, 2004), can be computed from the ini-
tial matches. This matrix can be computed through
direct methods, such as in (Stew´enius et al., 2006;
Hartley and Zisserman, 2004) as well as through non-
linear methods (Hartley and Zisserman, 2004). The
RANSAC algorithm can be coupled with these meth-
ods to help obtain more robust estimates for F. Using
the computed epipolar constraints, more matches can
be generated across the images to obtain dense cor-
respondences (details can be found in (Hartley and
Zisserman, 2004)). Again, an issue with such con-
strained correspondences is that the new matches de-
pend directly on the quality of the estimated epipolar
geometry, making them mathematically valid but not
necessarily correct.
Once matches are available, either sparse or dense,
the relative pose (rotation and translation) between the
cameras viewing the scene can be computed. Several
methods exist, and an overview of different pose es-
timators is given in (Rodehorst et al., 2008). In the
particular case that the F matrix is available or has
been computed from matches, and if the camera’s in-
trinsic parameters (such as the focal length, skew and
principal point) are assumed known, the essential ma-
trix E can be computed and decomposed into the rel-
ative rotation and translation. Finally, the scene’s 3D
structure can be obtained using the available sparse
or dense matches. Typically, linear or optimal tri-
angulation (Hartley and Zisserman, 2004) is applied
on each correspondence pair to generate a 3D posi-
tion corresponding to the scene structure. Once pose
and structure estimates are available, a common fine-
tuning step for both estimates is to carry out a bun-
dle adjustment, where the total reprojection error of
all computed 3D points in all cameras is minimized
using non-linear techniques (Hartley and Zisserman,
2004). Fortunately, sparsity in the data has allowed
for great speed-ups in this process (Lourakis and Ar-
gyros, 2000).
By coupling the use of unconstrained dense cor-
respondences in a bundle-adjusted reconstruction
pipeline, a novel mechanism to identify the most inac-
curate dense correspondences and correct them using
an iterativemethod can be achieved. The entire proce-
dure will be described in detail in Section 2, followed
by experimental results (Section 3) and conclusions
(Section 4).
2 PROPOSED ALGORITHM
2.1 Pose and Structure Estimation
based on Dense Correspondences
The first step in our algorithm is to compute uncon-
strained dense correspondences between two images,
for which a sub-pixel accuracy direct method which
solves coarse-to-fine on 4 − 8 mesh image pyramids
with a 5x5 local affine motion model was used, as out-
lined in (Duchaineau et al., 2007). There are several
reasons for starting out with such a general-purpose
dense correspondence algorithm. First of all, our in-
tended applications, such as dense scene reconstruc-
tion and image stitching, call for the use of dense
ITERATIVE DENSE CORRESPONDENCE CORRECTION THROUGH BUNDLE ADJUSTMENT
FEEDBACK-BASED ERROR DETECTION
401

as oppposed to sparse matching. Now, by not us-
ing epipolar constraints as in guided matching, it al-
lows for errors in the dense correspondences to be
unmasked in later stages. Additionally, it is a more
general approach that adequately samples the scene;
for example sparse feature matchers could fail to find
a significant amount of features in regions with little
intensity variation, whereas dense correspondences
could still be obtained. However, as mentioned ear-
lier dense correspondences are prone to errors result-
ing from occlusions, moving objects, texture-less re-
gions and repetitive patterns. For now, the next steps
(pose and structure estimation) must proceed despite
these errors, but it will be explained in Section 2.2
how these issues can be respectively detected and cor-
rected through a novel mechanism based on feedback.
The first step in estimating the relative pose be-
tween the two cameras is to estimate the 3x3 funda-
mental matrix F, which encapsulates the epipolar ge-
ometry between the two views. The direct and ro-
bust 5-point method (Stew´enius et al., 2006) embed-
ded in RANSAC is currently being used. It is impor-
tant to mention that even though a large amount of
correspondences are available for estimating F, only
a small number are actually needed. Even if the min-
imal amount is used, the use of RANSAC coupled
with random sampling ensures that a reliable F can
be estimated in a computationally-efficient yet accu-
rate manner. Now, the essential matrix E is obtained
from the fundamental matrix, assuming known intrin-
sic parameters for the camera, and factorized into the
rotation and unit translation (R, t) pair representing
the pose. To obtain the scene structure as a set of
3D points for each correspondence pair, linear trian-
gulation was used. A dense scene structure must be
computed, since it will be used as part of the error de-
tection and correction mechanism based on feedback
that will be described later on.
The objective of the next step, bundle adjustment,
is to adjust pose and structure estimates in such a way
that the total reprojection error of the 3D points with
respect to their corresponding 2D correspondences in
each camera is minimized (Hartley and Zisserman,
2004). The cost function which is traditionally mini-
mized can be expressed as the sum of squares of the
geometric (reprojection) error between each 3D point
and the correspondenceswhich yielded it, as shown in
Equation 1 for the general case of N 3D points seen
in M cameras, though it must be kept in mind that in
this work we use only two cameras.
min(a
j
, b
i
)
N
∑
i=1
M
∑
j=1
v
ij
(d(Q(a
j
, b
i
), x
ij
))
2
(1)
Here, x
ij
is the position of the i
th
correspondence on
image j. The binary variable v
ij
equals ‘1’ if point i is
visible in image j (‘0’ otherwise). The vectors a
j
and
b
i
parameterize each camera j and 3D point i, respec-
tively, with Q(a
j
, b
i
) as the reprojection of point i on
image j. Finally, d is the Euclidean distance in each
image between each original correspondence and its
associated reprojection. This minimization involves a
total of 3N + 11M parameters, and can be achieved
using the Levenberg-Marquardt algorithm. An im-
plementation that exploits the sparse block structure
of the normal equations solved at each iteration to
greatly speed up the process was used; details are
presented in (Lourakis and Argyros, 2000). Bundle
adjustment must be applied to the entire structure, in
order to allow for detection of high-error correspon-
dences, as outlined next.
2.2 Outlier Correspondence Detection
and Correction
Once bundle adjustment has been applied on the
structure and two cameras, all correspondences are
now classified based on the reprojection error of the
3D point each pair generated; those classified as hav-
ing low reprojection errors will be referred to as in-
liers, and high-error ones as outliers. Since bundle
adjusment is the maximum-likelihood estimator for
zero-mean Gaussian noise, the optimized pose and
structure estimates (plus the known intrinsic param-
eters) allow for the ‘unmasking’ of errors purely in
the correspondences in this step. If very erroneous
initial pose and structure estimates arise from a very
inaccurate input dense correspondence set, optimiza-
tion may actually guide the estimates away from the
global optimum in such cases, thus failing to unmask
pure correspondence errors, but it is assumed that a
reasonable amount of correspondences are accurate
enough such that initial pose and structure estimates
are in the vicinity of their optimal values.
The reprojection error for the i
th
correspondence
pair is taken as the sum of the absolute values of
the errors obtained by reprojecting its resulting 3D
point into each individual image. Then, a threshold
on the reprojection error r
i
(Equation 2) given opti-
mized cameras ˆa
j
and structure
ˆ
b
i
is established, such
that correspondence pairs whose error is above the
threshold are deemed outliers, while the rest are in-
liers. Without this threshold, or with a low one, the
procedure described in the next section (whose pro-
cessing time is linear in the amount of pixels) would
be applied to nearly every pixel in the image, which
is expensive. On the other hand, a higher threshold
would imply faster processing, but with the downfall
that some correspondences with relatively substantial
VISAPP 2010 - International Conference on Computer Vision Theory and Applications
402

Figure 1: Applying a low threshold to detect outliers from a
set of correspondences (left) results in unnecessary process-
ing (middle left), while a high threshold erroneously yields
very few outliers (middle right). An appropriate threshold
must identify only the problematic regions (right).
errors are left uncorrected. This is shown in Figure 1,
which shows the effect of the used threshold on the
number of detected outliers. The algorithm should
solely detect high-error correspondences in problem-
atic regions. An analysis of the reprojection error his-
tograms for different data sets reveals that the curves
gradually taper off as the reprojection error grows.
This observation is key towards determining an ap-
propriate threshold. From visual observation of the
detected outliers using different thresholds for differ-
ent real and synthetic data sets, along with the cor-
responding histogram information, it was determined
that a threshold t of an average (as defined in Equa-
tion 3) plus 1.5 standard deviations (Equation 4) of
the reprojection errors results in an appropriate out-
lier detection.
r
i
=
2
∑
j=1
|d(Q( ˆa
j
,
ˆ
b
i
), x
ij
)| (2)
µ
r
=
1
N
N
∑
i=1
r
i
(3)
t = µ
r
+ 1.5
s
1
N
N
∑
i=1
(r
i
− µ
r
)
2
(4)
Next, for a given outlier correspondence pair, the
objective is to correct the position of the match in the
second (target) image to the information in the first
(source) image, while keeping the position in the first
image fixed, to find a better match than the one cur-
rently available. The algorithm works on a coarse-to-
fine resolution pyramid, where a fixed amount of it-
erations (typically hundreds) is applied per resolution
level, such that the pixel count doubles at each level.
After constructing the hierarchy, a sub-pixel accurate
iterative, three-phase algorithm is applied at succes-
sively finer levels. Each iteration consists of perturba-
tion, matching (based on gradient descent) and affine-
fitting phases. The resulting transformation for level i
of the hierarchy is used as a starting prediction at level
i+ 1.
Starting at the coarsest level, a fixed-size image
chip from the source image is centered at the start po-
sition on the target image. The first phase of one it-
eration, perturbation, consists of adding noise to the
source image chip in order to avoid local minima
which could possibly occur in the next phase, which is
based on gradient descent. In this matching phase, for
each pixel of the source image chip, a local gradient
is computed at its current position in the target image.
This gradient is used to makea linear prediction of the
direction and distance to move the source pixel in the
target image to match its intensity (Duchaineau et al.,
2007). Each pixel moves independently in this phase.
For robustness, the movement step size is only a frac-
tion of a pixel, and further modified according to the
magnitude of the gradient. As the gradient magnitude
becomes small (as determined by an adaptive thresh-
old), the gradient direction becomes more noise than
signal, and such pixels are eliminated from use in the
next phase. In the final phase, a least-squares fit is
applied to find an affine transformation to be applied
to the source image chip. Only those pixels inside
the chip that were not eliminated during the matching
phase are used. The three-phase process is iterated a
number of times at this coarsest level first and then
at succesively higher resolutions, resulting in a new
and more accurate correspondence position in the tar-
get image once completed. The process is illustrated
in Figure 2. For an aerial view of a small section
of a road with vehicles, the upper left image shows
the initial position of the image chip, where gradi-
ents are color-coded such that the largest gradients
are displayed in lighter colors. Results of the three-
phase algorithm are also illustrated for a given itera-
tion: the upper right image shows the result of noise
perturbation followed by matching, where the image
depicts (via tilts in the pixels) the direction and also
the movement of each individual pixel, and the lower
left image shows the affine fit computed from this
information. The lower right image shows marked
with an ‘X’ those pixels that were eliminated in the
matching phase. Though this correction process is
expensive, the goal is to achieve more accurate cor-
respondences by taking into account the actual struc-
ture of the neighborhood around a given point, which
is more strict than using just the pure epipolar con-
straint, which could be geometrically but not physi-
cally correct.
To determine the most appropriate fixed neighbor-
hood size, the improvement percentage in the aver-
age reprojection error for detected outliers with re-
spect to the average obtained before correction was
tested for different sizes. It was concluded that sim-
ilar results are obtained, which is quite remarkable
and indicates that the correction process is very robust
ITERATIVE DENSE CORRESPONDENCE CORRECTION THROUGH BUNDLE ADJUSTMENT
FEEDBACK-BASED ERROR DETECTION
403
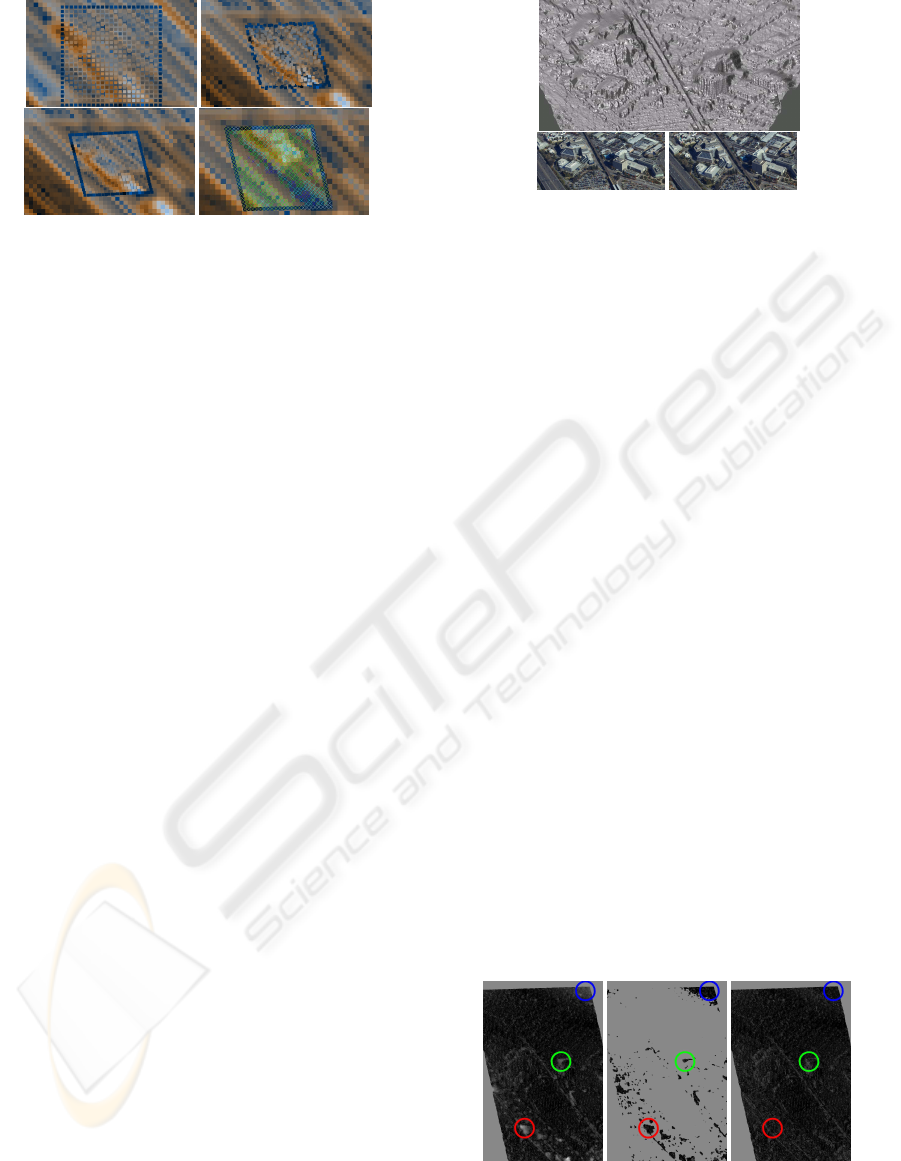
Figure 2: Affine correction process (see text for details).
even when using a relatively small neighborhood. For
the Aerial Views I (Oxford Visual Geometry Group,
2009) data set, though slightly better results are ob-
tained for a large 59x59 neighborhood (3.04% im-
provement), an 11x11 size (2.9% improvement) was
chosen as it yields good results with only a fraction
of the processing time. Results were actually worse
(1.9% improvement) for a 35x35 neighborhood.
3 EXPERIMENTAL RESULTS
In this section the results of the presented approach
are analyzed. Both real and synthetic data sets were
used to test the algorithm. Tests on real imagery in-
cluded an aerial imagery data set, which will be re-
ferred to as Downtown, and two publicly-available
data sets: Aerial Views I (Oxford Visual Geome-
try Group, 2009) and Rocks 2 (Hirschm¨uller and
Scharstein, 2007). Figure 3 shows the resulting 3D
structure obtained after correction using an image pair
from the Downtown data set. Figure 4 shows repro-
jection errors after bundle adjustment (color-coded
such that white means a high error and black a low
one, over a uniform gray background) for the same
image pair. It is clear that the higher errors in gen-
eral are seen on structures that tend to have plain or
repetitive patterns, for example on highways and train
tracks (circled in red), near occlusion edges (green)
and near the edges of the image (blue). After ap-
plying the proposed method, it can be seen that re-
projection errors in these areas are generally lower,
and the reconstruction is very accurate as seen in Fig-
ure 3 for such areas. The highest remaining errors
are seen near occlusion edges, which makes sense
since there is information missing in such areas (as
opposed to texture-less regions, which can potentially
be matched with enough neighborhood information).
A synthetic scene, which will now be referred to
as Coneland was also used to test the proposed al-
gorithm. Figure 5 shows results of the outlier de-
tection and correction from two images of this data
Figure 3: Closeups of a reconstruction (top) and its two in-
put images from the Downtown data set (bottom), after out-
lier correction.
set. A ground-truth evaluation of the proposed algo-
rithm was also performed. Table 1 shows the pose
errors with respect to the ground-truth values when
using the original set of dense correspondences ver-
sus the modified set after applying the proposed algo-
rithm for the Coneland data set. Translational error
is obtained as the angle in degrees of the dot prod-
uct between the ground-truth translation and each es-
timate. Rotational error is obtained as the angle for
the quaternion corresponding to the difference rota-
tion matrix between ground-truth and estimated rota-
tions for each case. It can be seen that pose estimates
improve, even though the robust RANSAC is used
to estimate F, showing that an overall more accurate
set of correspondences is indeed achieved. Table 2
shows the outlier percentage and outlier reprojection
error improvement percentage when applying the al-
gorithm for some of the test data sets. At first glance
the improvements may seem small, but when dealing
with sub-pixel accuracy even small errors can result
in large structural inaccuracies, so in practice the im-
provement is substantial.
One possible improvement for the algorithm is to
use adaptive neighborhood sizes for the outlier cor-
rection process, based on intensity variation statistics
for a given chip position. Using larger chips could
potentially yield more accurate results in texture-less
regions. The use of hardware solutions (such as using
GPU’s) to speed up expensive processes must also be
further analyzed.
Figure 4: Reprojection errors after bundle adjustment (left)
for an image of the Downtown data set. The detected and
corrected outliers are shown (middle), along with errors for
the resulting set of correspondences (right).
VISAPP 2010 - International Conference on Computer Vision Theory and Applications
404
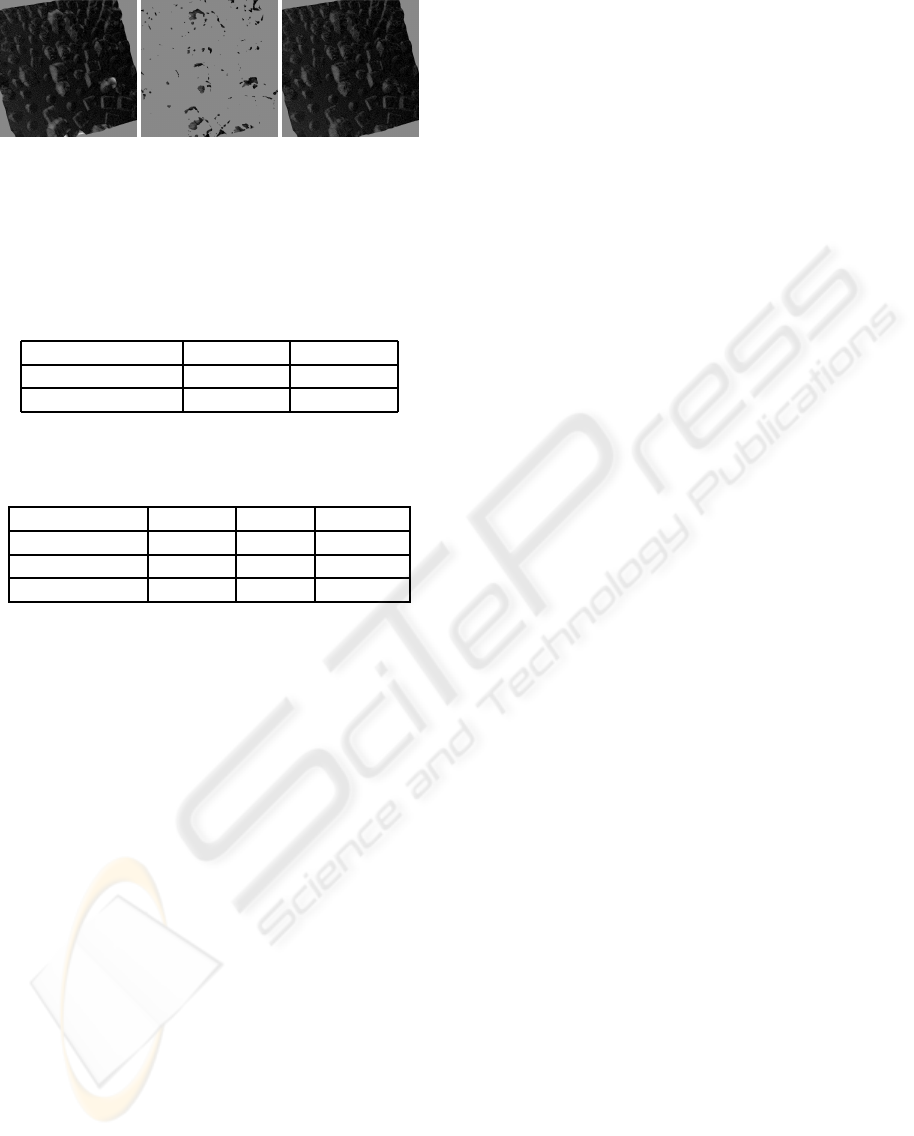
Figure 5: Reprojection errors after bundle adjustment (left)
for an image of the Coneland data set. The detected and
corrected outliers (middle) are shown, along with the errors
for the resulting set of correspondences (right).
Table 1: Pose errors △
R
for rotation and △
T
for translation
(in degrees) with respect to ground-truth values using orig-
inal and modified dense correspondences, for the Coneland
data set.
Correspondences △
R
△
T
Original 9.818953
◦
2.443838
◦
Modified 0.167859
◦
0.418460
◦
Table 2: Outlier percentage, average outlier reprojection er-
ror µ
E
(in pixels) before correction and error improvement
percentage △
E
for tested data sets.
Data set Outliers µ
E
△
E
Downtown 5.442% 2.072 10.956%
Aerial Views I 8.475% 11.392 3.234%
Coneland 5.753% 2.759 3.404%
4 CONCLUSIONS
This paper presented a new method for detecting
and correcting outlier dense correspondencesbetween
two images. Initial estimates for the pose and scene
structure are obtained from the given dense corre-
spondences, assuming known camera intrinsic pa-
rameters, and are then bundle-adjusted. The result-
ing reprojection errors per correspondence pair are
used as a metric to separate high-error and low-
error correspondences. Then, an affine neighborhood-
based iterative algorithm operating on a coarse-to-
fine resolution pyramid is used to correct outlier cor-
respondences. Results on both real and synthetic
scenes show that a more accurate set of dense cor-
respondences is obtained after applying the proposed
method, which results in an improvement in pose and
structure estimates.
REFERENCES
Duchaineau, M., Cohen, J., and Vaidya, S. (2007). To-
ward fast computation of dense image correspondence
on the GPU. In Proceedings of HPEC 2007, High
Performance Embedded Computing, Eleventh Annual
Workshop, pages 91–92, Lincoln Laboratory, Mas-
sachusetts Institute of Technology.
Hartley, R. I. and Zisserman, A. (2004). Multiple View Ge-
ometry in Computer Vision. Cambridge University
Press, 2nd edition.
Hirschm¨uller, H. and Scharstein, D. (2007). Evaluation of
cost functions for stereo matching. In IEEE Computer
Society Conference on Computer Vision and Pattern
Recognition (CVPR 2007), pages 91–92, Minneapolis,
MN.
Lourakis, M. and Argyros, A. (2000). The design and im-
plementation of a generic sparse bundle adjustment
software package based on the Levenberg-Marquardt
algorithm. Technical Report 340, Institute of Com-
puter Science - FORTH, Heraklion, Crete, Greece.
Mayoral, R. and Aurnhammer, M. (2004). Evaluation of
correspondence errors for stereo. In 17th Interna-
tional Conference on Pattern Recognition (ICPR’04),
volume 4, pages 104–107.
Oxford Visual Geometry Group (2009). Multi-
view and Oxford Colleges building reconstruc-
tion. http://www.robots.ox.ac.uk/ vgg/data/data-
mview.html.
Rodehorst, V., Heinrichs, M., and Hellwich, O. (2008).
Evaluation of relative pose estimation methods for
multi-camera setups. In International Archives of
Photogrammetry and Remote Sensing (ISPRS ’08),
pages 135–140, Beijing, China.
Scharstein, D. and Szeliski, R. (2002). A taxonomy and
evaluation of dense two-frame stereo correspondence
algorithms. International Journal On Computer Vi-
sion, 47(1-3):7–42.
Stew´enius, H., Engels, C., and Nist´er, D. (2006). Recent de-
velopments on direct relative orientation. ISPRS Jour-
nal of Photogrammetry and Remote Sensing, 60:284–
294.
Xiong, Y. and Matthies, L. (1997). Error analysis of a real-
time stereo system. In IEEE Conference on Computer
Vision and Patter Recognition (CVPR), pages 1087–
1093.
ITERATIVE DENSE CORRESPONDENCE CORRECTION THROUGH BUNDLE ADJUSTMENT
FEEDBACK-BASED ERROR DETECTION
405
