
FRACTAL ANALYSIS TOOLS FOR CHARACTERIZING THE
COLORIMETRIC ORGANIZATION OF DIGITAL IMAGES
Case Study using Natural and Synthetic Images
Julien Chauveau, David Rousseau, Paul Richard and Franc¸ois Chapeau-Blondeau
Laboratoire d’Ing
´
enierie des Syst
`
emes Automatis
´
es (LISA)
Universit
´
e d’Angers, 62 avenue Notre-Dame du Lac, 49000 Angers, France
Keywords:
Color image, Color histogram, Fractal, Self-similarity, Capacity dimension, Correlation dimension, Pair cor-
relation integral, Feature extraction and analysis, Image modeling, Virtual reality, Vision.
Abstract:
The colorimetric organization of RGB color images is analyzed through the computation of algorithms which
can characterize fractal organizations in the support and population of their three-dimensional color histogram.
These algorithms have shown that complex organizations across scales exist in the colorimetric domain for
natural images with often non-integer fractal dimension over a certain range of scale. In this paper, we apply
this method of colorimetric characterization to synthetic images produced by rendering techniques of increas-
ing sophistication. We show that the fractal or scale invariant signatures are more pronounced when the realism
of the synthetic images increases. Such results could have interesting applications to improve the colorimetric
realism of synthetic images. This also may contribute to progress in classification and vision, in using fractal
colorimetric properties to differentiate natural and synthetic images.
1 INTRODUCTION
Fractal theory provides useful tools to analyze prop-
erties and regularities across scales in images. Frac-
tal structures are well-established in the spatial orga-
nization of static natural images (Mandelbrot, 1983;
Burton and Moorhead, 1987; Schroeder, 1991; Ru-
derman and Bialek, 1994; Gouyet, 1996; Olshausen
and Field, 2000; Hsiao and Millane, 2005) and in
the temporal organization of moving images (Dong
and Atick, 1995). Here, we investigate a third do-
main: the fractal structures in the colorimetric or-
ganization of digital images. This distinct aspect of
color images has only been considered very recently
under the scope of fractal theory and it has been es-
tablished (Chauveau et al., 2008; Chapeau-Blondeau
et al., 2009; Chauveau et al., 2009) that natural color
images can also exhibit a nontrivial self-similar, scale
invariant, fractal organization in the colorimetric do-
main. Possible origins for this fractal organization of
the colors in natural images are under current investi-
gation. A possible hypothesis would be that this frac-
tal behavior in the colorimetric domain would be re-
lated to the properties of the natural scenes, which can
contain many different structures and objects of vari-
ous sizes and colors, appearing at various depths, var-
ious angles, under various lighting and shading con-
ditions. These combined ingredients could lead to
the existence in typical natural scenes, of many col-
ors with each color affected by many modulating fac-
tors, these together building up a fractal organization
for the colors. In this report, we propose to verify this
hypothesis by applying a fractal analysis to synthetic
color images produced by rendering algorithms of in-
creasing sophistication. We analyse the colorimetric
organization across scales demonstrated by these syn-
thetic images, and compare them with the typical frac-
tal behavior of natural images.
2 FRACTAL ANALYSIS OF RGB
HISTOGRAMS
We consider RGB color images with N
pix
pixels. The
three-dimensional color histogram of the color im-
ages is a cloud of points P
n
, n ∈ [1, . . . , N
pix
] dis-
tributed over the Q
3
cells of the colorimetric cube
[0, Q − 1]
3
with Q the dynamic of each of the three
(R, G, B) components. For illustration, Figs. 1 and 2
provide two examples of natural color images with
their three-dimensional color histogram in the RGB
245
Chauveau J., Rousseau D., Richard P. and Chapeau-Blondeau F. (2010).
FRACTAL ANALYSIS TOOLS FOR CHARACTERIZING THE COLORIMETRIC ORGANIZATION OF DIGITAL IMAGES - Case Study using Natural and
Synthetic Images.
In Proceedings of the International Conference on Computer Vision Theory and Applications, pages 245-248
DOI: 10.5220/0002818202450248
Copyright
c
SciTePress
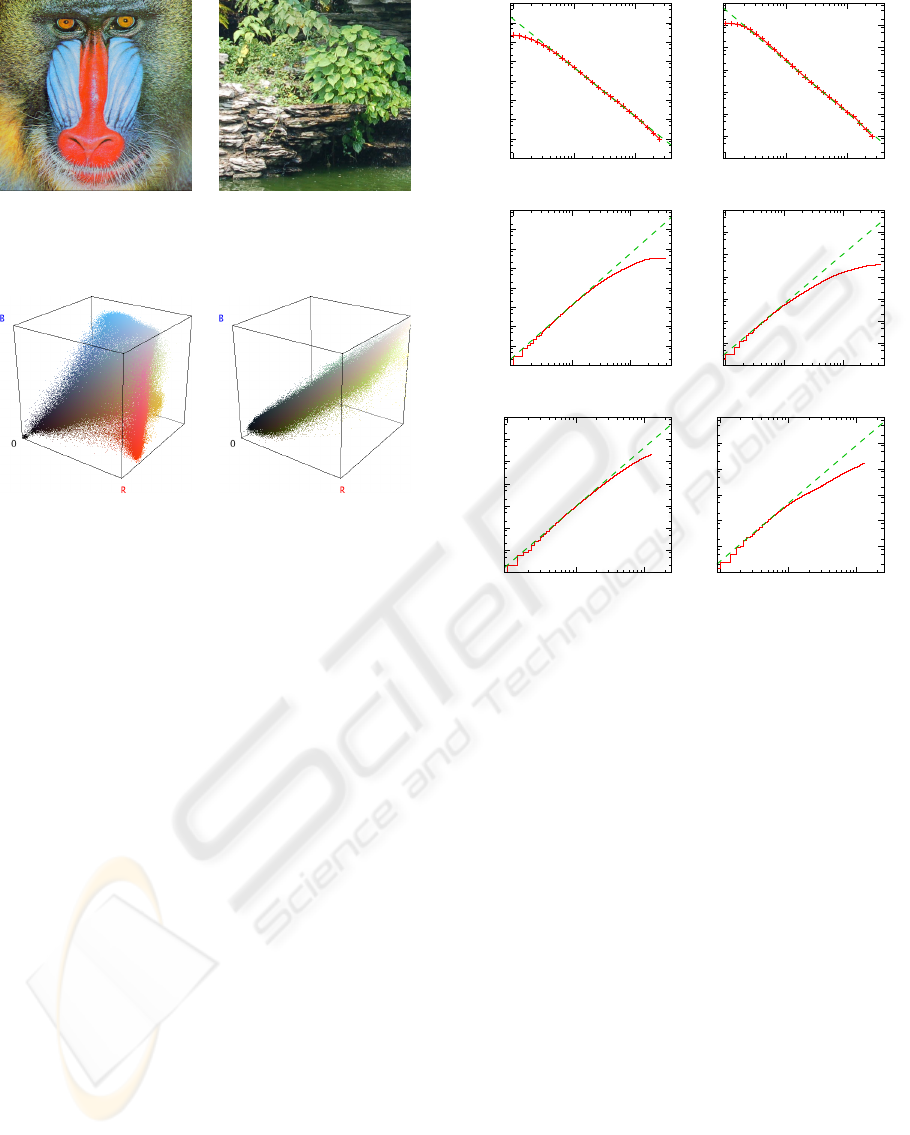
Mandrill Forest
Figure 1: Two natural color RGB images with size 512 ×
512 pixels and Q = 256 levels.
Figure 2: Three-dimensional color histogram in the RGB
colorimetric cube [0, 255]
3
for the images of Fig. 1.
colorimetric cube. In order to characterize the orga-
nization of the three-dimensional color histograms of
images, it has recently been proposed in (Chauveau
et al., 2008; Chapeau-Blondeau et al., 2009; Chau-
veau et al., 2009) to apply fractal analysis tools. These
tools consist of three distinct measures on the three-
dimensional color histogram in the RGB colorimet-
ric cube, as a function of the colorimetric distance r,
which has so been considered as a scale parameter.
As visible in Fig. 3, a fractal signature is observable
in the log-log plots of the three measures N(r), C(r)
and M(r) when applied to natural color images. In the
following, to investigate possible origins of the fractal
properties observed in the colorimetric domain of nat-
ural images, we propose to apply these fractal analysis
tools to synthetic images and analyze their behaviors.
3 RENDERING TECHNIQUES
3.1 Synthetic Images more
Sophisticated
We now perform an image synthesis process, with
several rendering techniques of increasing sophisti-
cation, implemented in succession, in order to insert
more and more realism in the synthesized color im-
ages. We choose first to work with synthetic images
10
-1
10
0
10
1
10
2
10
3
10
4
10
5
10
6
10
7
1 10 100
number of boxes N(r)
box size r
-2.5
Mandrill
10
-1
10
0
10
1
10
2
10
3
10
4
10
5
10
6
1 10 100
number of boxes N(r)
box size r
-2.3
Forest
10
5
10
6
10
7
10
8
10
9
10
10
10
11
10
12
10
13
1 10 100
avg. number of pairs C(r)
colorimetric distance r
2.7
Mandrill
10
6
10
7
10
8
10
9
10
10
10
11
10
12
10
13
1 10 100
avg. number of pairs C(r)
colorimetric distance r
2.2
Forest
10
0
10
1
10
2
10
3
10
4
10
5
10
6
10
7
1 10 100
avg. number of neighbors M(r)
colorimetric distance r
2.6
Mandrill
10
1
10
2
10
3
10
4
10
5
10
6
10
7
1 10 100
avg. number of neighbors M(r)
colorimetric distance r
2.3
Forest
Figure 3: Scale analysis of the color histograms of Fig. 2.
From top to bottom: number N(r) of covering boxes with
size r to cover the color histogram, average number of pairs
C(r) within the colorimetric distance r, and average number
of neighbors M(r) inside the sphere of radius r. The number
is the slope of the dashed line manually adjusted to fit the
measures (solid line) over the largest possible scale range.
based on variations of a simple virtual object like the
classical Utah teapot. Fig. 4 presents the first and the
last of four synthetic images (from image A to D) re-
alized with such a synthesis process. Fig. 5 presents
their respective RGB histograms. Image A is com-
posed of thirteen teapots of various solid colors above
a white background. In image B, two specular lights
have been added. In image C, a gray texture has been
applied to the teapots. And in image D, a gray back-
ground image has been added behind the teapots. The
log-log plots of the three measures N(r), C(r) and
M(r) are presented in Fig. 6. By comparison with
the behavior observed in Fig. 3 for natural images,
we globally observe for the synthetic images of Fig. 4
straight lines over a smaller range of scale r. With the
“box-counting” measure, we observe that the slope of
the line is increasing together with the sophistication
of the generated images. This is caused by the in-
crease of the number of colors used in the images and
the diffusion of the colors in the RGB colorimetric
VISAPP 2010 - International Conference on Computer Vision Theory and Applications
246
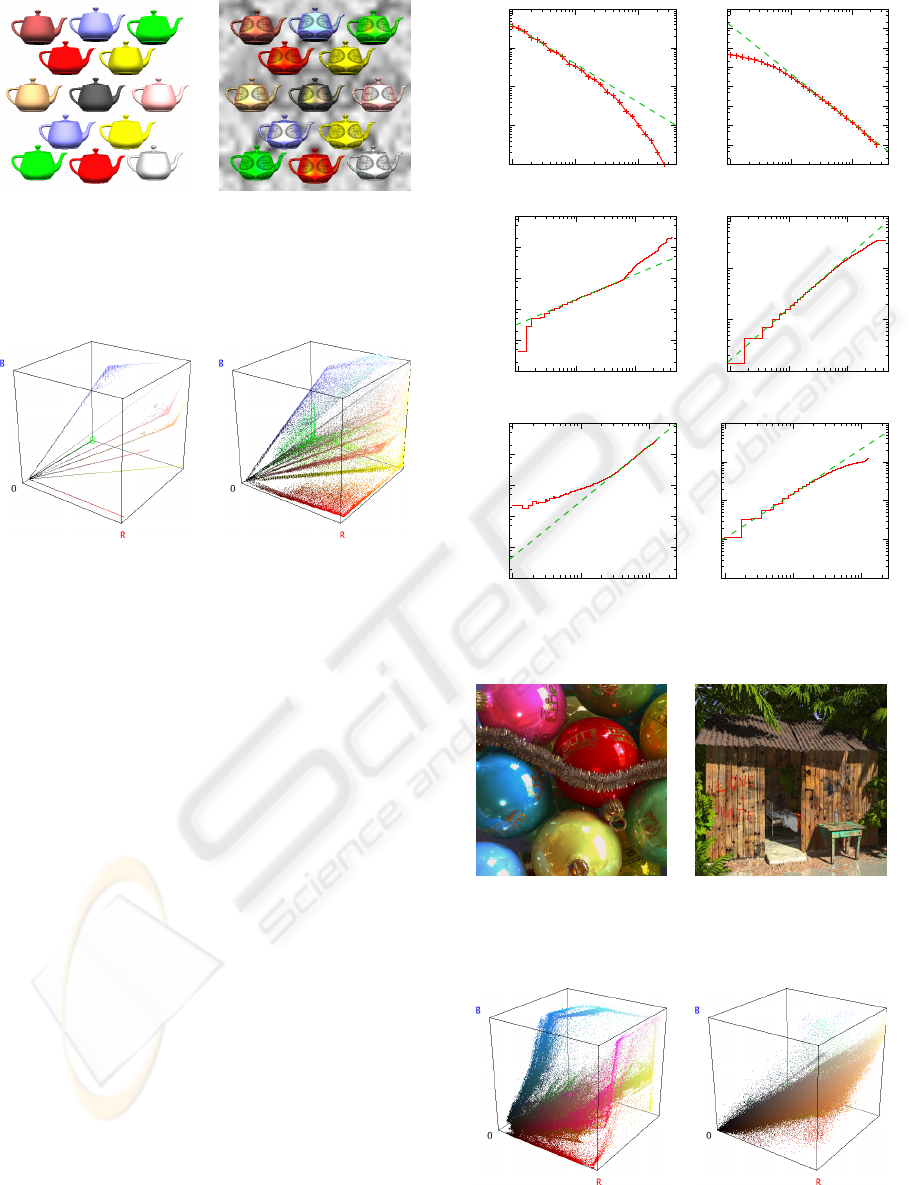
Image A Image D
Figure 4: The first and the last of four synthetic color RGB
images with size 512× 512 pixels and Q = 256 levels, con-
structed in a more and more sophisticated way using various
solid colors, specular lights and textures.
Figure 5: Three-dimensional color histogram in the RGB
colorimetric cube [0, 255]
3
for the images of Fig. 4.
cube. With the “pair-correlation” measure, we ob-
serve in images A to C a slope less than 1, caused
by the presence of the white background that creates
a very large population of white pixels with the same
(R, G, B) components. In image D, the white back-
ground has been replaced by a gray image which adds
a large number of gray colors, located on a straight
line in the RGB colorimetric cube. This is why the
image has a slope close to 1, but a little more than
1 because of the other colors present in the image.
With the “correlation integral” measure, we observe a
stronger fractal signature over larger scales as a result
of the sophistication of the generated images.
3.2 Towards a Stronger Fractal
Signature
When the specular lights and the textures are suc-
cessively added, we observe in Fig. 3 that the three-
dimensional color histograms become more diffuse
and contain an increasing number of different col-
ors. Therefore, lights and textures used in the syn-
thetic images play an important part in the complex-
ity of the three-dimensional RGB color histograms.
We propose to enhance the realism of the synthetic
images by using advanced rendering techniques like
shadows, reflection, and bump mapping, as we real-
10
0
10
1
10
2
10
3
10
4
1 10 100
number of boxes N(r)
box size r
-1
Image A
10
-1
10
0
10
1
10
2
10
3
10
4
10
5
10
6
10
7
1 10 100
number of boxes N(r)
box size r
-2.5
Image D
10
6
10
7
10
8
10
9
10
10
10
11
1 10 100
avg. number of pairs C(r)
colorimetric distance r
0.8
Image A
10
8
10
9
10
10
10
11
1 10 100
avg. number of pairs C(r)
colorimetric distance r
1
Image D
10
0
10
1
10
2
10
3
10
4
10
5
1 10 100
avg. number of neighbors M(r)
colorimetric distance r
1.8
Image A
10
2
10
3
10
4
10
5
10
6
1 10 100
avg. number of neighbors M(r)
colorimetric distance r
1.2
Image D
Figure 6: Same as Fig. 3 for the color histograms of Fig. 5.
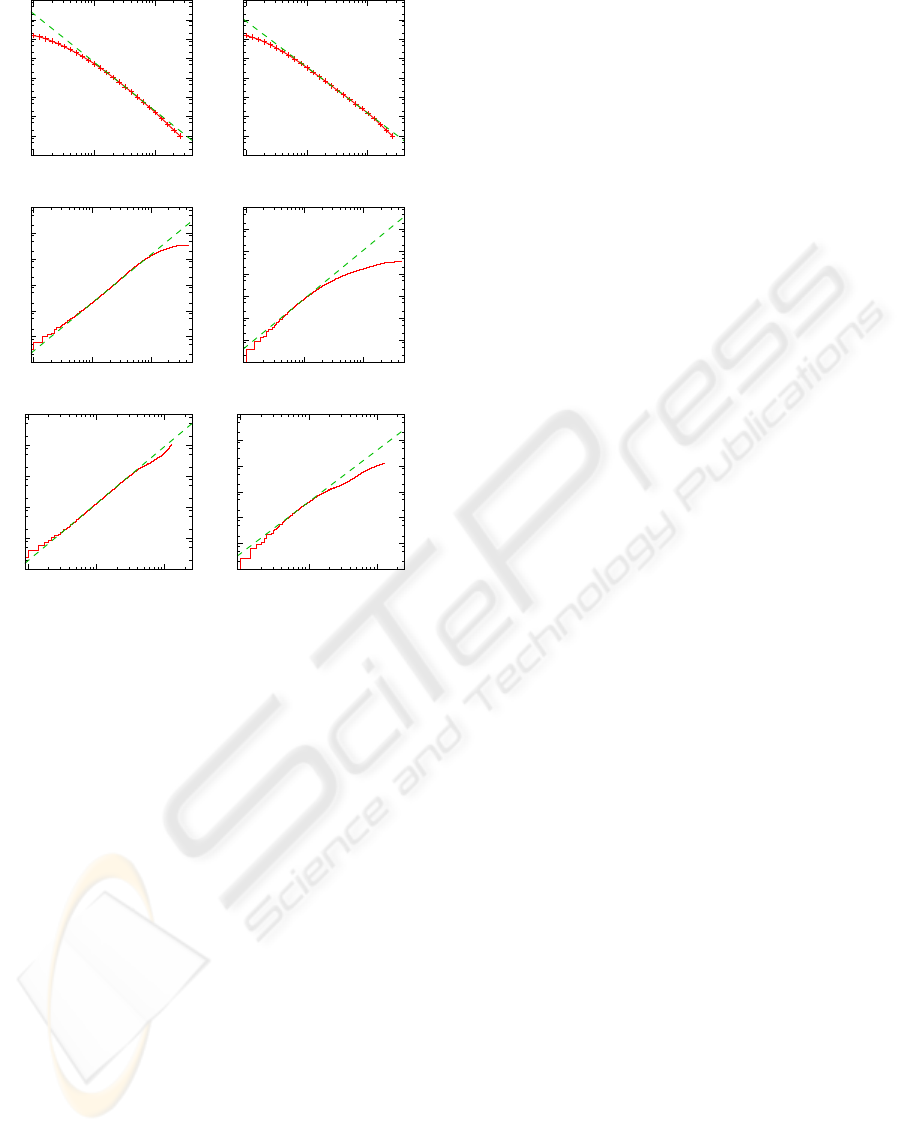
Bowls Cabin
Figure 7: Two RGB color highly sophisticated synthetic im-
ages with size 512 × 512 pixels and Q = 256 levels.
Figure 8: Three-dimensional color histogram in the RGB
colorimetric cube [0, 255]
3
for the images of Fig. 7.
FRACTAL ANALYSIS TOOLS FOR CHARACTERIZING THE COLORIMETRIC ORGANIZATION OF DIGITAL
IMAGES - Case Study using Natural and Synthetic Images
247
10
-1
10
0
10
1
10
2
10
3
10
4
10
5
10
6
10
7
1 10 100
number of boxes N(r)
box size r
-2.5
Bowls
10
-1
10
0
10
1
10
2
10
3
10
4
10
5
10
6
10
7
1 10 100
number of boxes N(r)
box size r
-2.4
Cabin
10
6
10
7
10
8
10
9
10
10
10
11
10
12
1 10 100
avg. number of pairs C(r)
colorimetric distance r
1.9
Bowls
10
6
10
7
10
8
10
9
10
10
10
11
10
12
10
13
1 10 100
avg. number of pairs C(r)
colorimetric distance r
2.2
Cabin
10
1
10
2
10
3
10
4
10
5
10
6
1 10 100
avg. number of neighbors M(r)
colorimetric distance r
1.8
Bowls
10
1
10
2
10
3
10
4
10
5
10
6
10
7
1 10 100
avg. number of neighbors M(r)
colorimetric distance r
2
Cabin
Figure 9: Same as Fig. 3 for the color histograms of Fig. 8.
ize in the images of Fig. 7. When using such tech-
niques, the three-dimensional color histograms gain
a stronger fractal signature, which are manifested in
Fig. 9 by the plots of N(r), C(r) and M(r) with lines
of non-integer slopes. Such fractal organizations are
close to those found in natural images (see Fig. 3).
4 CONCLUSIONS
Recent studies have demonstrated that natural images
could display fractal structure in their colorimetric or-
ganization. To further understand the possible origins
for this fractal behavior, we have analyzed the colori-
metric organization of synthetic images with the same
fractal tools used in (Chauveau et al., 2008; Chapeau-
Blondeau et al., 2009; Chauveau et al., 2009). From
a very poor synthetic image in the colorimetric do-
main we have applied standard rendering techniques
to increase the richness of the corresponding three-
dimensional color histograms. It appears that these
simple rendering techniques are able to increase the
complexity of the color histogram up to the point
where the three tested fractal tools demonstrate a frac-
tal signature more pronounced as the sophistication of
the rendering techniques increases. It is to be noted
that these results are obtained with a scene which is
very simple and presents no fractal properties in the
spatial domain.
ACKNOWLEDGEMENTS
Julien Chauveau acknowledges support from La
Communaut
´
e d’Agglom
´
eration du Choletais, France.
REFERENCES
Burton, G. J. and Moorhead, I. R. (1987). Color and spatial
structure in natural scenes. Applied Optics, 26:157–
170.
Chapeau-Blondeau, F., Chauveau, J., Rousseau, D., and
Richard, P. (2009). Fractal structure in the color distri-
bution of natural images. Chaos, Solitons & Fractals,
42:472–482.
Chauveau, J., Rousseau, D., and Chapeau-Blondeau, F.
(2008). Pair correlation integral for fractal charac-
terization of three-dimensional histograms from color
images. Lecture Notes in Computer Science, LNCS
5099:200–208. Berlin: Springer.
Chauveau, J., Rousseau, D., and Chapeau-Blondeau,
F. (2009). Fractal capacity dimension of three-
dimensional histogram from color images. Multidi-
mensional Systems and Signal Processing, (in press).
DOI 10.1007/s11045-009-0097-0.
Dong, D. W. and Atick, J. J. (1995). Statistics of natural
time-varying images. Network: Computation in Neu-
ral Systems, 6:345–358.
Gouyet, J.-F. (1996). Physics and Fractal Structures.
Berlin: Springer.
Hsiao, W. H. and Millane, R. P. (2005). Effects of occlu-
sion, edges, and scaling on the power spectra of natu-
ral images. Journal of the Optical Society of America
A, 22:1789–1797.
Mandelbrot, B. B. (1983). The Fractal Geometry of Nature.
San Francisco: Freeman.
Olshausen, B. A. and Field, D. J. (2000). Vision and the
coding of natural images. American Scientist, 88:238–
245.
Ruderman, D. L. and Bialek, W. (1994). Statistics of nat-
ural images: Scaling in the woods. Physical Review
Letters, 73:814–817.
Schroeder, M. (1991). Fractals, Chaos, Power Laws. New
York: Freeman.
VISAPP 2010 - International Conference on Computer Vision Theory and Applications
248
