
CIRCLE DETECTION USING THE IMAGE RAY TRANSFORM
A Novel Technique for using a Ray Analogy to Extract Circular Features
Alastair H. Cummings, Mark S. Nixon and John N. Carter
School of Electronics and Computer Science, University of Southampton, Southampton, U.K.
Keywords:
Feature extraction, Image processing analogy, Ray-tracing, Wave, Light ray, Transform, Circle detection.
Abstract:
Physical analogies are an exciting paradigm for creating techniques for image feature extraction. A transform
using an analogy to light rays has been developed for the detection of circular and tubular features. It uses a
2D ray tracing algorithm to follow rays through an image, interacting at a low level, to emphasise higher level
features. It has been empirically tested as a pre-processor to aid circle detection with the Hough Transform
and has been shown to provide a clear improvement over standard techniques. The transform was also used on
natural images and we show its ability to highlight circles even in complex scenes. We also show the flexibility
available to the technique through adjustment of parameters.
1 INTRODUCTION
Physical analogies are an exciting paradigm in com-
puter vision that enable the creation of novel tech-
niques that approach the problems of feature ex-
traction from entirely different angles (Nixon et al.,
2009). These analogy based techniques have the ad-
vantage of being based on physical properties of natu-
ral phenomena such as water, heat or force fields and
so are more easily understood by those using them.
In addition to the intuitive nature of the algorithms
the parameters that are used have meanings that are
clear and have real word analogues. Although anal-
ogy operators are heavily based upon a well defined
physical concept, the analogies can be adapted out-
side this definition to increase their effectiveness and
flexibility whilst maintaining the strengths provided
by the analogy. These properties are a clear advantage
over many standard techniques for which the mechan-
ics can be hard to grasp and parameter selection is not
clear.
Heat flow has been used a number of times due to
its smoothing properties. Anisotropic diffusion (Per-
ona and Malik, 1990) is an edge-aware smoothing
technique that allows heat to flow across areas of low
but not high edge strength, so preserving the impor-
tant edge features whilst reducing noise. Direkoglu
and Nixon developed two techniques using a heat flow
analogy for finding moving edges and image segmen-
tation. The first (Direkoglu and Nixon, 2006) used
anisotropic diffusion to smooth images and then heat
flow in the temporal dimension for extraction. The
second (Direkoglu and Nixon, 2007) used heat flow to
segment the image into non-contiguous sections and
then used geometric heat flow to smooth the bound-
aries. This segmentation technique produced encour-
aging results which capitalised on the use of analo-
gies.
Hurley’s force field transform (Hurley et al., 2005)
generates a force field from an image that is analogous
to a gravitational or magnetic field. Each pixel is as-
sumed to attract every other pixel with a force depen-
dent on its intensity and the inverse square law. The
sum of these forces generates a vector field represent-
ing an image. This force field can help in feature ex-
traction and was successfully utilized to create an ear
biometric. Xie et al. (Xie and Mirmehdi, 2008) also
used a force field analogy, generated from mageneto-
static theory and joined with an active contour model
to enable contour detection. In their model the image
border and evolving contour are assumed to have an
electric current running through them and the inter-
action of these currents generates a force field. This
field guides the development of the contour, changing
along with it to guide it to the image border.
This paper describes the creation of a novel trans-
form based on using an analogy to rays of light. The
rules of ray reflection and refraction are employed to
enhance tubular and circular features within an im-
age. The physical rules governing rays are described
in section 2.1 whilst section 2.2 introduces the image
ray transform. Section 3 documents empirical tests on
23
H. Cummings A., S. Nixon M. and N. Carter J. (2010).
CIRCLE DETECTION USING THE IMAGE RAY TRANSFORM - A Novel Technique for using a Ray Analogy to Extract Circular Features.
In Proceedings of the International Conference on Computer Vision Theory and Applications, pages 23-32
DOI: 10.5220/0002818900230032
Copyright
c
SciTePress
circle detection with the ray transform in a variety of
situations including examples of transformed natural
images and section 4 draws conclusions and discusses
the future direction of this research.
2 IMAGE RAY TRANSFORM
The image ray transform is a novel technique for ex-
tracting tubular and circular features that are not often
found by other techniques. It uses a pixel based ray
tracing technique and a subset of the laws of optics to
trace rays through an image which then react to cer-
tain structural features to emphasise them. Whilst the
transform is based on the principles of optics, the de-
tails of the technique can be adjusted to suit success-
ful feature extraction rather than accurate simulation
of the natural phenomenon. The implementation cap-
italises only on the basis of the analogy; we do not
simulate intricate details of light propagation.
2.1 Laws of Optics
Rays are a method of modelling the propagation of
waves, most often light, with specific regard for the
direction of the wave as it interacts with its environ-
ment. Light travels through a medium and the course
of the light will be altered when it crosses the bound-
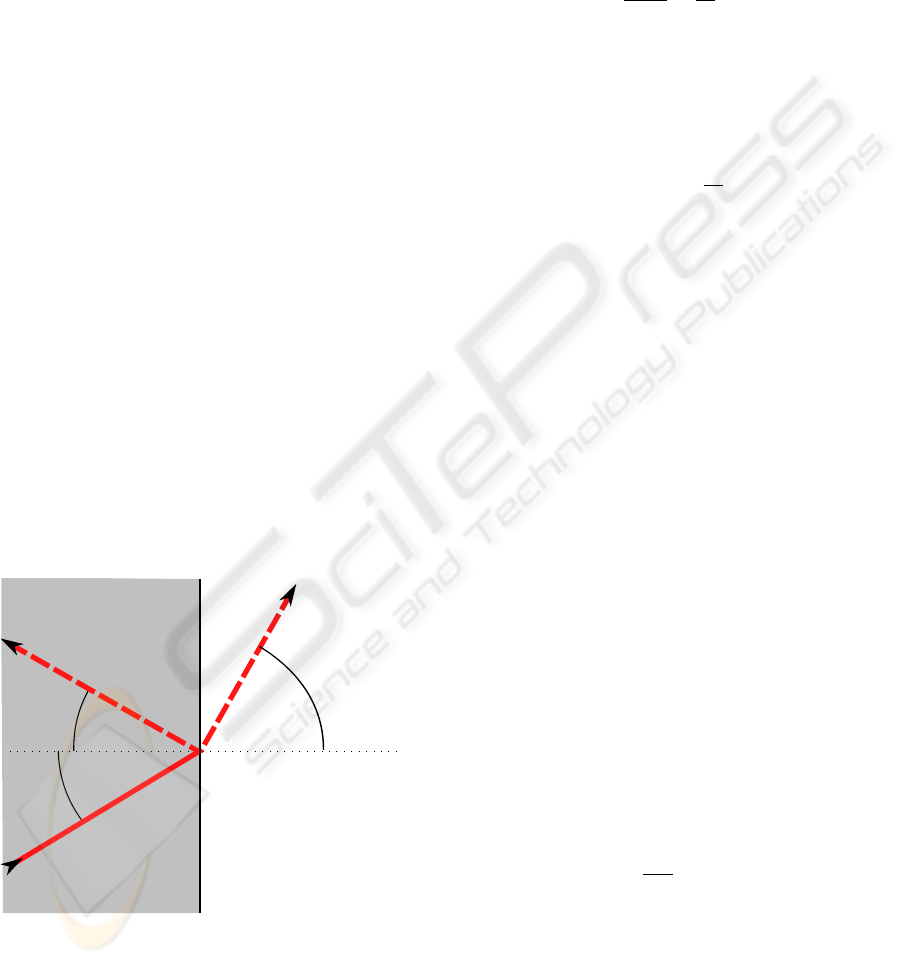
ary with a different medium. Figure 1 shows how the
light may react by reflecting, refracting, or splitting
and doing both. Light crosses the boundary between
m
1
m
2
θ
i
θ
l
θ
r
Reflected
Refracted
Normal
Figure 1: Refraction and reflection of light.
the media at an angle of θ
i
between the light direction
and the normal of the boundary (the dotted line). If
reflection occurs then the light reflects, with θ
l
= θ
i
.
If refraction occurs the light refracts at an angle of
θ
r
to the normal where θ
r
is calculated from the re-
fractive indices of n
1
and n
2
of the media m
1
and m
2
.
Refractive indices are the ratio of the speed of light in
a vacuum to the speed of light within the media, and
in nature 1 ≤ n / 4. The angle of the refracted light
θ
r
is found by Snell’s Law as
sinθ
i
sinθ
r
=
n
2
n
1
(1)
If n
1
< n
2
then light bends towards the normal, so
θ
r
< θ
i
. If n
1
> n
2
then light bends away from the nor-
mal as long as it is below the critical angle θ
c
. This is
the angle for which θ
r
would be greater than 90
◦
and
is therefore physically impossible and is calculated as
θ
c
= sin
−1
n
2
n
1
(2)
In this case the light is totally internally reflected in
an identical manner to normal reflection. In the natu-
ral world the amount of refraction and reflection that
occurs depends on the media and in most cases is a
combination of the two, some part passing through,
and some being reflected back. These rules form the
basis of the image ray transform.
2.2 Image Ray Transform Mechanics
The image ray transform takes the laws of optics de-
scribed previously and applies them to the problem of
feature extraction.
2.2.1 Image Transform
The image ray transform works by tracing a number
of rays through an image. The paths of these rays
are then used generate a new image with tubular and
circular features emphasised. The image is analogised
to that of a set of two dimensional glass blocks, each
representing a pixel whose refractive index is related
to the intensity of the pixel in the image. One method
to assign a refractive index to a pixel with intensity i
is shown by equation 3 where n
max
is a parameter that
defines the maximum possible refractive index. The
indices are then spaced evenly between 1 and n
max
.
n
i
= 1 +
i
255
· (n
max
− 1) (3)
The splitting of rays into reflected and refracted parts
is not considered.
In this matrix of blocks a ray is created with both
the random position (x and y) and the direction (φ)
drawn from a uniform distribution (U). For an image
of size w ×h.
x ∼ U[0, w), y ∼ U[0,h), φ ∼ U [0, 2π) (4)
VISAPP 2010 - International Conference on Computer Vision Theory and Applications
24
φ is converted into a unit vector, V representing the di-
rection of the ray, as this easier to use in calculations,
but cannot be generated from a uniform distribution.
V = (cos φ, sin φ)
T
(5)
The ray function r traces the course of the ray and
updates an accumulator A. I is the image, from which
refractive indices and the normals at each pixel are
derived. d is the maximum number of reflections or
refractions which the ray can undergo before tracing
ceases, also known as the depth.
A
0
= r(A, I, x, y, V, d, n
max
) (6)
The position vector p initialises the ray at
p
<0>
= (x, y)
T
(7)
and at iteration i,
p
<i+1>
= p
<i>
+ V (8)
At each pixel through which the ray passes A is up-
dated to show that the ray has passed through.
A
0
(p
<i+1>
) = A(p
<i+1>
) +1 (9)
A(p) is only increased once per ray, so as to pre-
vent small loops in the ray’s path repeatedly increas-
ing a single pixel and excessively emphasising noise
or other undesirable features. When crossing a pixel
boundary where the media on either side are of differ-
ing refractive indices, a new path must be calculated
using a vector formation of the laws described in sec-
tion 2.1.
If N is the normal and n
1
and n
2
are the refractive
indices of the first and second media then the angle of
incidence θ
i
can be found.
cosθ
i
= N · V (10)
If n
1
> n
2
we have to test whether we should inter-
nally reflect or refract. The critical angle θ
c
must be
found from equation 2 and if n
2
> n
1
or θ
i
< θ
c
and
assigning n =
n
1
n
2
then the direction of refraction R
r
is,
from (Hill, 2000),
R
r
= nV + (n(N · V) − cos θ
r
)N (11)
where cosθ
r
is
cosθ
r
=
q
1 −n
2
(1 −N · V) (12)
If n
1
> n
2
and θ
i
> θ
c
then the ray totally internally
reflects. The direction of reflection R
l
is then
R
l
= V − 2(N · V)N (13)
R
l
or R
r
are then assigned to V
V
0
=
(
R
l
if n
1
> n
2
∧ θ
i
> θ
c
R
r
otherwise
(14)
The ray is traced in this manner until it has either
undergone d reflections or refractions or the ray exits
the image. This is repeated for N rays and the accu-
mulator gives the transformed image.
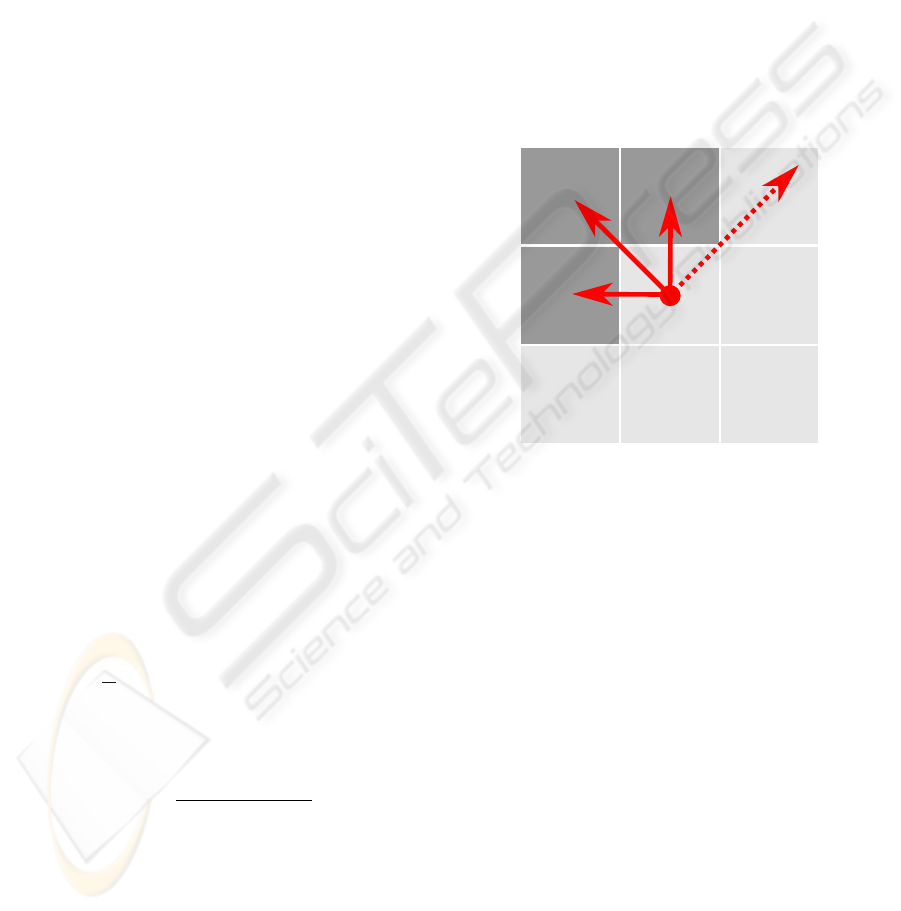
The values of the normals (N) that are used to cal-
culate the new directions of rays are always set to the
normal of the edge direction found by the Sobel op-
erator at that point. In figure 2 this normal is shown
orthogonal to that of the edge direction E, as well as
the normals of the pixel boundaries B
1
and B
2
. N is
used rather than B
1
or B
2
as it is more representative
of the information within the image. Currently we
only perform refraction when moving from higher to
lower refractive indices as this tends to improve the
quality of the transform result, and we are working to
improve this further.
N
E
B
1
B
0
Figure 2: The normals that could be used to calculate re-
flections and refractions.
Figure 3 shows the path of a ray as it travels
through a simple image. The edge direction at each
pixel is horizontal, and hence the normal at each point
is vertical. The ray is initialised at position A with a
random direction and advances to position B. The in-
tensity of the cells reflects their refractive index. At
B the refractive indices of the current and next pixel
are compared (n
1
and n
2
respectively), and as n
1
= n
2
the ray continues with no change in direction. At C,
n
1
< n
2
, and so the ray bends towards the normal,
whilst at D n
1
> n
2
and so the ray bends away from
normal. At E total internal reflection occurs, because
n
1
> n
2
and θ
i
> θ
c
. At F and G the occurrences at C
and D are repeated in reverse order whilst at H the ray
exits the image and the trace terminates.
2.2.2 Refinements
In addition to the basic transform, a number of ad-
ditional parameters and processes can be performed
with the transform to give a wider range of results
and to extend the range of circumstances in which the
transform is useful.
CIRCLE DETECTION USING THE IMAGE RAY TRANSFORM - A Novel Technique for using a Ray Analogy to
Extract Circular Features
25
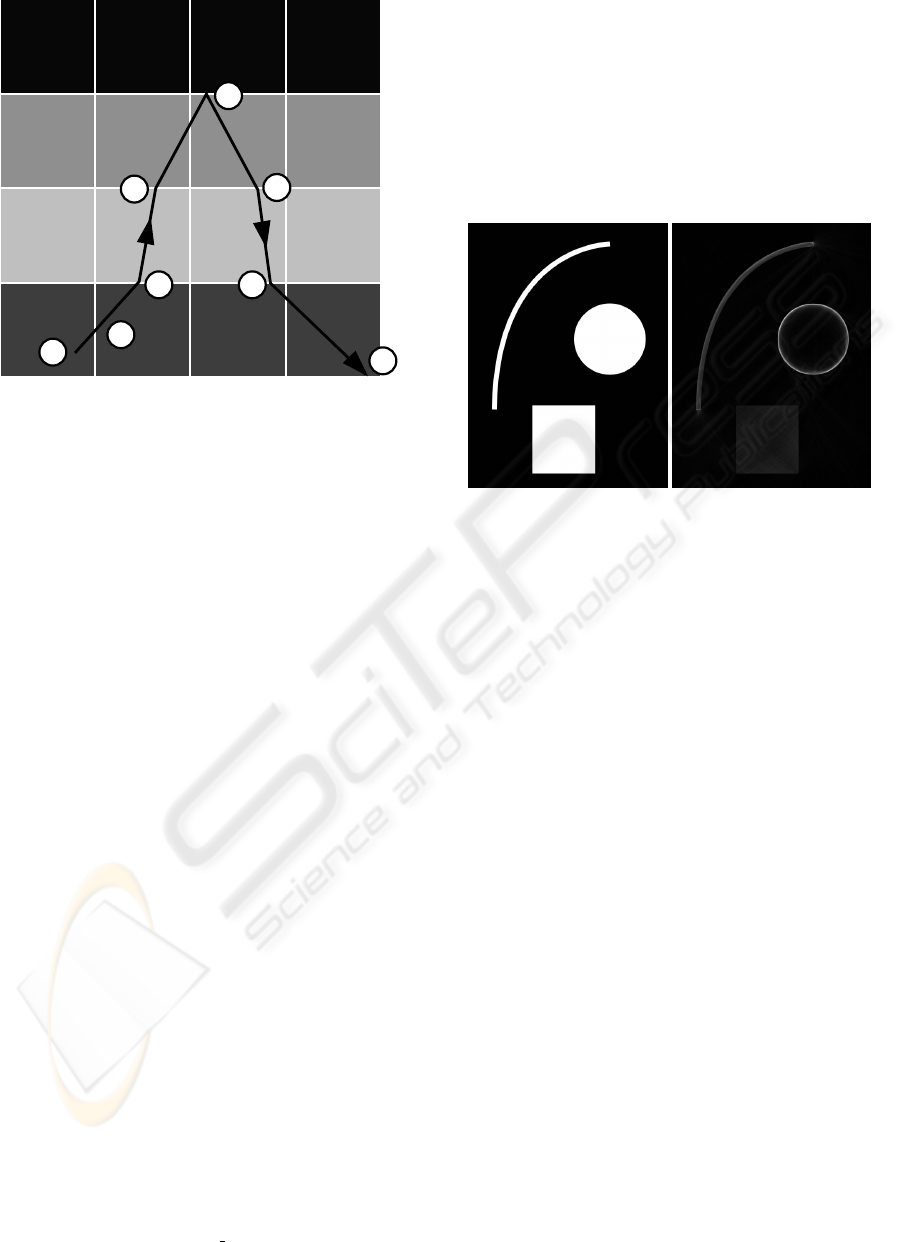
G
F
E
D
C
A
H
B
Figure 3: An example of the course a ray might take in a
simple 4x4 image.
The transform will only extract features that have
larger refractive indices than the surrounding area be-
cause total internal reflection only prevents rays from
passing from materials with higher to lower refractive
indices, and not vice versa. As the refractive index
is proportional to intensity, this has the effect of ex-
tracting features that are lighter than their surrounding
area. Depending on what is known about the proper-
ties of the features to be extracted different measures
can be taken to overcome this problem.
If the approximate intensity of the desired features
is known then the image can be easily transformed
to make that intensity (the target intensity) have the
highest value. This can be done by finding the differ-
ence from the target intensity t to the original intensity
i
o
for each pixel, as in equation 15.
i
t
= 255 − |i
o
−t| (15)
If the expected intensity is not known then the ray
transform can be performed multiple times, with dif-
ferent target intensities, and the highest value at each
pixel used. This is shown in equation 16 where I is
the final image and I
x
are the results of different trans-
forms with different target intensities.
I = max(I
0
, I
1
, . . . , I
x
) (16)
It may also be the case that the difference in in-
tensity between features and the surrounding area are
not significant enough to extract it with the linear re-
fractive indices calculated by equation 3. In such a
case an alternative version can be used (equation 17)
that assigns refractive indices exponentially, to ensure
greater difference, and more refraction and reflection.
n
i
= e
i
k
(17)
In this case it is k rather than n
max
that controls the
scale of the refractive indices.
2.3 Transform Properties
The results of the transform show its ability to extract
both tubular and circular features. In figure 4 some
of the strengths of the ray transform are displayed.
Whilst the box is weakly emphasised, both the curve
(a) Original (b) Ray Transform
Figure 4: Ray transform on a simple image. N = 20000.
d = 256 and n
max
= 3.
and the circle are shown with greater intensity. The
curve is extracted because it acts is if it were an op-
tical fibre or tube, guiding the rays along it as they
bounce of the walls because of total internal reflec-
tion. At either end of the curve a spread of rays can
be seen, where they have exited the end of the tube at
an angle at which total internal reflection cannot oc-
cur. The transform has treated the circle differently
however, and given it a strong edge. Figure 5 shows
how this occurs when rays repeatedly reflect off the
edges of the circle at angles shallow enough to ensure
that subsequent boundary collisions will also result in
reflection. Across a large number of rays this creates
a gradient around the edge of the circle.
An advantage of an analogy based operator is that
parameters are intuitive and easily set. The ray trans-
form has 3 main parameters, two of which affect
smoothness. N, the number of rays traced, affects
the smoothness of the resultant image, if it is too low
there are not enough rays traced to cover the whole
image, and if it is set too high will make the transform
too slow. The number of reflections or refractions
a ray is allowed to make before tracing is stopped,
d, must be set large enough to allow rays to interact
with important features, but must not be longer than
necessary as the transform will be slowed. The influ-
ence of these parameters on the speed of the transform
will be discussed below. The maximum refractive in-
dex, n
max
, and the target intensity, t, do not affect the
VISAPP 2010 - International Conference on Computer Vision Theory and Applications
26
(a) Original (b) N = 1 (c) N = 10 (d) N = 100 (e) N = 1000 (f) N = 10000
Figure 5: Accumulator throughout ray transform on simple circle. d = 128 and n
max
= 40.
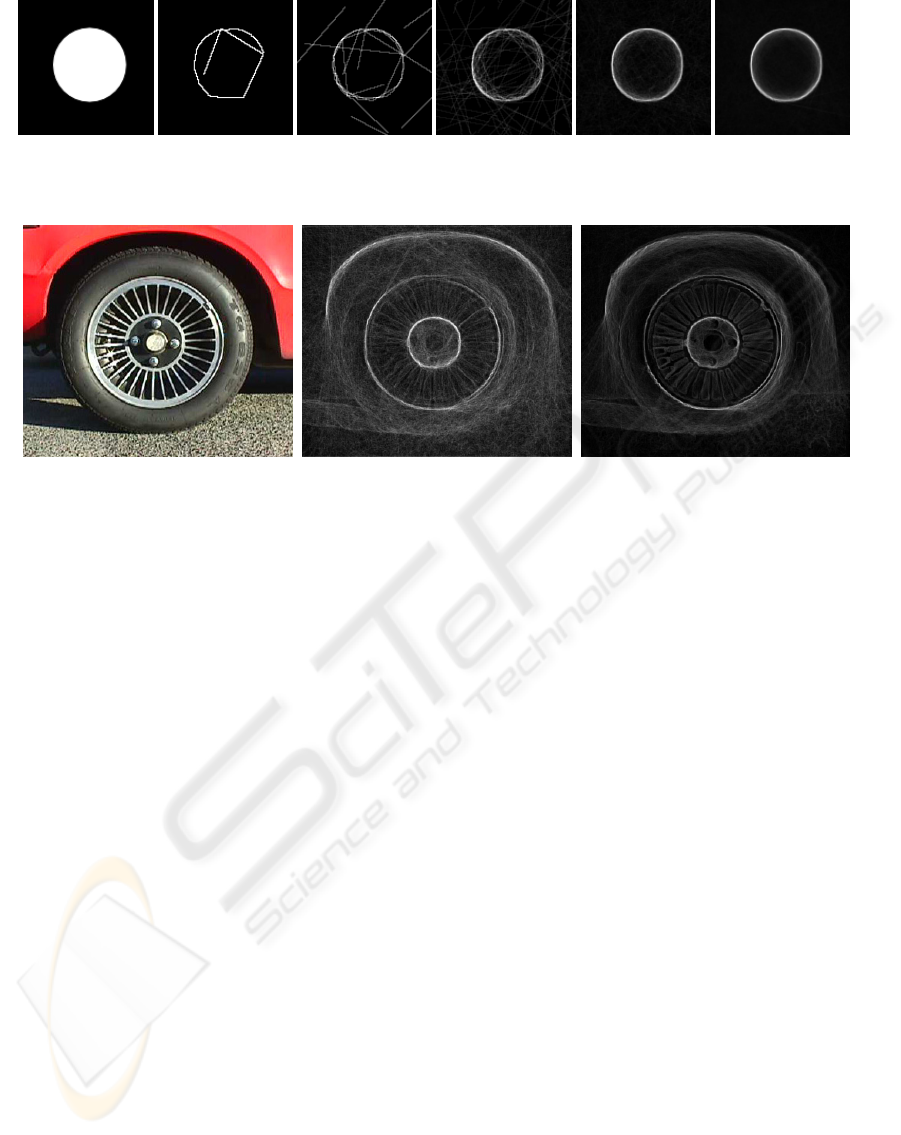
(a) Original (b) n
max
= 1.5 (c) n
max
= 40
Figure 6: Results of ray transform on variety of values of n
max
. d = 256, N = 10000 and t = 0.
speed of the transform but change the features that
are extracted. As detailed above, t allows a selected
intensity (or multiple intensities) to be focussed on
but n
max
has the greatest effect on the result. Figure 6
shows an image transformed with a range of refractive
indices. By using a small value for n
max
such as 1.5,
only the strongest features are shown (the arch and
tyre rims), whilst with larger, unnatural values many
weaker features become strong (such as the individual
tyre spokes).
Due to the non-deterministic nature of the trans-
form, the image produced will sometimes contain
noise. This can be dealt with either by increasing N
to reduce the effect of the random ray initialisation,
or by increasing the value of n
max
to ensure rays con-
form more strongly to the image or by using addi-
tional smoothing.
The transform was implemented in Python with
the bulk of the algorithm written as a C extension us-
ing F2PY (Peterson, 2009). Computation time de-
pends on the parameters more than image dimen-
sions, although image size drives their selection. For
a 512x512 image with N = 10000 and d = 256 com-
putation time was 1.53s. For comparison a 3x3 sobel
operation took 0.13s on the same machine. The speed
tests were done on a Core 2 Duo 2.53GHz, not using
any form of parallel processing. Whilst significantly
slower than Sobel, the time taken to compute the ray
transform is not excessive. Memory requirements are
not significant and the above test used approximately
50MB at peak usage. Setting N = 20000 increases
computation time to 2.93s whilst setting d = 512 in-
creases it to only 2.21s as not all rays will be traced to
the full depth. A Java applet demonstration is avail-
able online at http://users.ecs.soton.ac.uk/ahc08r/rt/
3 CIRCLE DETECTION
Due to the unique way that the transform reacts to
simple circles its effectiveness at aiding circle detec-
tion was investigated. The standard method of cir-
cle detection is the Hough transform (HT) for circles
and the ray transform was used as a pre-processor to
improve its performance. The HT was originally de-
signed for detecting lines (Hough, 1962) but can be
applied to detection of arbitrary shapes. The standard
version for circles operates on a binary edge image
and generates an accumulator of position and, if un-
known, circle radius. At each edge pixel in the im-
age a circle around it is voted for in the accumulator,
with the centre of the circle being the peak, and the
votes at the peak coming from the points on the cir-
cumference. The transform can be extended to deal
with an unknown radius by voting in a cone around
the point, with each level in a 3D Hough space rep-
resenting a differing radius. (Yuen et al., 1990) re-
view a number of simple Hough transform variations
and (Davies, 1984) describes the decomposed type
used. This version was used because of its signifi-
CIRCLE DETECTION USING THE IMAGE RAY TRANSFORM - A Novel Technique for using a Ray Analogy to
Extract Circular Features
27
cantly greater speed than the standard transform. It
has this property because the centre is discovered by
voting in lines that are normal to the edge direction of
the edge points in a 2D search space. Once the centre
has been found the most likely radius was found in
a fast 1D accumulator. Typically edge detection op-
erators such as thresholded Sobel or Canny are used
to create the binary edge image on which the Hough
transform is performed. The ray transform highlights
a circle in an image, but does not produce a single thin
strong edge, so it must be used as a pre-processor in
conjunction with a standard edge detection technique
to create stronger, more distinct edges. Whilst there
are more sophisticated and effective Hough Trans-
forms and edge detection techniques available, these
tests are designed to show that the ray transform can
improve results independently of other methods used.
3.1 Simple Circles
To test the usefulness of the image ray transform for
circle detection, a number of empirical tests were per-
formed. Images were created by adding a number of
circles onto a series of background images with com-
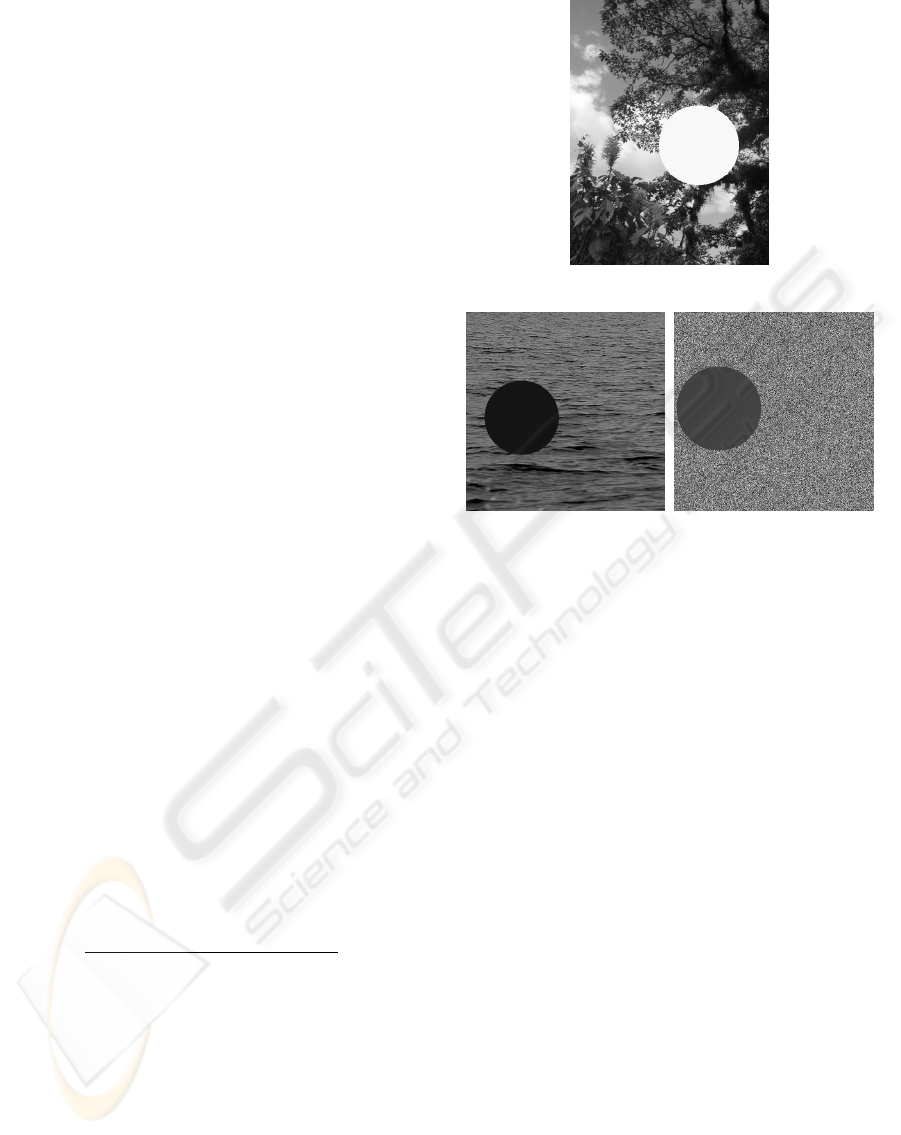
plex features (figure 7). Images of the type shown
in figure 7(c) had backgrounds randomly generated
wherein the intensity of each pixel was drawn in-
dividually from a uniform distribution with interval
[0, 255], whilst the other images had the same back-
ground for each test image. Every test image had a
different, randomly generated circle placed upon it,
and were then processed by the image ray transform.
The parameters used were N = 10000, n
max
= 40,
d = 256 and two passes were made with t = {0, 255}
and combined by equation 16 so as to detect both light
circles on backgrounds of both higher and lower in-
tensity.
Each of these images was then tested with the de-
composed Hough transform for circles and the dis-
tance from the actual position and radius was found
and used as the error.
E =
q
(x − x
0
)
2
+ (y − y
0
)
2
+ (r − r
0
)
2
(18)
Both the original images and the transformed versions
had the Sobel and Canny operators applied to them
and figure 8 shows the mean error across the Hough
transforms of all images. The error bars represent the
standard error of the distance between the prediction
and correct values for the circle parameters. It is clear
that the application of the ray transform to the images
improves the performance significantly.
Both the Canny and Sobel operators depend on
change in intensity to produce edges, and in the
thresholding process weak edges will often be re-
(a) Tree
(b) Sea (c) Noisy
Figure 7: Examples of images generated on different back-
grounds.
moved, and thus cannot contribute to the voting pro-
cess in the Hough transform. The ray transform high-
lights structure, and so small intensity differences can
be exaggerated to the point where they are far more
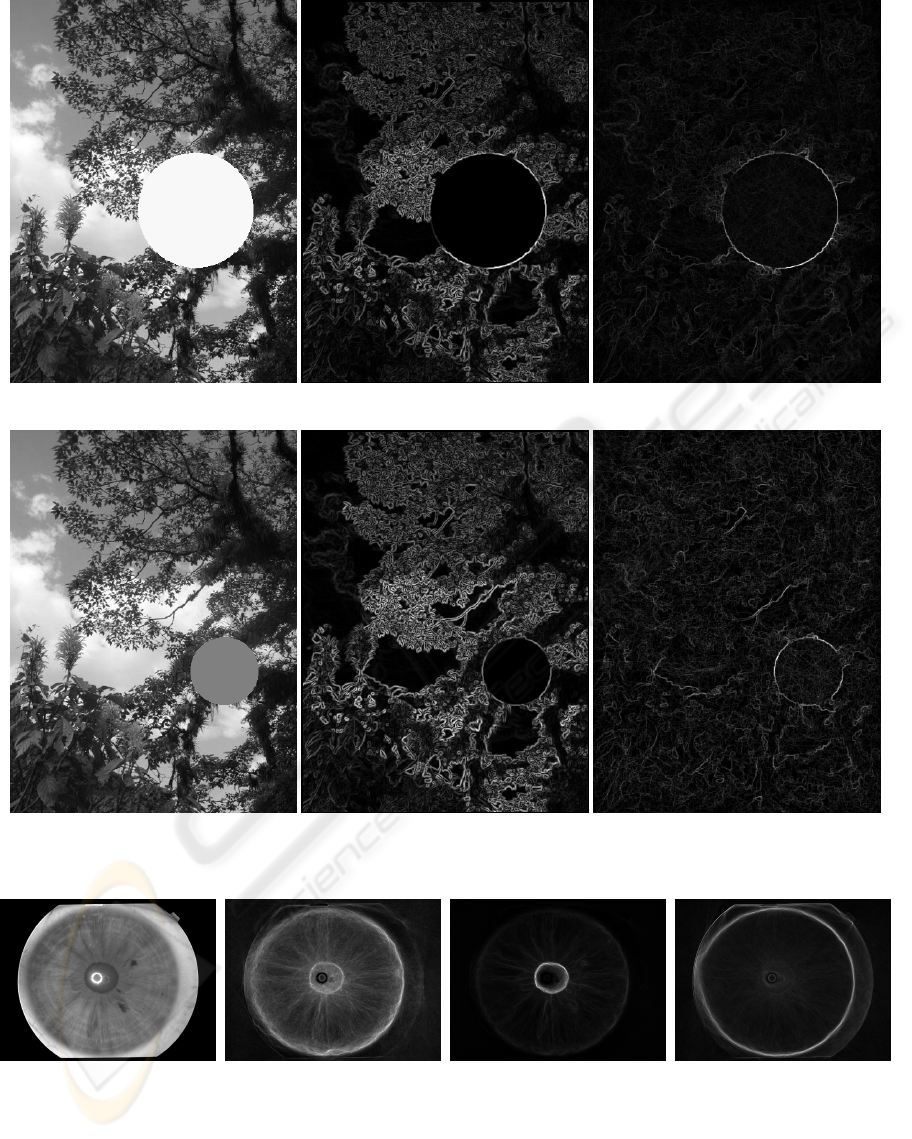
significant. Figure 9 shows an original and ray trans-
formed image having undergone the Sobel operator.
Whilst the application of the ray transform introduces
some noise within the circle, the edge around the cir-
cle is far stronger than any other edge in the image.
This contrasts with the Sobel operator alone where
the edges created by the background are of compara-
ble strength to the edge surrounding the circle.
In images set on a background of random noise,
use of the ray transform improves detection at all in-
tensities of circle, but has a more significant effect in
cases where there is very little difference in intensity
between circle and background (figure 10).
With the Canny operator and a noisy background,
both the ray transformed image and the original im-
age perform well on most circle intensities. The ray
transform is generally more accurate because it does
not need such a high level of smoothing to reduce the
strength of the background noise, and so the found
coordinates are not displaced by as great an amount.
The increase in error in the detection in both cases
coincides with the intensity of the circle being close
to the mean intensity of the background. The ray
VISAPP 2010 - International Conference on Computer Vision Theory and Applications
28
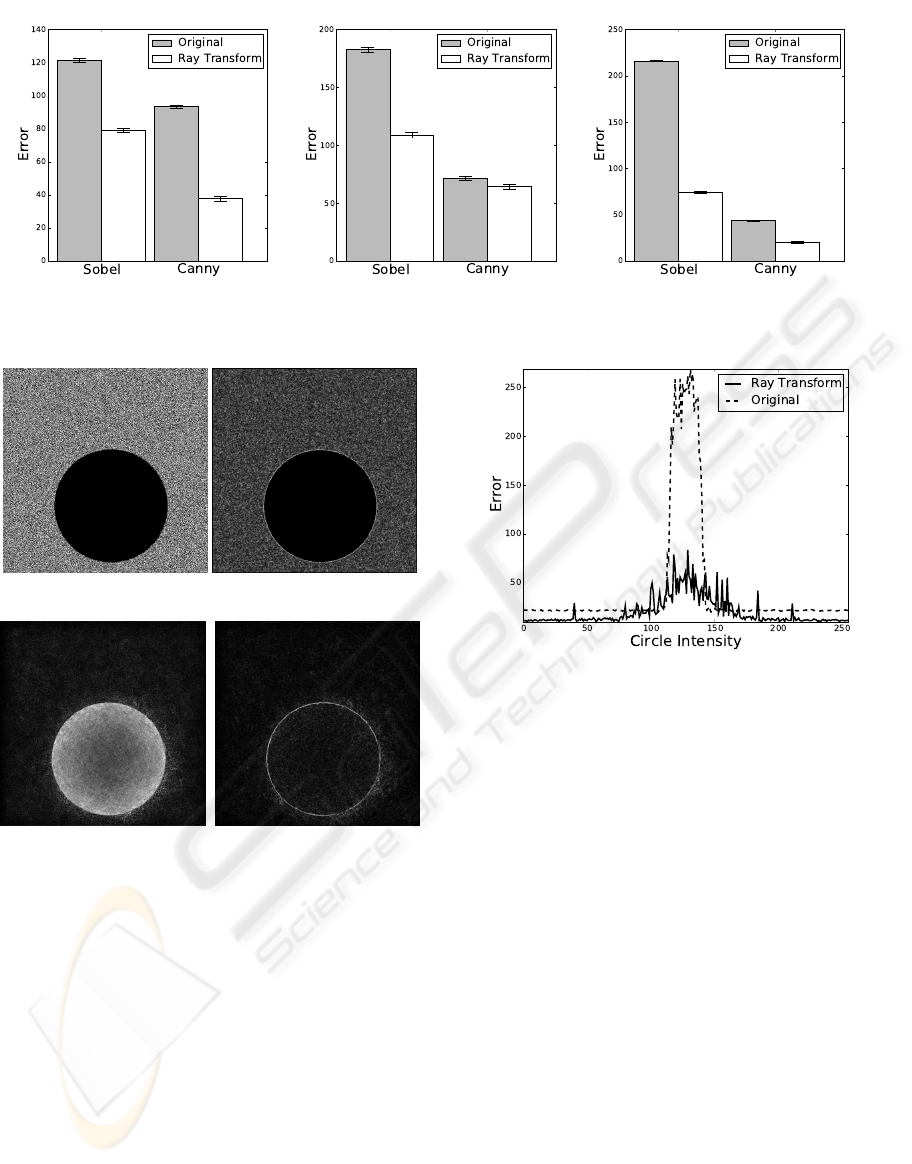
(a) Tree (b) Sea (c) Noisy
Figure 8: Mean error for circle detection on different background images.
(a) Original (b) Original-Sobel
(c) Ray Transform (d) Ray Transform-Sobel
Figure 9: The results of a single image after the application
range of techniques.
transformed images achieve significantly better re-
sults than the original images in these cases however,
as the results for the original images suggest that no
circle was found in any case, whilst in the ray trans-
form the correct circle was found in most cases.
The application of the ray transform to an edge
image is another method through which circle detec-
tion might be enhanced. As the ray transform is capa-
ble of extracting tubular features, converting an image
into a series of tubes through an edge detection opera-
tor is a possible approach to increasing the efficacy of
the transform. In figure 11 are the results of the appli-
cation of the ray transform to some of the generated
images where the refractive indices were found from
the Sobel edge magnitude. In figures 11(a) and 11(c)
Figure 10: Error across circle intensities for Canny HT tests
with a noisy background.
the circle of high intensity has edges that are extracted
clearly, but the circle of medium intensity in figures
11(d) and 11(f) is not emphasised as much due to the
reduced contrast with the surrounding image. These
results suggest that whilst use of the transform on an
edge image could be appropriate in some situations, it
is not for circle detection as it does nothing to empha-
sise edges of circles over the rest of the image as the
intensity ray transform does.
3.2 Natural Images
The transform was also tested on some real images.
Whilst we continue to search for a standard circle de-
tection database, some natural images of circles were
tested to see the results of the ray transform. In figure
12 the results of a number of transforms on an im-
age of an iris are shown. By varying the parameters
used, different circles that are present in the eye can
be highlighted. In figure 12(b) the two strongest cir-
cles, around the pupil and the iris are extracted whilst
figures 12(c) and 12(d) show each individual circle
being extracted far more strongly.
The transform was also tested on images of a bi-
CIRCLE DETECTION USING THE IMAGE RAY TRANSFORM - A Novel Technique for using a Ray Analogy to
Extract Circular Features
29
(a) High Intensity Circle (b) Sobel Edges (c) Ray Transform of Edges
(d) Medium Intensity circle (e) Sobel Edges (f) Ray Transform of Edges
Figure 11: The results of the ray transform on the Sobel edge images of some circles. N = 10000, n
max
= 40, d = 64.
(a) Original (b) t = 40 (c) t = 0, k = 50 (d) t = 128, n
max
= 2
Figure 12: Ray transform of an iris image, with differing parameters extracting different areas. Unless otherwise stated
parameters are N = 40000, d = 512, n
max
= 40 or not used.
VISAPP 2010 - International Conference on Computer Vision Theory and Applications
30
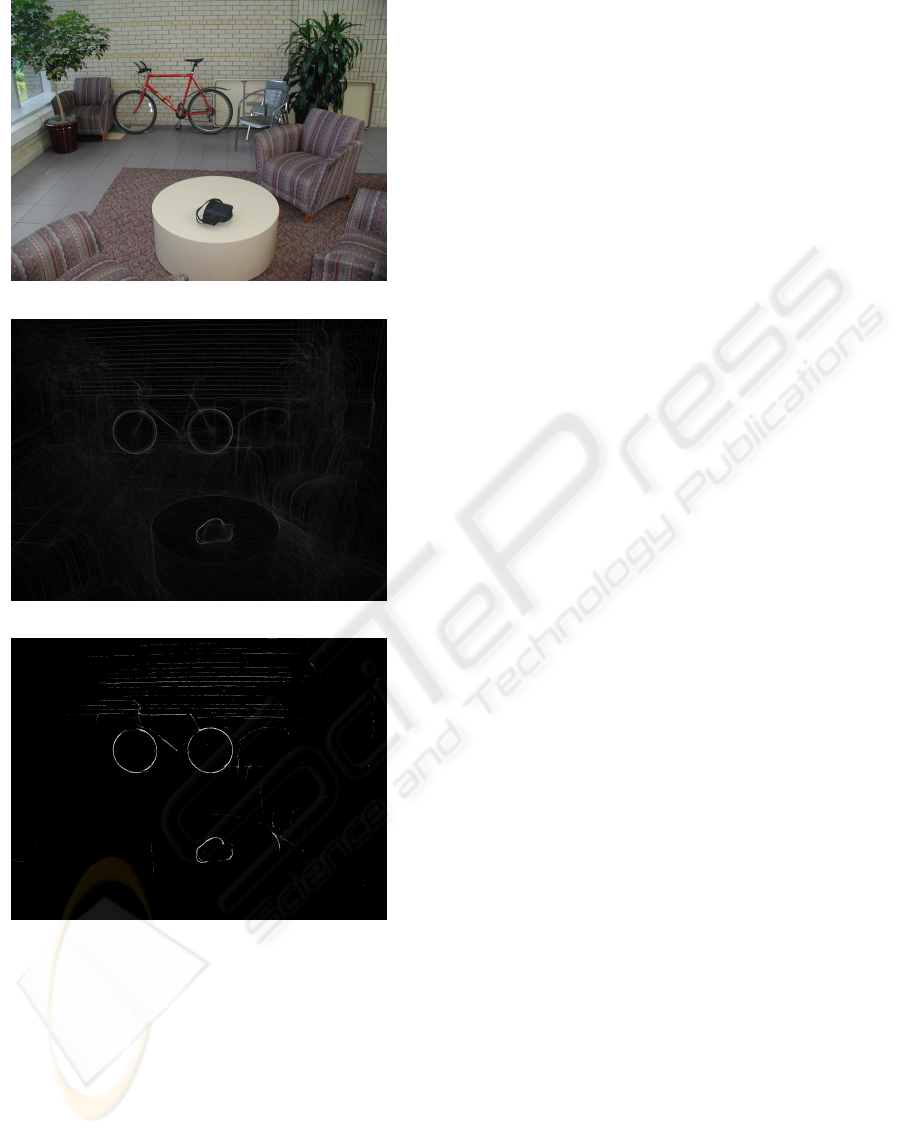
(a) Original
(b) Ray transform
(c) Thresholded
Figure 13: Ray transform of a bicycle from WORD. N =
20000, d = 256, n
max
= 4. Threshold parameter was 50.
cycle (figure 13) from the Wiry Object Recognition
Database (WORD) (Carmichael and Hebert, 2004).
The transform is able to highlight the circular wheels
very strongly, with many other background features
disappearing. Examining the thresholded version of
the image in figure 13(c) it is also clear that tubular
features such as the bag’s strap and horizontal mortar
in the wall act as tubular features and so are extracted
strongly.
4 CONCLUSIONS AND FURTHER
WORK
We have created a novel transform that is able to ex-
tract circular and tubular features from images. We
have shown that it can act as a pre-processor for circle
detection and significantly improve results with dif-
ferent techniques, even on hard cases where there is
little intensity difference between the circle and back-
ground. The transform has also been shown to work
with natural images, and it is flexible enough to ex-
tract individual or all circles within an image.
Whilst this work has focussed on the transform’s
ability to extract circles, it is also strong at emphasis-
ing tubular features and future work will concentrate
on some of these. Some examples of possible areas
are veins and rivers as well as some biometric appli-
cations such as ears and gait. The transform could
also be expanded into 3D, with either 3D images, or
video in a spatio-temporal format to track objects.
ACKNOWLEDGEMENTS
We gratefully acknowledge Alastair Cummings’ EP-
SRC CASE studentship funded by the National Phys-
ical Laboratory (NPL).
REFERENCES
Carmichael, O. and Hebert, M. (2004).
Word: Wiry object recognition database.
rope.ucdavis.edu/˜owenc/word.htm. Carnegie
Mellon University.
Davies, E. R. (1984). A modified Hough scheme for general
circle location. Pattern Recognition Letters, 7(1):37–
43.
Direkoglu, C. and Nixon, M. S. (2006). Low level moving-
feature extraction via heat flow analogy. Lecture Notes
in Computer Science, 4291:243–252.
Direkoglu, C. and Nixon, M. S. (2007). Shape extraction
via heat flow analogy. Lecture Notes in Computer Sci-
ence, 4678:553–564.
Hill, F. (2000). Computer graphics using OpenGL. Prentice
Hall, 3rd edition.
Hough, P. (1962). Method and means for recognizing com-
plex patterns. U.S. Patent 3.069.654.
Hurley, D. J., Nixon, M. S., and Carter, J. N. (2005). Force
field feature extraction for ear biometrics. Computer
Vision and Image Understanding, 98:491–512.
Nixon, M. S., Liu, X. U., Direkoglu, C., and Hurley, D. J.
(2009). On using physical analogies for feature and
shape extraction in computer vision. The Computer
Journal.
CIRCLE DETECTION USING THE IMAGE RAY TRANSFORM - A Novel Technique for using a Ray Analogy to
Extract Circular Features
31

Perona, P. and Malik, J. (1990). Scale-space and edge de-
tection using anisotropic diffusion. IEEE Transac-
tions on Pattern Analysis and Machine Intelligence,
12(7):629–639.
Peterson, P. (2009). F2PY: a tool for connecting fortran and
python programs. International Journal of Computa-
tional Science and Engineering, 4(4):296–305.
Xie, X. and Mirmehdi, M. (2008). MAC: Magnetostatic
active contour model. IEEE Transactions on Pattern
Analysis and Machine Intelligence, 30(4):632.
Yuen, H., Princen, J., Illingworth, J., and Kittler, J. (1990).
Comparative study of Hough transform methods for
circle finding. Image and Vision Computing, 8(1):71–
77.
VISAPP 2010 - International Conference on Computer Vision Theory and Applications
32
