
TIME-WEIGHTED EVALUATION OF IMAGE SEGMENTATION
WITH A GENETIC ALGORITHM
Hassan Almuhairi, Martin Fleury and Adrian F. Clark
University of Essex, U.K.
Keywords:
Image segmentation, Genetic algorithm, Quantitative evaluation.
Abstract:
The performance of a segmentation algorithm can be evaluated by systematic comparison with hand-
segmented ground-truth images. When evaluation extends over an algorithm’s parameter space, then the search
for satisfactory settings has a considerable cost in time. This paper considers applying a genetic algorithm
(GA) to avoid an exhaustive search. To further reduce evaluation time and subsequent image batch-processing
times, this paper introduces a time factor into the GA cost function. This procedure while preserving the GA
solution, selection of parameters to minimize the fit to hand-segmented images, also improves interpretation
and parameter selection.
1 INTRODUCTION
Contrasting image segmentation to recognition tasks
such as the use of handwriting, and face databases, the
authors of (Martin et al., 2001) remark “Typically [in
segmentation] researchers will show their results on a
few images and point out why the results ‘look good”.
Part of the problem may be the logistics of quantita-
tive evaluation in performing a large number of eval-
uations, as an exhaustive search with multiple param-
eter settings is an onerous task and may require use of
a cluster computer. Alternatively, we have used a ge-
netic algorithm (GA) (Goldberg, 1989) search mod-
ule in our evaluation environment to decrease the pro-
cessing time for the search as a whole.
The GA acts to optimize the selection of parame-
ters. The contribution of this paper is adding the time
taken to complete the segmentation for each parame-
ter set as a factor in the GA cost function. The ratio-
nale behind this addition is that the quality of the seg-
mentation results is not the only value one would like
to improve, as there is also a need to balance the qual-
ity with the segmentation processing time. Adding
this time factor gave some insight into the significance
of some of the algorithm parameters not only in re-
spect to the processing time performance but also to
the quality of the segmentation performance. For in-
stance, while experimenting without using the time
factor, the GA module will randomly vary certain pa-
rameters that actually do not affect the overall quality
of the segmentation, once optimization of the signifi-
cant parameters for the algorithm has taken place.
2 ADDING TIME AS A FACTOR
The mean-shift algorithm (Comaniciu and Meer,
2002) makes a convenient example, especially as
the authors have made EDISON code available at
http://www.caip.rutgers.edu/riul/research/robust.html,
for which we are grateful. The Berkeley database
(Martin et al., 2001) encourages users to download
benchmarking code as well as 200 training images
and a further 100 test images of size 240 × 160
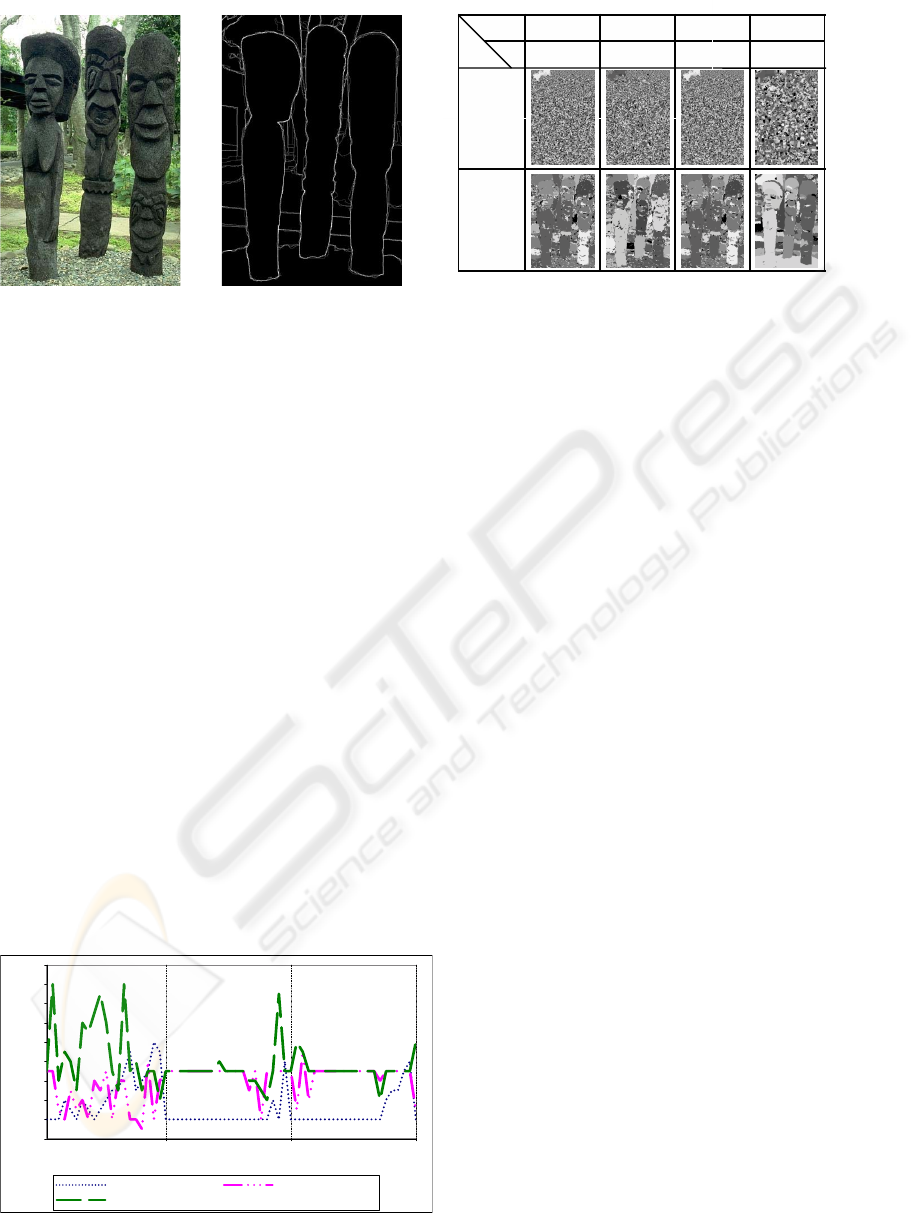
pixels. Fig 1a is a test image from the Berkeley
database, Fig 1b is an example hand-segmentation
also included in the database. Fig. 1c shows the
result of varying the mean-shift parameters. Higher
values of radiusR results in less regions, while
higher values of radiusS effectively results in more
computation but smoother region boundaries.
Adding processing time to the cost function can
take place in various ways such as through an additive
or multiplicative factor. Using a multiplicative fac-
tor provides a trade-off between segmentation evalua-
tion and computational time, and, therefore, after ini-
tial investigations, the cost function was modified in
this way. It was decided that including a time factor
as an exponential weighting gave too much emphasis
to achieving low processing times. The time that the
GA itself took for processing was not included, as this
time was negligible and certainly less than 5% of any
153
Almuhairi H., Fleury M. and F. Clark A. (2010).
TIME-WEIGHTED EVALUATION OF IMAGE SEGMENTATION WITH A GENETIC ALGORITHM.
In Proceedings of the International Conference on Computer Vision Theory and Applications, pages 153-156
DOI: 10.5220/0002822101530156
Copyright
c
SciTePress
a b
radiusR
radiusS
Colour
Distance
1
10
1
1
10
10
1
1 10
10
c
Figure 1: (a) Example image (Easter island statues) from the Berkeley segmentation database (b) human hand-segmentation
(c) variation of segmentations with parameter settings.
segmentation processing time.
For these experiments, the population size was set
to 20 and the first 20 generations were run. The re-
combination rate was fixed at 0.6 and the mutation
rate at 0.2. By observation, the GA module reaches
an acceptable stable solution in much fewer genera-
tions when a comparatively large population size is
employed. To see the start of the stabilization trend
in the parameter search with the time factor, Fig. 2
shows the first three generations. The members of the
population are plotted across the horizontal axis and
the parameter values for a population member can be
read off in the vertical direction. At the crossover
point between the generations, the fittest parameter
set is shown. It is clear from the parameter variation
in the second and the third generations that the se-
lection is already stabilizing. For example RadiusS
tends to stabilize at value 2 and RadiusR at value 5.
Therefore, employing a time factor arrives at similar
results for the example image but may well increase
the convergence speed as the values of less significant
parameters are explored less.
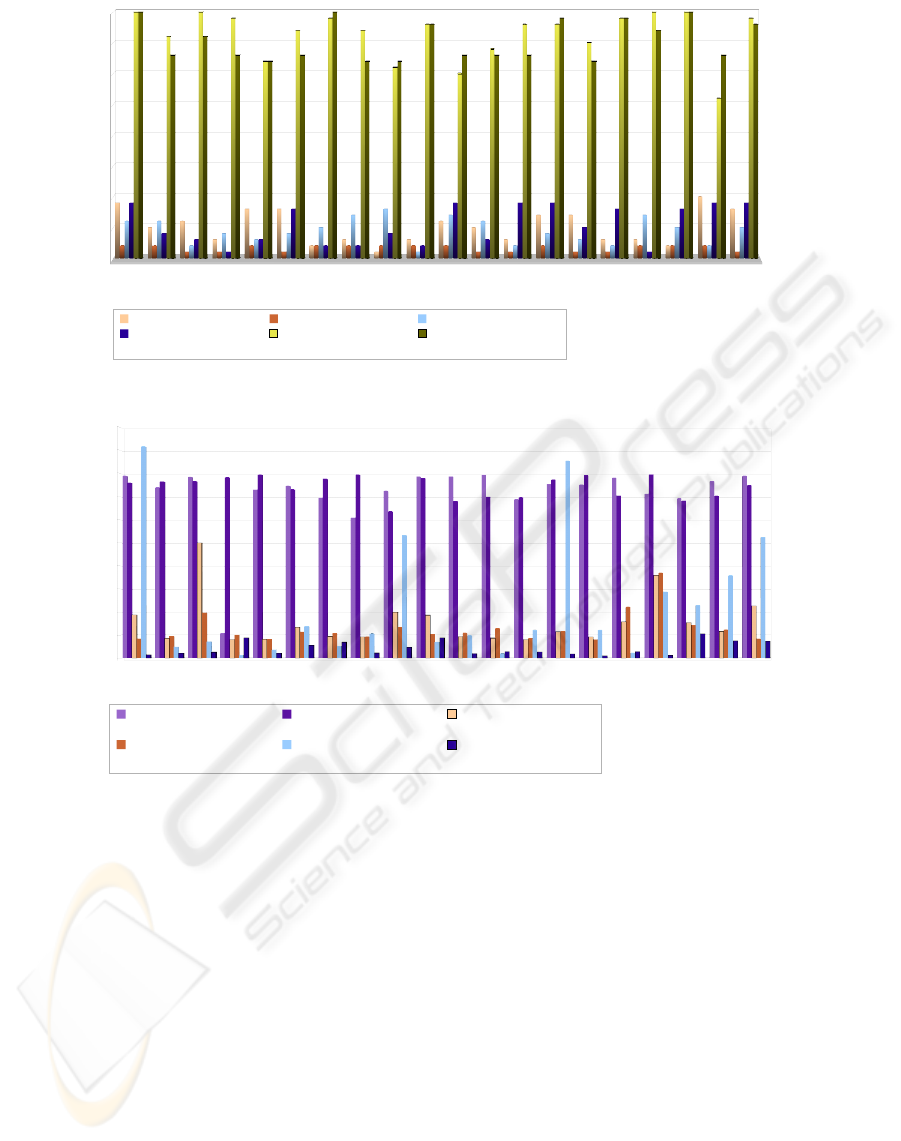
Fig. 3 shows the application of the GA with and
without a time factor in the cost function. The hor-
1.0 2.0 3.0
Generation Number
0
2
4
6
8
10
12
14
16
18
Parameter Value
RadiusS RadiusR
ColourDistance
Figure 2: The first three generations of the meanshift GA
evaluation.
izontal axis is annotated with the image numbers of
20 images from the Berkeley database. Consider the
effect of the time factor on the value of the radiusS
parameter: when the time factor is present, the value
of this parameter is always equal or less than two.
While without the presence of the time factor the
same parameter value does not have a specific trend,
and changes between different images in the test. The
best explanation for this is that this parameter does
not have a great significance for the quality of the seg-
mentation. However, higher values of this parameter
are computationally expensive. There is no similar
trend for the radiusS parameter, and the time fac-
tor also does have any noticeable effect on the third
colorDistance parameter.
Experiments with the Watershed algorithm (Vin-
cent and Soille, 1991) also gave rise to a variety of
results, depending on choice of parameters. Fig. 4 il-
lustrates the optimal results found by the evaluation
with and without the time factor. The main parame-
ters used were firstly a watershed threshold parameter
for the core watershed algorithm. This parameter is
varied between 1 and 80. In our tests, a k-mean color
quantization stage was also added as a pre-processing
stage. The number k here refers to the number of col-
ors that the image will be reduced to. The final param-
eter considered was the maximal number of iterations
parameter for the k-mean algorithm. This is a parame-
ter that controls how many iterations are carried out to
search a pixel’s neighbors for color similarity as part
of the quantization process.
The first point to observe is that the threshold ar-
rived at after application of the GA is always very
high, higher than 60, and there is no difference in this
between using the time factor or not using it. The rea-
son for this is that higher thresholds tend to eliminate
smaller details and segments that are not noticed by
the human hand-segmenter and as such the evaluation
VISAPP 2010 - International Conference on Computer Vision Theory and Applications
154
101085
12003
134008
135037
138032
138078
144067
163014
188005
231015
247085
28075
28096
35058
35070
353013
368078
76002
94079
97017
0
5
10
15
20
25
30
35
40
radiusS without time factor radiusS with time factor radiusR without time factor
radiusR with time factor colorDistance without time
factor
colorDistance with time
factor
Parameter value
Image
Number
Figure 3: Meanshift segmentation evaluation for 20 images with and without a time factor.
101085
12003
134008
135037
138032
138078
144067
163014
188005
231015
247085
28075
28096
35058
35070
353013
368078
76002
94079
97017
0
10
20
30
40
50
60
70
80
90
100
Threshold without time
factor
Threshold with time factor numberOfColors without
time factor
numberOfColors with time
factor
maximalNumberOfItera-
tions without time factor
maximalNumberOfItera-
tions with time factor
Parameter value
Image
Number
Figure 4: Watershed segmentation evaluation of 20 images with and without time factor showing parameters.
tends to prefer higher values for the threshold param-
eter. Another point to observe is that the evaluation
tries to optimize the parameter set with lower values
for the color quantization parameter, which means a
more smoothing of the input images. Noting that the
maximum value for k is 256, then 50 is a relatively
low number and results in high quantization for natu-
ral images full of colors. However, there is no specific
parameter value that is general for all the images. This
can be attributed to the fact each image will have spe-
cific original color palettes and also that not all objects
respond in the same way to color quantization.
The final observation is that the timing factor sin-
gles out the iteration parameter for ‘extra’ optimiza-
tion. The time factor keeps this parameter’s value as
low as possible, not more than ten iteration for all
the images. Evaluation without the time factor, gives
no clear preference for high or low iteration values,
which make one conclude that this parameter does
not have much importance for segmentation accuracy.
Evaluation without the time factor gave no preference
for a parameter set with low computation time and as
such did not consider low iteration values as an impor-
tant target for optimization. Each image took about 20
minutes to evaluate when a time factor was not used
and the evaluation time reduced to approximately half
this value when this factor was included. Evaluation
time was consistent with or without the time factor’s
inclusion.
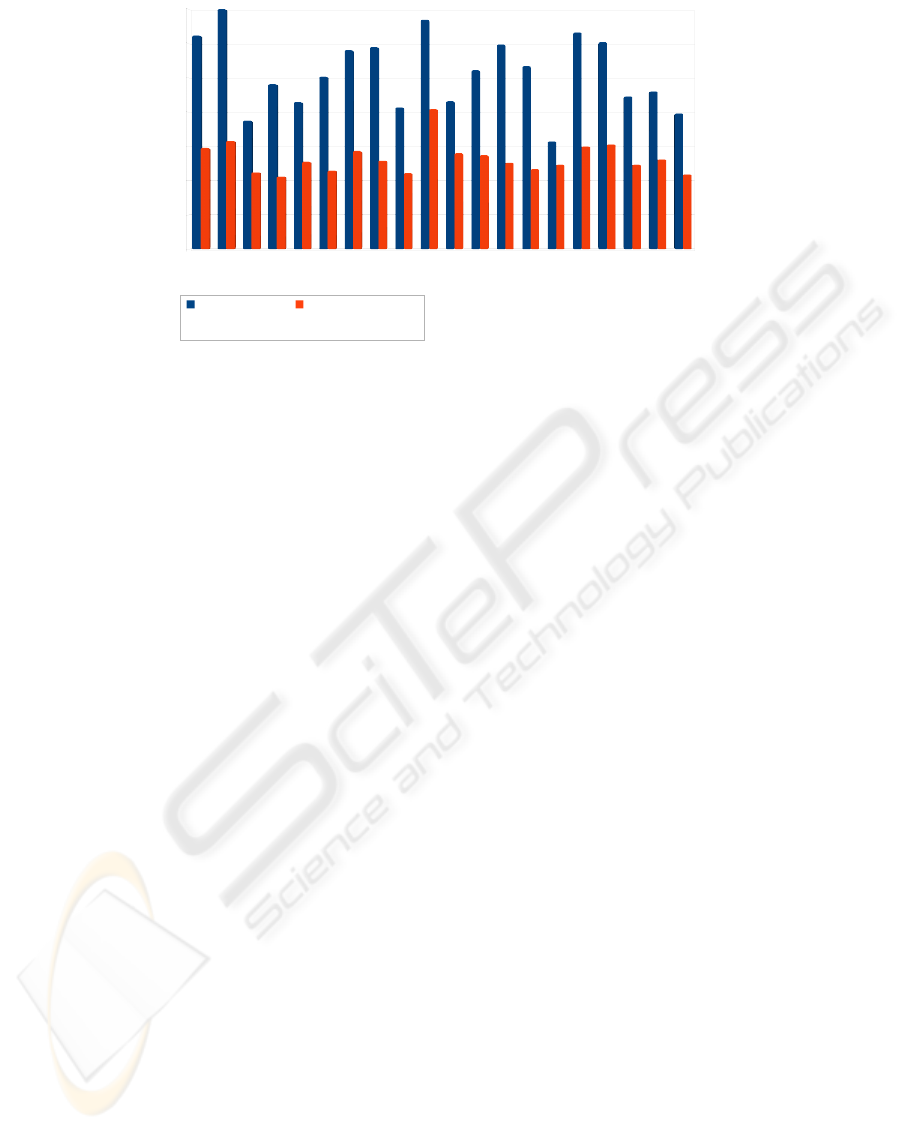
The k-means algorithm, employed as an initial
smoothing/color quantization process in the Water-
shed algorithm, can also be augmented by another
smoothing stage that uses a k-nearest-neighbor algo-
rithm to smooth out the image further. Again, the time
factor was included in GA optimization. It was found
that the threshold delta parameter had little effect on
TIME-WEIGHTED EVALUATION OF IMAGE SEGMENTATION WITH A GENETIC ALGORITHM
155
101085
12003
134008
135037
138032
138078
144067
163014
188005
231015
247085
28075
28096
35058
35070
353013
368078
76002
94079
97017
0
2
4
6
8
10
12
14
Total Elapsed time
without time factor
(min)
Total Elapsed time with
time factor (min)
Time Elapsed in minutes
Image
Number
Figure 5: K-means segmentation evaluation timings of 20 images with and without time factor optimization.
the results. This parameter stops the processing it-
erations if the palette changes between the iteration
is less than this value and in the implementation it
was set to a range between 0.1 and 1.0. Again other
parameters apart from the number of iterations were
unaffected by the inclusion of the time factor. How-
ever, the evaluation time now decreased dramatically,
as Fig. 5 illustrates.
3 CONCLUSIONS
Pixel-wise comparison between a segmented image
and its ground-truth, herein using hand-segmented
images, is dependent on choice of an algorithm’s pa-
rameters. To arrive at a best-fit parameter configura-
tion, in the face of a diversity of parameter-dependent
results is a time-consuming task, yet seems necessary
if quantitative evaluation is to become a standard pro-
cedure. Apart from the speed up over an exhaustive
search, using a GA has highlighted the importance of
parameter settings and the criticality of a particular
parameter over another. The addition of a time factor
into the GA cost function, does not just select for pa-
rameter settings that improve the throughput but also
rationalizes the selection so that relatively unimpor-
tant parameters are not explored in too great detail.
ACKNOWLEDGEMENTS
The authors thank Khalifa University of Sci-
ence, Technology and Research (KUSTAR) and the
Emirates Telecommunication Corporation (Etisalat),
UAE for financial support for this work.
REFERENCES
Comaniciu, D. and Meer, P. (2002). Mean shift: A robust
approach toward feature space analysis. IEEE Trans.
Pattern Anal. Mach. Intell., 24(5):603–619.
Goldberg, D. E. (1989). Genetic Algorithms in Search, Op-
timization, and Machine Learning. Addison-Wesley.
Martin, D., Fowles, C., Tal, D., and Malik, J. (2001). A
database of human segmented natural images and its
application to evaluating segmentation algorithms and
measuring ecological statistics. In Int. Conf. on Com-
puter Vision, pages 416–423.
Vincent, L. and Soille, P. (1991). Watersheds in digital
spaces: An efficient algorithm based in immersion
simulations. IEEE Trans. Pattern Anal. Mach. Intell.,
13(6):583–598.
VISAPP 2010 - International Conference on Computer Vision Theory and Applications
156
