
VISUAL PITCH CLASS PROFILE
A Video-based Method for Real-time Guitar Chord Identification
M. Cicconet, P. Carvalho, L. Velho and M. Gattass
Vision and Graphics Laboratory at IMPA and Computer Science Department at PUC-Rio, Brazil
Keywords:
Guitar Chord Identification, Chord Detection, Pitch Class Profile, Chroma Vector.
Abstract:
We propose a video-based method for real-time guitar chord identification which is analogous to the state-of-
the-art audio-based method. While the method based on audio data uses the Pitch Class Profile feature and
supervised Machine Learning techniques to “teach” the machine about the chord “shape”, we use as feature
the approximated positions of fingertips in the guitar fretboard (what we call Visual Pitch Class Profile),
captured using especial hardware. We show that visual- and audio-based methods have similar classification
performance, but the former outperforms the latter with respect to the immunity to noise caused by strumming.
1 INTRODUCTION
Despite being a predominantly auditory activity, mu-
sic has also a visual component which is worth noting.
In the case of guitar playing, for instance, it is com-
mon to identify chords by visual inspection instead of
by auditive perception.
Most studies in Musician-Computer Interaction,
however, have been done by the Computer Music
community, and there are still few Computer Vision
approaches.
In this work we propose a new method for real-
time guitar chords identification using only Computer
Vision techniques. The method is analogous to the
state-of-the-art audio-based method, which uses a su-
pervised Machine Learning technique to train the ma-
chine with the patterns of different chords, using as
training feature the Pitch Class Profile. We kept the
Machine Learning part and replaced the auditory fea-
ture by a visual one, namely the approximate posi-
tions of fingertips at the guitar fingerboard.
2 PREVIOUS WORK
In (Burns and Wanderley, 2006) a camera is mounted
on the guitar headstock in order to capture the first
five frets. The Linear Hough Transform is used to de-
tect strings and frets, and the Circular Hough Trans-
form is used to locate the fingertips. The purpose is
to identify chords and notes sequences in real-time by
detecting the fingertips positions in guitar fretboard
coordinates.
The work of (Kerdvibulvech and Saito, 2007) is
more ambitious. They use stereo cameras and aug-
mented reality fiducial markers to locate the guitar fin-
gerboard in 3D, and colored markers (with different
colors) attached to the fingertips to determinate their
three-dimensional position relative to the fretboard.
The two mentioned works use only visual infor-
mation. In (Quested et al., 2008), visual information
is used to enhance the performance of an audio-based
musical information retrieval method. The point is
that once the fundamental frequency of the played
note is known (via audio), the video information helps
solving the ambiguity regarding which string was ac-
tually fingered or plucked. The same idea is used in
(Paleari et al., 2008), but their system is not designed
to work in real-time.
3 THE AUDIO-BASED METHOD
According to (Cabral, 2008), most of the audio-based
chord recognition methods rely on the use of the Pitch
Class Profile (PCP) audio feature along with some su-
pervised Machine Learning method. We now define
the PCP, also known as the Chroma Vector, as de-
487
Cicconet M., Carvalho P., Velho L. and Gattass M. (2010).
VISUAL PITCH CLASS PROFILE - A Video-based Method for Real-time Guitar Chord Identification.
In Proceedings of the International Conference on Computer Vision Theory and Applications, pages 487-490
DOI: 10.5220/0002824904870490
Copyright
c
SciTePress

Figure 1: Capture hardware. On the left, an infrared camera surrounded by four infrared light sources. In the center, a hollow
disk made with reflexive material. Four of them are used to locate the plane containing the ROI. On the right, middle-phalanges
gloves with small rods coated so as to easily reflect light.
scribed by (Jehan, 2005).
At regular intervals of the audio file an audio
chunk is taken, multiplied by a Hann-window, and the
magnitudes of the Discrete Fourier Transform coef-
ficients are computed. Then the 84 amplitudes cor-
responding to MIDI notes ranging from 24 to 107
are captured and a 12-dimensional vector is obtained
by summing the amplitudes corresponding to musical
notes of the same key in different octaves. The ele-
ments of this vector are normalized to the range [0, 1]
to avoid taking into account differences of loudness in
different windows.
In the seminal work of (Fujishima, 1999) the
Nearest Neighbor method is used, and the machine
is trained with “ideal” chroma vectors: those whose
entries are 1’s in the notes of the chord and 0’s other-
wise.
For the purpose of evaluating our visual method
and comparing its performance with the analogous
audio-based technique, we have implemented an
audio-based chord detection algorithm similar the
one introduced by Fujishima, where instead of using
“ideal” chords, the machine was trained with samples
from real recorded chords, and at the classification
phase we have used the K Nearest Neighbor algorithm
with K > 1.
4 PROPOSED VIDEO-BASED
METHOD
Let us define the Region of Interest (ROI) in the scene
of a person playing guitar as being the region includ-
ing the strings, from the nut to the bridge.
Figure 1 shows the equipment that supports our
method. We use a infrared camera to capture the
scene, which is properly illuminated with infrared
light. Special markers (fiducials) are attached to the
guitar in order to easily locate the instrument, and
for the fingers, reflexive gloves dress the middle pha-
langes.
The pipeline of our chord detection method is il-
lustrated in Figure 2. The developed software takes
advantage of some nice and robust algorithms imple-
mented in OpenCV, an open source Computer Vision
library (Bradski and Kaehler, 2008).
Figure 2: Chord detection pipeline, from top to bottom. (1)
A threshold is applied to take only guitar and finger mark-
ers. (2) Guitar fiducials and finger rods are detected using
a contour detection algorithm. (3) A projective transfor-
mation “immobilize” the guitar, regardless the movement
caused by the musician. (4) The projective transform is ap-
plied to the north-most extreme of finger roads in order to
roughly locate the fingertips in guitar-fretboard coordinates.
VISAPP 2010 - International Conference on Computer Vision Theory and Applications
488

First, a threshold is applied to the input image, so
that the only non-null pixels are those of the guitar
and finger markers. Then, using the contour detec-
tion algorithm and contour data structure provided by
OpenCV, guitar and finger markers can be separated.
Note that guitar fiducials and finger markers are, re-
spectively, contours with and without a hole. Once
the positions of the four guitar fiducials are known in
the image, by using their actual positions in guitar fin-
gerboard coordinates a projective transformation (ho-
mography) can be determined and applied in order to
“immobilize” the guitar and easily extract the ROI.
This homography is then applied to the north-most
extreme of the finger rods, so we get the rough posi-
tion of fingertips in guitar fretboard coordinates, since
the distal phalanges are, in general, nearly perpendic-
ular to the fingerboard.
We use a supervised Machine Learning technique
to train the machine with the guitar chords we want
it to identify. The chord a musician plays is viewed
by the system as an eight-dimensional vector com-
posed by the coordinates (after projective transfor-
mation) of the four fingertips, from the little to the
index finger. By analogy with the PCP, we call this
eight-dimensional vector the Visual Pitch Class Pro-
file (VPCP).
Summarizing, the proposed algorithm for real-
time guitar chord detection has two phases. In the
first (the training phase), the musician chooses the
chords that must be identified and takes some samples
from each one of them, where by sample we mean
the eight-dimensional vector formed with the posi-
tions of the north-most extreme of the finger rods, i.e.,
the VPCP. In the second (the identification phase), the
system receives the vector corresponding to the chord
to be identified and classifies it using the K Nearest
Neighbor algorithm.
5 COMPARISON AND
DISCUSSION
Before talking about quantitative comparisons, let’s
address some theoretical aspects. Video methods,
even knowledge-based, are immune to wrong tuning
of the instrument. Despite not being desirable to play
a wrong tuned instrument, this feature is good for be-
ginners, that are not able to have a precisely regu-
lated guitar. On the other hand, it can be argued that
knowledge-based methods only work properly when
trained by the final user itself, since the shapes of
some given chord are slightly different from person to
person. This is a fact, but the knowledge-based tech-
niques using audio data also have to face with this
problem, since different instruments, with different
strings, produce slightly different songs for the same
chord shape.
Seeking quantitative comparisons, we take 100
samples from each one of the 14 major and minor
chords in the keys of C, D, E, F, G, A, B, choosing
just one shape per chord (in the guitar there are many
realizations of the same chord). The video samples
were taken by fixing a given chord and, while mov-
ing a little bit the guitar, waiting until 100 samples
were saved. For the audio samples, for each chord we
recorded nearly 10 seconds of a track consisting of
strumming in some rhythm keeping fixed the chord.
The audio data was then pre-processed in order to re-
move parts corresponding to strumming (where there
is high noise). Then, at regular intervals of about 12
milliseconds an audio chunk of about 45 milliseconds
was processed to get its Pitch Class Profile, as de-
scribed in Section 3.
These audio and video samples tend to form clus-
ters in R
12
and R
8
, respectively. Figure 3 provides
some analysis of them. Note that in both cases the
samples are placed very close to the mean of the re-
spective cluster, but there are more outliers in the au-
dio data.
Regarding classification performance, both meth-
ods behaved similarly in the tests we have conducted.
The difference is that the audio-based algorithm is
sensitive to the noise caused by strumming, while the
video-based method don’t care about it. This is il-
lustrated in Figure 4, where the same chord sequence
(played twice) was performed and analyzed by the
two methods, using 20 Nearest Neighbors for clas-
sification. Note how more stable is the video-based
method. It can also be seen that both algorithms have
problems with chord transitions.
6 CONCLUSIONS AND FUTURE
WORK
We have seen that both methods have similar classifi-
cation performance, but the VPCP algorithm is more
stable in the sense that (1) the clusters formed at the
training phase are better defined and (2) the visual
method is not sensitive to the noise caused by strum-
ming.
Given the high similarity between the classical
audio-based method and our proposed video-based al-
gorithm, a natural direction of research is to combine
both classifiers using some data fusion technique.
There is also some issues of the VPCP method
which have to be treated. The first is to eliminate the
need of the middle-phalanges gloves. Although they
VISUAL PITCH CLASS PROFILE - A Video-based Method for Real-time Guitar Chord Identification
489
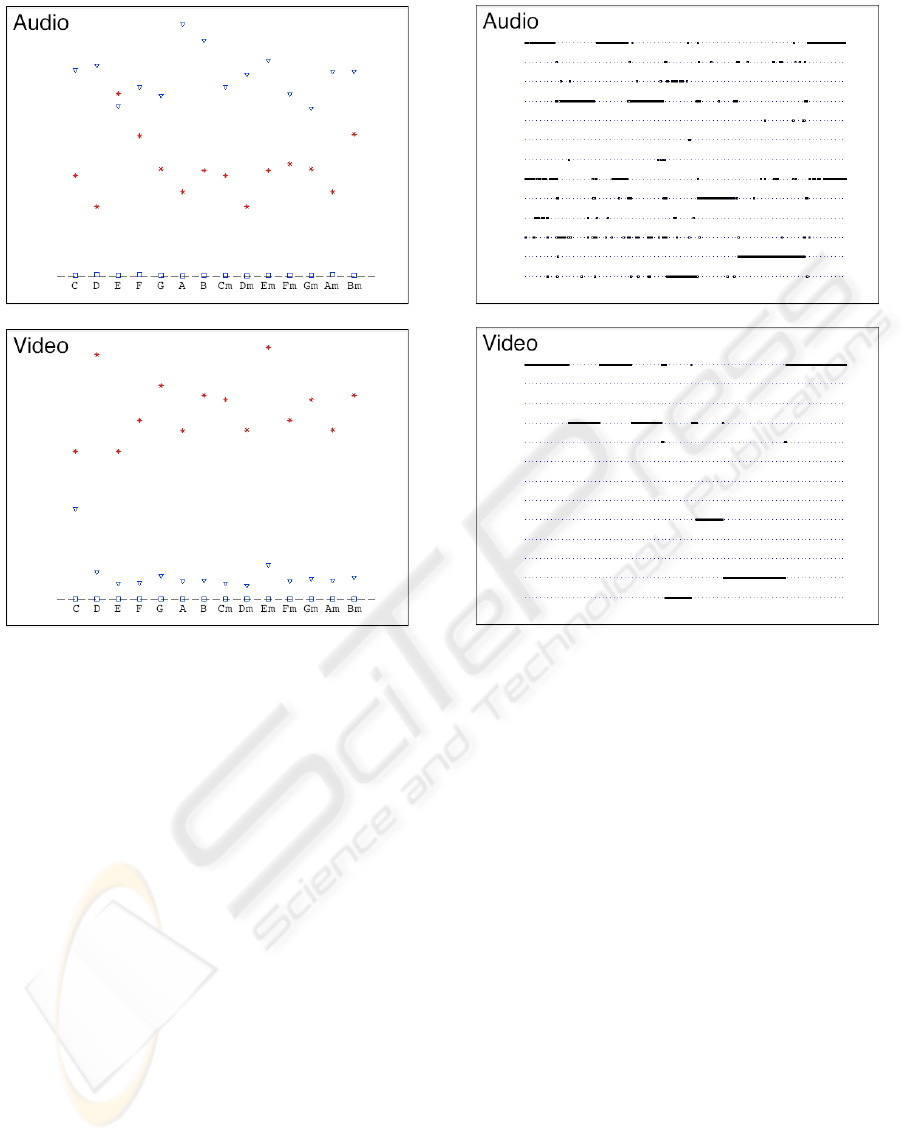
Figure 3: Analysis of the audio and video sample clusters.
A square (respectively, a triangle) represent the average (re-
spectively, the maximum) distance between the class sam-
ples and the class mean vector. The asterisk represent the
distance between the cluster mean vector and the nearest
cluster mean vector. This shows that the clusters of video
samples are better defined relatively to those from audio
samples.
are unobtrusive for the user, having a undressed hand
is highly desirable. Also, since the rods stay out of
the fretboard and we are applying a perspective (plane
to plane) transformation, rotating the guitar in the di-
rection of the neck axis causes a vertical shift in the
transformed rod north-most points.
To cope with these issues we plan to use two cal-
ibrated cameras, one working in the infrared range
to capture the guitar (which may have some infrared
LEDs), and the other in the visible range to capture
the fingertips using traditional hand- and contour- de-
tection methods.
REFERENCES
Bradski, G. and Kaehler, A. (2008). Learning OpenCV:
Computer Vision with the OpenCV Library. O’Reilly.
Burns, A. and Wanderley, M. (2006). Visual methods for
Figure 4: The same chord sequence, played twice, is ana-
lyzed by the traditional audio-based algorithm and our pro-
posed video-based method. While the former needs some
extra processing to cope with the noise caused by strum-
ming, our video based method is immune to that. However,
both techniques have problems with chord transitions.
the retrieval of guitarist fingering. In Conference in
New Interfaces for Musical Expression.
Cabral, J. (2008). Harmonisation Automatique en Temps
Reel. PhD thesis, Universite Pierre et Marie Curie.
Fujishima, T. (1999). Real-time chord recognition of mu-
sical sound: A system using common lisp music. In
International Computer Music Conference.
Jehan, T. (2005). Creating Music by Listening. PhD thesis,
Massachusetts Institute of Technology.
Kerdvibulvech, C. and Saito, H. (2007). Vision-based gui-
tarist fingering tracking using a bayesian classifier and
particle filters. Advances in Image and Video Technol-
ogy.
Paleari, M., Huet, B., Schutz, A., and Slock, D. (2008). A
multimodal approach to music transcription. In 15th
International Conference on Image Processing.
Quested, G., Boyle, R., and Ng, K. (2008). Polyphonic note
tracking using multimodal retrieval of musical events.
In International Computer Music Conference.
VISAPP 2010 - International Conference on Computer Vision Theory and Applications
490
