
DIMENSION REDUCTION BASED ON CENTROIDS FOR
MULTIMODAL ANATOMICAL LANDMARK-BASED 3D/2D
REGISTRATION OF CORONARY ANGIOGRAMS
Klaus Drechsler and Cristina Oyarzun Laura
Department of Cognitive Computing & Medical Imaging
Fraunhofer Institute for Computer Graphics Research IGD, Darmstadt, Germany
Keywords:
Cardiology, Catheterization, Dimension Reduction, 3D/2D Registration, Exhaustive Search, Search Space
Reduction.
Abstract:
We present an anatomical landmark-based rigid 3D/2D registration algorithm to register computed tomogra-
phy angiography (CTA) datasets with coronary angiograms (CA) gathered during a cardiac catheterization.
It has to solve for six transformation parameters (three rotation and three translation parameters). An ex-
haustive search in a six dimensional search space is usually computationally very expensive and algorithms
using optimization strategies can get lost in local minima. We propose a method based on centroids to reduce
search space from six to four dimensions. Modern C-Arm devices store a lot of information about the acqui-
sition geometry that are used to further reduce the search space. We use this method to develop an efficient
smart exhaustive search to solve for the six transformation parameters in a competitive time. With our method
registration errors of < 2 mm are feasible. Execution times of < 1 sec. can be reached on a QuadCore CPU.
1 INTRODUCTION
The blockage of the coronary arteries, which bring
oxygen rich blood to the heart muscle, can lead to
damaged/death parts of the muscle. This in turn can
lead to a heart attack, which is the leading cause of
death worldwide. The current gold standard for de-
tecting these blockages (called plaques) is an invasive
coronary angiography. A coronary angiography is the
process of injecting a contrast agent directly into the
coronary arteries through a catheter and monitoring
this process using a C-Arm X-Ray device that is able
to record the injection as a video sequence.
We assume that in the near future the diagnos-
tic of the coronary arteries will be done using non-
invasive computed tomography angiography (CTA)
and that only the intervention, if necessary, will be
done in a catheter laboratory (to insert e.g. stents) or
in an operation room (to do a bypass surgery). This
assumption is not unrealistic: A steadily increasing
number of hospitals are already using CTA for diag-
nostic purposes and papers successfully investigating
CTA for this use case were published (e.g. (Hoffmann
et al., 2005) and (Mieres et al., 2007)). A combina-
tion of preoperatively gathered CTA dataset and oper-
atively gathered CA will further enhance the trust in
CT for the assessment of the coronary arteries. We
use a tool that is able to carry out an automated quan-
titative analysis of the coronary arteries using CTA
datasets (Wesarg et al., 2006), whose output has been
positively evaluated in a clinical study (Khan et al.,
2006), (Wesarg et al., 2008). Our goal is to display the
analysis results of this tool (the found pathologies like
plaques) directly in the CA of the patient. Thus, the
problem can be reduced to a 3D/2D rigid registration
problem. It has to find three rotation and three trans-
lation parameters that bring the 3D CTA volume into
a position within a virtual C-Arm device that equals
the position of the patient on the table when the 2D
CA was gathered using the real C-Arm device. A vir-
tual CA gathered by the virtual C-Arm device is then
appromimately the same than the CA gathered by the
real C-Arm device.
In this paper we present a landmark-based 3D/2D
registration algorithm to register CTA datasets with
CAs. Therefore the CTA is used to generate an ar-
tificial CA, called digitally reconstructed radiographs
(DRR), which is used in an intermediate step and dis-
1
Drechsler K. and Oyarzun Laura C.
DIMENSION REDUCTION BASED ON CENTROIDS FOR MULTIMODAL ANATOMICAL LANDMARK-BASED 3D/2D REGISTRATION OF CORONARY ANGIOGRAMS.
DOI: 10.5220/0002826100490056
In Proceedings of the International Conference on Imaging Theory and Applications and International Conference on Information Visualization Theory and Applications (VISIGRAPP 2010),
page
ISBN: 978-989-674-027-6
Copyright
c
2010 by SCITEPRESS – Science and Technology Publications, Lda. All rights reserved

played side-by-side with the CA to allow the user to
select anatomical correspondences. Afterwards an ex-
haustive search is executed to solve for the six param-
eters (three rotation and three translation parameters).
We introduce a novel method to reduce the search di-
mension from six degrees of freedom to four, which
to the best of our knowledge has never been applied
to this problem before. Although we used this method
to speed-up an exhaustive search algorithm, it can be
also used with more advanced optimization strategies.
However, compared to other methods an exhaustive
search does not get lost in local minima. We show
in an experiment that RMS registration errors of < 2
mm are feasible and execution times of less than 1
sec. can be reached on a QuadCore CPU.
The remainder of this paper is organized as fol-
lows. The next section presents related work. The
following section 3 describes the workflow of the reg-
istration process from an user point of view. In sec-
tion 4 the used methods are described. Especially our
registration and dimension reduction methods are de-
tailed. In section 5 the results of an experiment are
presented and discussed in section 6. And in section
7 we finally conclude this paper.
2 RELATED WORK
When developing applications that combine and use
information gathered from different modalities, regis-
tration plays an important role. 3D/2D registration al-
gorithms can be classified as intensity-based, feature-
based or as hybrid approaches between those two.
Feature-based methods can be further classified ac-
cording to the type of feature used.
A system that uses external features is described
by Filippatos in (Filippatos, 2006). They use a
fiducial-based registration to match the 3D CT vol-
ume to the intraoperative x-ray image. Therefore they
calculate the transformation matrix that matches the
3D points (that correspond to fiducial markers in the
CT volume) with the corresponding 2D x-ray points
and use it to initialize the 3D volume in an adequate
position.
The work presented in (Lau and Chung, 2006)
uses internal features. They studied how to avoid
the problem of local minima that occurs in high-
dimensional image registration. For their experiments
they used the vessels centerline as feature. The opti-
mization method consist of calculating the result of
the cost function in a low resolution environment, op-
timizing it with Powells method using sum of squared
differences as metric, and doing a final optimization
with the best obtained transformation matrix in the
high resolution environment. The authors report an
execution time of 13 min. on one 2.5 GHz processor
with 512 GB RAM using Matlab. They estimate that
they can achive an execution time of approximately
30 sec. using C++ and further optimizations.
In (Langs et al., 2004) the authors describe a reg-
istration method based on internal features. In their
registration approach the user has to mark two corre-
sponding points in the 3D model of the vessels and
the 2D x-ray image. However, if a doctor has to select
a point in 3D and a corresponding point in 2D then
he has either to reconstruct a 3D image from the 2D
x-ray or a 2D image from the 3D model in his head
to decide which points correspond. We avoid this by
generating a DRR from the CT-data and let the user
select the point in two similar 2D images. The au-
thors report execution times of approximately 0.3 sec.
Unfortunately it is not clear how they solved for the
six transformation parameters. It seems that they use
the primary and secondary angle of the C-Arm de-
vice together with two manually selected points to di-
rectly solve an equation to get the remaining param-
eters. But because of patient movement between ac-
quisitions and error-prone points this seems not the
way to go.
In (Groher et al., 2007) the authors propose an au-
tomatic 3D/2D registration algorithm based on bifur-
cations as internal features. They use shape context
descriptors to establish correspondences between bi-
furcations in both modalities. The authors used a rigid
phantom for their experiment and reached an execu-
tion time of 2-6 sec. for the registration.
The work presented in (Turgeon et al., 2005) be-
longs to the class of intensity-based methods. It deals
with similarity-based 3D/2D registration of coronary
angiograms using binary images instead of gray scale
images. The authors obtain a 4D model of the heart
composed of realistic 2D and 3D images to create a
simulation environment for evaluation purposes. The
registration is carried out using entropy correlation
coefficient as metric and the downhill simplex method
as optimization strategy. The execution time of their
algorithm is between 17 and 32 sec. on two 3 GHz
Xeon processors with 1 GB of RAM.
3 APPLICATION WORKFLOW
In this section the workflow from a user point of view
is described. We assume that the C-Arm is calibrated
and that the intrinsic parameters are known. Basically
the workflow consists of six consecutive steps as fol-
lows.
IMAGAPP 2010 - International Conference on Imaging Theory and Applications
1
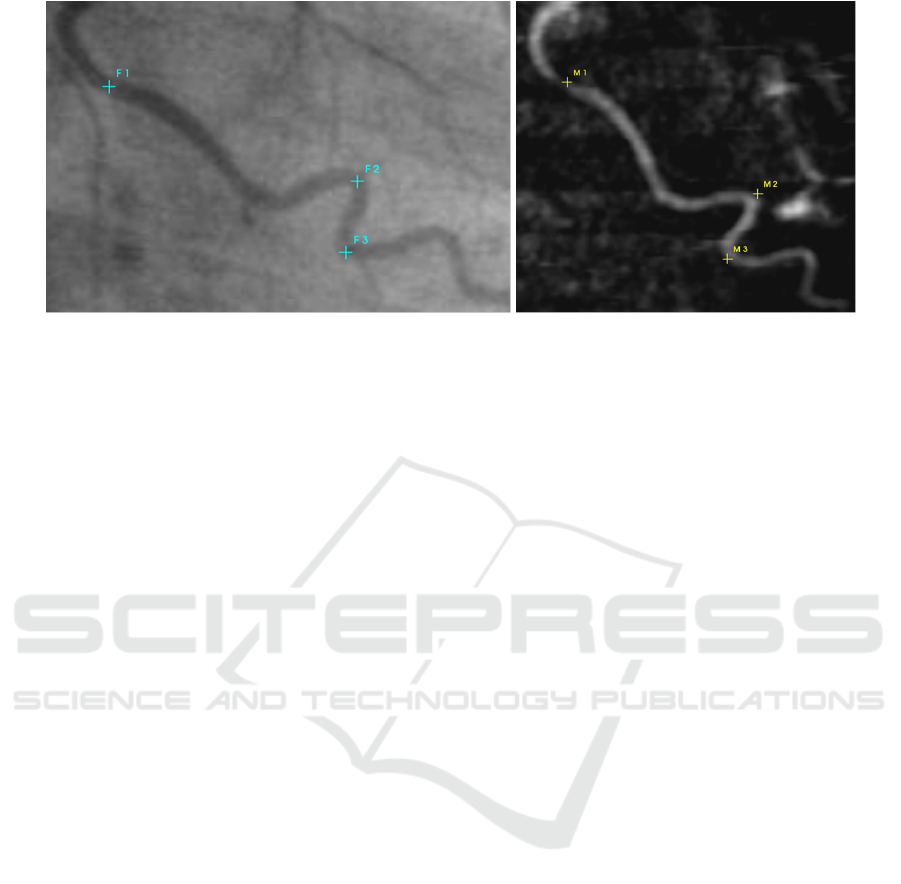
Figure 1: The coronary angiogram and a DRR calculated from CT data is displayed. The user user has to select corresponding
landmarks in both images.
Step 1 - Image Selection. As described in the in-
troduction section, during the catheterization a video
sequence of the process is recorded. In the first step
an appropriate image from this sequence has to be se-
lected. An image is considered as appropriate if the
displayed heart cycle corresponds to the heart cycle in
which the CTA data was gathered and if the injected
contrast agent is still in the arteries. Using available
ECG information, this is not difficult to do.
Step 2 - DRR Creation. The task of the next step is
to create a DRR from the CTA dataset that shows the
heart approximately in the same position as the heart
in the CA that was selected in step 1. State-of-the-
art angiographic C-Arm devices store lots of infor-
mation, including the rotational angles of the C-Arm
during the recording of the video sequence. This in-
formation is used to create the DRR. However, older
C-Arm devices do not store all rotational angles, so
that user intervention would be necessary to approxi-
mately find the missing angles.
Step 3 - Display DRR and CA. In this step the cre-
ated DRR and CA are displayed side-by-side on two
monitors (see fig. 1) or overlapped on one monitor. In
the latter case the user can crossfade the two images
using a slider.
Step 4 - Select Corresponding Point Pairs. In this
step the user has to select n corresponding anatomical
landmarks in both images as depicted in fig. 1. Typi-
cally n = 4 is sufficient, but more points can improve
the quality of the final result.
Step 5 - Align Points. After the user has selected
n corresponding landmarks, the points in the DRR
image will be automatically aligned to the closest
vessel centerline. This enables the backprojection
of the selected 2D DRR points to 3D space of the
CTA volume, which is required to carry out a 3D/2D
landmark-based registration. Therefore we developed
a concept that we call ’alignment map’. The 3D
centerline voxels are projected into 2D space with
the same parameters used for creating the DRR. The
alignment map contains the projected 2D points and
the corresponding 3D points of the centerline. The
effect of aligning the points is shown in fig. 2. After
aligning the points, they can be backprojected to 3D
space by querying the alignment map.
Step 6 - Carry out Registration. At this point the
following parameters are given.
• n corresponding 2D points (a
i
, d
i
), i : 0...n − 1
• 3D points D
i
= map(d
i
) (using the alignment
map)
• Matrix K with intrinsic parameters of the C-Arm
device, which includes the focal length which
can be found as source-to-detector distance dist
std
which can be found in the DICOM header
• Primary (γ) and secondary (α) angles found in the
DICOM header
• The source-to-object distance dist
sto
found in the
DICOM header
Given these parameters the problem can be formu-
lated as follows. Find euler angles α, β, γ and t =
(t
x
,t
y
,t
z
) such that
a
i
= K · (R
α,β,γ
· D
i
+t) (1)
Because the selected corresponding landmarks are
error-prone and not exact the problem turns out to be
a minimization problem.
',0(16,215('8&7,21%$6('21&(1752,'6)2508/7,02'$/$1$720,&$/
/$1'0$5.%$6('''5(*,675$7,212)&2521$5<$1*,2*5$06
13
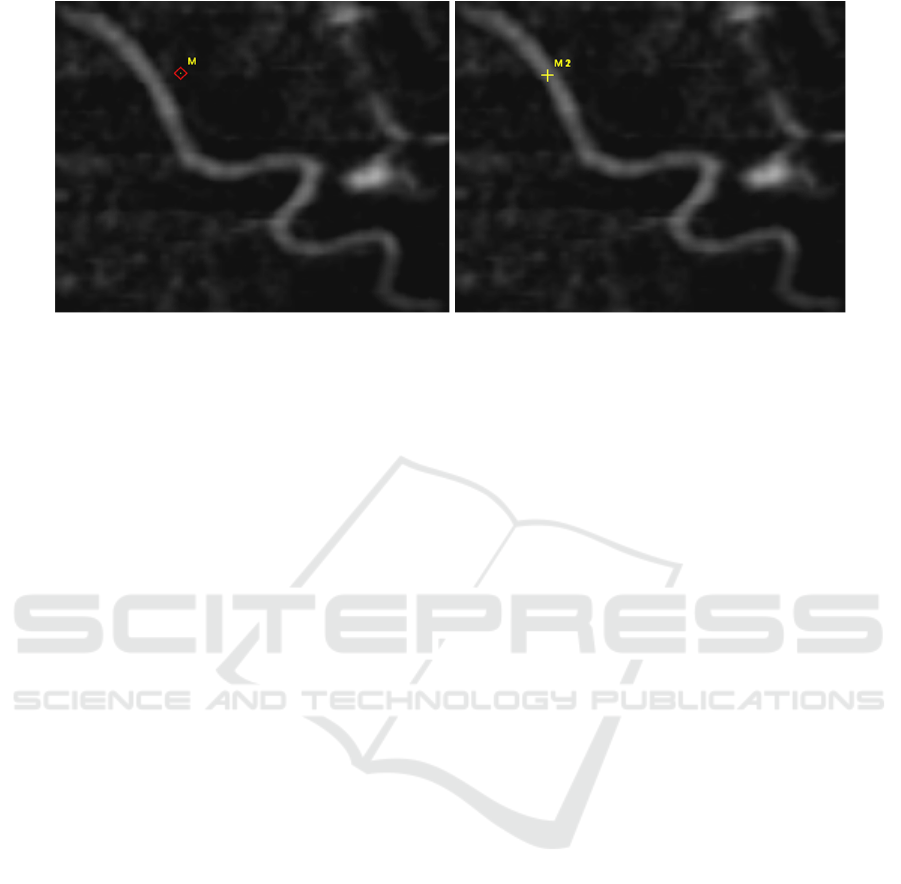
Figure 2: The selected point in the left image is aligned to the closest vessel centerline as shown in the right image. This
enables the backprojection of this 2D point into 3D space using our alignment map. The images show an extreme example to
illustrate the idea. Usually points are selected that are somewhere on a vessel or at least very close to it and not that far away.
4 METHODS
The following subsection gives an overview of used
algorithms to extract the heart, segment arteries and
generate DRRs. Afterwards our registration method
is described.
4.1 Image Processing
Cardiac CT data normally contains non-cardiac struc-
tures such as ribs, lungs or the sternum. These struc-
tures obscure the view to the heart, but an isolated
heart is necessary to make a visualization of the coro-
nary arteries on the surface of the heart possible. We
use the approach presented in (Jaehne et al., 2008)
which is desribed as follows. A partition (labels) of
the anatomical structures by automatically selecting
thresholds using Otsus method (Otsu, 1979) is ob-
tained. The two brightest gray levels are used to cal-
culate the center of gravity for every axial slice, which
lies in the middle of the heart. From this point ra-
dial search rays are send out in order to find the outer
boundary of the heart. These rays will be too long at
places where overlapping structures like the aorta or
the sternum are present, thus preventing this method
to function properly. These parts are handled as fol-
lows. On each side of the aorta and the sternum the
last rays which hit lung tissue and therefore have the
correct length are automatically detected. Interpola-
tion is then used to correct the rays between them.
The found end points are connected and a binary mask
is generated which is used as a mask on the original
CT data to extract the heart.
The result of the previous algorithm is used to seg-
ment the coronary arteries using a tracking based seg-
mentation algorithm, which is described in (Wesarg
and Firle, 2004). The data is preprocessed with an
adaptive threshold filter that takes the gray values of
three user provided seed points (start, direction and
end point) and the CT data as inputs. It takes into ac-
count that the contrast agent is not equally distributed
in the vessel. It follows an opening operation to re-
move connections to neighboring tissues and to the
vessel wall behind hard plaques. The actual algorithm
gets the results of the opening operation, the original
image and the output of the adaptive threshold filter
to calculate a path (centerline and border) between a
start and end point that lies within the vessel. After-
wards a 3D model is generated using the marching
cubes algorithm (Lorensen and Cline, 1987).
We use the approach presented in (Lacalli et al.,
2008) to calculate a DRR of the heart. First a pre-
processing of the original CT data is carried out to
avoid insufficient results due to non-cardiac structures
and large cardiac cavities (e.g. ventricles and atria)
that are filled with contrast agent. The latter would
occlude the coronary arteries in the DRR and must
therefore be removed. To remove the cavities from
the extracted heart a thresholding operation on the la-
beled CT data (that was generated in the heart extrac-
tion step described above) is first applied to remove
everything but the highest label that correlates with
both the cavities and the arteries. The coronary arter-
ies are then removed by an erosion operation followed
by a neighborhood filter along all the three orthogonal
axes. Finally a dilation operation is applied to restore
the original size of the cavities. The result is used as a
mask to remove the cavities from the extracted heart.
A perspective projection is then carried out to gener-
ate the DRR to simulate a coronary angiogram.
IMAGAPP 2010 - International Conference on Imaging Theory and Applications
1
4.2 Registration Method
As written in the previous section, we are dealing with
a minimization problem. We use the root mean square
(RMS) error as metric that we are minimizing using
our algorithm. The RMS error is defined as
RMS
error
=
q
(a
i
− d
0
i
)
2
(2)
where a
i
is the selected point in the CA and d
0
i
the
transformed and projected point D
i
calculated accord-
ing to equation 1 as
d
0
i
= K · (R
α,β,γ
· D
i
+t) (3)
Source
(0,0,0)
Detector
(0,0,dist
std)
Table
(0,0,dist
sto
)
Patient surface
(0,0,dist
sto
-dim
z
)
search space
}
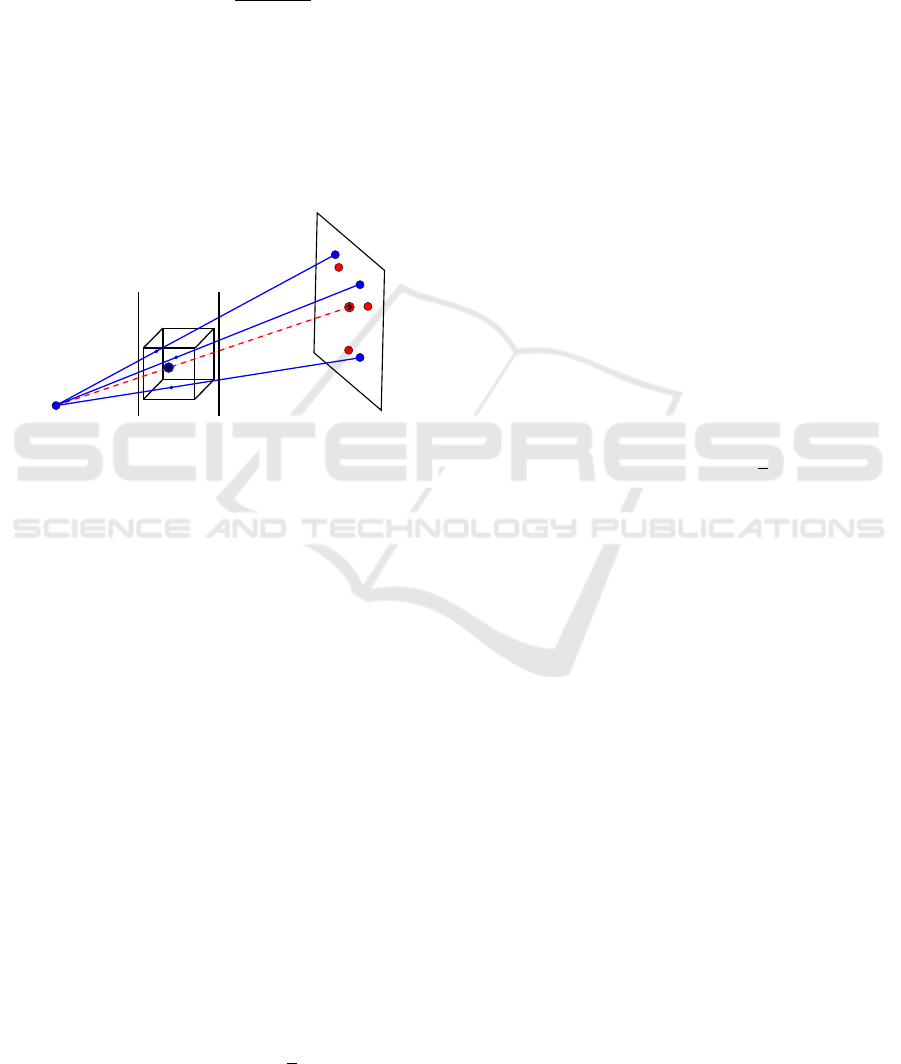
Figure 3: The image shows the most important ideas to re-
duce the dimensions and search space. The blue points in
the cube are the points D
0
i
. The red line is the centroid line
from source to the centroid of the points a
i
. The search
space is limited by the table and the patient surface.
We developed an algorithm that we call ’smart ex-
haustive search’ that guarantees to find the minimum
RMS
error
(because it does an exhaustive search) and is
very well parallelizable. A normal exhaustive search
has to take six degrees of freedom into account and
thus would be very inefficient for our application. The
key idea behind our algorithm is to reduce the dimen-
sions to four degrees of freedom (three rotation and
one translation parameter) and then further reduce the
remaining search space by taking all the given param-
eters into account.
We explain now how we reduced the degrees of
freedom from six to four. Therefore we define that
the source of the C-Arm device is always at the origin
of the world coordinate system and the detector plane
is dist
std
away in the z-dimension, thus src = (0, 0, 0)
and det = (0, 0, dist
std
). We further define the centroid
of the n 2D points a
i
as
centroid
2D
=
c2d
x
c2d
y
=
1
n
n−1
∑
i
a
i
(4)
The result of equation 4 is enhanced by a z-
component, which is set to the source-to-detector dis-
tance dist
std
, thus centroid
2D
is guaranteed to lie on
the detector plane:
centroid
2DZ
=
c2d
x
c2d
y
dist
std
(5)
Next we construct a line, called centroid line
or cline, from the source of the C-Arm device to
centroid
2DZ
(see red dotted line in fig. 3), which is
given by
cline(p) =
t
x
t
y
t
z
= src + p · (centroid
2DZ
−src) (6)
Parameter p has to be between 0 and 1 and indi-
cates the distance from src in direction of det. Fur-
ther, we define the rotated and translated points D
i
as
D
0
i
= (R
α,β,γ
· D
i
+t) (7)
and equally to equation 4 the centroid of the n 3D
points D
0
i
as
centroid
3D
=
c3d
x
c3d
y
c3d
z
=
1
n
n−1
∑
i
D
0
i
(8)
Now it can be observed that, after a successful reg-
istration,in the theoretical case where the given land-
marks are accurately known, the centroid of D
0
i
must
lie on cline(p) and K · centroid
3D
= centroid
2DZ
(see
fig. 3). We can then calculate the resulting transla-
tion vector t from parameter p using equation 6. This
knowledge can be used to reduce the degrees of free-
dom from six to four by moving centroid
3D
during the
exhaustive search along cline(p), thus we only have
to solve for four parameters, namely α, β, γ and p to
minimize equation 2. In practice the landmarks are
not accurately known, but error-prone. The effect of
moving centroid
3D
along cline(p) in this case is that
the error between corresponding landmarks is aver-
aged.
We further reduce the search space by taking the
source-to-object distance dist
sto
and the physical di-
mension in z-direction dim
z
of the CT volume into ac-
count. The name ’source-to-object’ is a little bit mis-
leading. It is really the distance between the source
of the C-Arm device and the table where the object
(the patient) is laying on. Thus, equation 2 is minimal
when centroid
3D
lies on cline(p) somewhere between
the table at coordinates (0, 0, dist
sto
) and the patient
surface at coordinates (0, 0, dist
sto
−dim
z
) (see fig. 3).
',0(16,215('8&7,21%$6('21&(1752,'6)2508/7,02'$/$1$720,&$/
/$1'0$5.%$6('''5(*,675$7,212)&2521$5<$1*,2*5$06
1
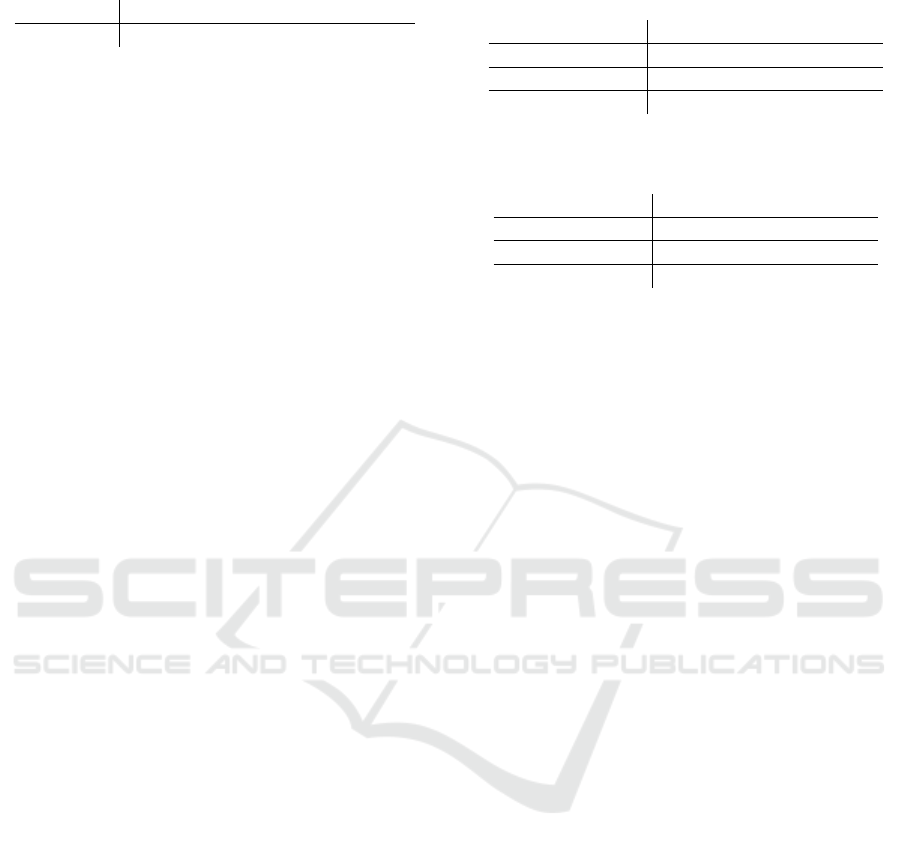
Table 1: Summary of the used parameters.
Parameter α β γ dim
z
dist
sto
Value 0.1 n/a -30.9 300 700
The search space can be reduced even more by
taking the given angles α and γ into account. Even
if the values are accurately known, the patient is not
lying in the same position as he was during the CTA
acquisition. Thus, these values can only be used as
rough estimations. In (Byrne et al., 2004) the au-
thors searched ±8 degrees around the given values.
We found that for our dataset searching ±20 degrees
around the stored values is necessary to find the mini-
mal RMS
error
. Thus, this value varies between differ-
ent C-Arm devices and different CTA/CA pairs.
4.3 Parallelization
The described method can be parallelized using n pro-
cessors by dividing parameter p into n equal sized
parts and let each processor execute independently the
described method for one part. Then, the processor
that calculated the smallest RMS
error
has found the
solution.
5 RESULTS
We evaluated our algorithm with one CTA/CA dataset
pair. The analysis tool mentioned in the introduc-
tion that we use to analyze the coronary arteries is
able to segment single branches of the coronary artery
tree and to calculate the vessel centerline. To qual-
itatively verify the registration results, we overlaped
these centerlines with the CA. We searched ±20 de-
grees around all given angles and around 0 for β. We
repeated the experiment two times. The first time
with a step width of 1 (experiment A), the second
time with a step width of 2 (experiment B). There-
fore we modified equation 6 by normalizing the vec-
tor centroid
2DZ
− src. With this modification pa-
rameter p has to be between 0 and the length of
centroid
2DZ
− src before normalization. All experi-
ments were executed on a PC equipped with an Intel
2.5 GHz DualCore CPU, 4 GB RAM and Windows
7 x64 as operating system. Table 1 summarizes the
parameters we used for the registration.
The registration was done using the workflow de-
scribed in section 3 and repeated four times using four
to seven corresponding point pairs. The results are
presented in table 2 and 3. For qualitative evalua-
tion we overlapped the centerlines of two segmented
branches of the coronary arteries in the CTA dataset
Table 2: Quantitative results of experiment A using a step
width of 1 mm.
Landmarks pairs 4 5 6 7
RMS error [mm] 0.81 0.76 1.16 1.5
SingleCore [s] 23.1 24.9 28.0 32.8
QuadCore [s] 5.8 6.2 7.0 8.2
Table 3: Quantitative results of experiment B using a step
width of 2 mm.
Landmarks pairs 4 5 6 7
RMS error [mm] 0.83 0.78 1.2 1.54
SingleCore [s] 1.8 1.9 2.0 2.4
QuadCore [s] 0.45 0.48 0.5 0.6
with the CA. The results are shown in fig. 4. There
were no visible differences between experiment A and
B. The estimated values for a QuadCore CPU were
calculated by dividing the execution time on a Sin-
gleCore CPU by four.
6 DISCUSSION
A general problem for methods based on the vessel
centerline as feature is that they rely on good ves-
sel segmentation algorithms which in turn depend on
good datasets where the contrast agent is spread op-
timally. This is also the case with our method. We
had three CTA/CA dateset pairs and were only able to
apply our method to one pair. The reason was mainly
that the contrast agent was not very well visible in the
CT datasets.
There is no visible and measurable difference be-
tween the top two images of fig. 4, but a short part of
the overlapped vessel centerlines is cleary not over-
lapped correctly near the root of the coronary artery
tree. In the bottom two images this problem is re-
duced by selecting more point correspondences at the
cost of slightly misalignments at other places of the
vessel tree. Although the RMS error was greater for
the bottom images, they generally look better than the
images in the top row. This is due to the fact that the
calculated centroids average landmark errors during
the registration process.
Because we manually selected a frame from the
recorded angiography, it could be that we selected
one that was not the best choice, hence the misalign-
ments. But using ECG information this should not be
a problem in general. Another reason could be that
the manually selected points were not corresponding
very well and thus introducing an error in the regis-
tration process.
The manual selection of corresponding points is
IMAGAPP 2010 - International Conference on Imaging Theory and Applications
1
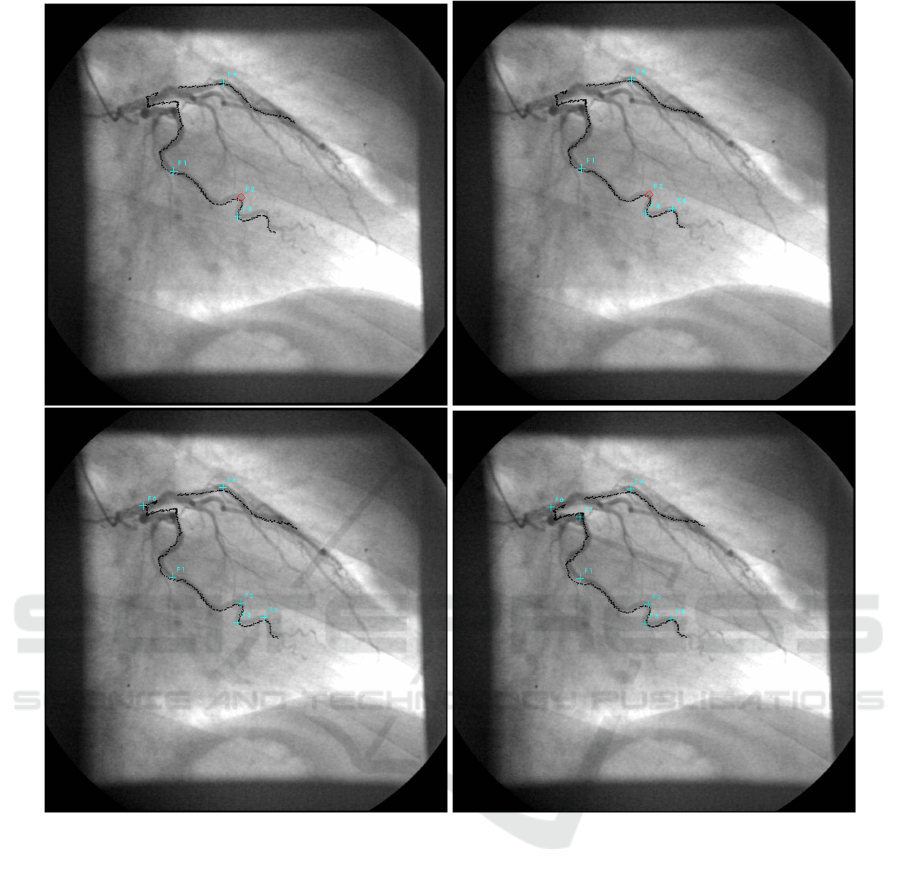
Figure 4: Qualitative results with four (top left), five (top right), six (bottom left) and seven (bottom right) manually selected
corresponding point pairs.
currently the biggest disadvantage of our method. An
interesting approach to solve for this can be found
in (Groher et al., 2007). The authors developed a
method to automatically find corresponding bifurca-
tions in 2D and 3D images based on shape context
descriptors.
There were no significant visible differences be-
tween experiment A and B, but using a step width of
2 in experiment A is significant faster.
In other experiments we found that it is important
which landmarks are chosen. If only landmarks from
one vessel branch are chosen, then it is likely that the
other branches will be fairly misaligned. This can
be acceptable if only one branch is of interest. But
in general it can be said, as a rule of thumb, that as
much landmarks as possible should be spread over the
whole vessel tree. Fortunately, the process of select-
ing corresponding landmark pairs is quite easy and
fast.
As can be seen from table 2 and 3 the process-
ing time needed to solve for the six transformation
parameters is, thanks to the presented strategies to re-
duce the dimensions and search space, quite compet-
itive when taking the estimated times into account.
If faster processing times are needed, the exhaustive
search can be replaced by more advanced optimiza-
tion strategies at the cost of risking to get lost in local
minima. Another option would be to use more pro-
cessors for the calculation and/or specialised architec-
tures like CUDA.
',0(16,215('8&7,21%$6('21&(1752,'6)2508/7,02'$/$1$720,&$/
/$1'0$5.%$6('''5(*,675$7,212)&2521$5<$1*,2*5$06
1

7 CONCLUSIONS
We presented a novel dimension reduction method
based on centroids that we successfully applied to a
multimodal anatomical landmark-based 3D/2D reg-
istration problem. We used this method to speed-up
an exhaustive search to solve for the six transforma-
tion parameters. In an experiment we have shown that
this method produced good results with competitive
processing times. The presented dimension reduc-
tion technique is not limited to exhaustive search, but
can also be used in combination with optimizers to
speed-up feature-based 3D/2D registration problems,
where features represents anatomical landmarks like
e.g. branch points.
Future work includes the automated detection
of corresponding point-pairs as inspired by (Groher
et al., 2007) and the use of more advanced optimiza-
tion strategies together with the presented dimension
reduction method to further speed-up the registration
for real-time usage. Furthermore, we are thinking
about ways to take the complete vessel centerlines
into account to improve the registration results.
REFERENCES
Byrne, J. V., Colominas, C., Hipwell, J., Cox, T., Noble,
J. A., Penney, G. P., and Hawkes, D. J. (2004). As-
sessment of a technique for 2d-3d registration of cere-
bral intra-arterial angiography. The British Journal of
Radiology, 77(914):123–128.
Filippatos, K. (2006). A navigation tool for the endovas-
cular treatment of aortic aneurysms - computer aided
implantation of a stent graft. Master’s thesis, Techni-
cal University of Munich.
Groher, M., Hoffmann, R.-T., Zech, C. J., Reiser, M., and
Navab, N. (2007). An efficient registration algorithm
for advanced fusion of 2d/3d angiographic data. In
Bildverarbeitung fr die Medizin (BVM), pages 156–
160. Springer.
Hoffmann, M. H. K., Shi, H., Schmitz, B. L., Schmid,
F. T., Lieberknecht, M., Schulze, R., Ludwig, B.,
Kroschel, U., Jahnke, N., Haerer, W., Brambs, H.-
J., and Aschoff, A. J. (2005). Noninvasive coronary
angiography with multislice computed tomography.
JAMA: Journal of the American Medical Association,
293(20):2471–2478.
Jaehne, M., Lacalli, C., and Wesarg, S. (2008). Novel
techniques for automatically enhanced visualization
of coronary arteries in msct data and for drawing di-
rect comparisons to conventional angiography. In
VISIGRAPP 2008: International Joint Conference on
Computer Vision and Computer Graphics Theory and
Applications. Proceedings. CD-ROM., pages S.290–
296. INSTICC Press.
Khan, M., Wesarg, S., Gurung, J., Dogan, S., Maataoui, A.,
Brehmer, B., Herzog, C., Ackermann, H., Assmus, B.,
and Vogl, T. (2006). Facilitating coronary artery eval-
uation in mdct using a 3d automatic vessel segmenta-
tion tool. European Radiology, 16(8):1789–1795.
Lacalli, C., Jaehne, M., and Wesarg, S. (2008). Automa-
tisierte verfahren zur verbesserten visualisierung der
koronararterien in msct-daten und fuer die direkte ver-
gleichbarkeit zur angiographie. In Bildverarbeitung
fuer die Medizin 2008: Algorithmen - Systeme - An-
wendungen, pages 283–287.
Langs, G., Radeva, P., Rotger, D., and Carreras, F. (2004).
Building and registering parameterized 3d models of
vessel trees for visualization during intervention. In
ICPR ’04: Proceedings of the Pattern Recognition,
17th International Conference on (ICPR’04) Volume
3, pages 726–729, Washington, DC, USA. IEEE Com-
puter Society.
Lau, K. and Chung, A. (2006). A global optimization
strategy for 3d-2d registration of vascular images. In
BMVC06, volume 2, page 489ff.
Lorensen, W. E. and Cline, H. E. (1987). Marching cubes:
A high resolution 3d surface construction algorithm.
SIGGRAPH Comput. Graph., 21(4):163–169.
Mieres, J. H., Makaryus, A. N., Redberg, R. F., and Shaw,
L. J. (2007). Noninvasive cardiac imaging. AFP:
American Family Physicians, 75(8):1219–1228.
Otsu, N. (1979). A threshold selection method from gray-
level histograms. IEEE Transactions on Systems, Man
and Cybernetics, 9(1):62–66.
Turgeon, G.-A., Lehmann, G., Guiraudon, G., Drangova,
M., Holdsworth, D., and Peters, T. (2005). 2d-3d
registration of coronary angiograms for cardiac pro-
cedure planning and guidance. Medical Physics,
32(12):3737–3749.
Wesarg, S. and Firle, E. A. (2004). Segmentation of vessels:
The corkscrew algorithm. In Medical imaging 2004:
Image processing., volume 5370, pages 1609–1620.
Wesarg, S., Khan, M., Jaehne, M., and Lacalli, C. (2008).
Automatisierte analyse der koronararterien basierend
auf msct-daten. Deutsche Zeitschrift fuer klinische
Forschung, 11(3/4):28–33.
Wesarg, S., Khan, M. F., and Firle, E. (2006). Localizing
calcifications in cardiac ct data sets using a new vessel
segmentation approach. Journal of Digital Imaging,
19:249–257.
IMAGAPP 2010 - International Conference on Imaging Theory and Applications
1
