
FUZZY SEGMENTATION OF MASSES IN DIGITAL BREAST
TOMOSYNTHESIS IMAGES BASED ON DYNAMIC
PROGRAMMING
Louis Apffel
†
, Giovanni Palma
‡§
, Serge Muller
‡
and Isabelle Bloch
§
†
Ecole Centrale Paris, Grande Voie des Vignes F-92 295 Chˆatenay-Malabry Cedex, France
‡
GE Healthcare, 283, rue de la Mini`ere, 78530 Buc, France
§
T´el´ecom ParisTech - CNRS LTCI, 46, rue Barrault, 75013 Paris, France
Keywords:
Fuzzy segmentation, Fuzzy contours, Dynamic programming, Digital breast tomosynthesis, Computer aided
detection.
Abstract:
In this paper we propose a new fuzzy segmentation method to segment lesions in Digital Breast Tomosynthesis
(DBT) datasets. In the proposed approach we model a contour as a path in the image. The optimal contour
is defined as the path associated with a minimal cost, which is derived from the image content. Using this
formalism we present several ways to alter this cost in order to extract several relevant contours from a single
image. The set of contours is then used in the fuzzy contour framework to perform mass detection. The
method has been tested on synthetic data as well as images containing lesions and provides promising results.
1 INTRODUCTION
Digital Breast Tomosynthesis (DBT) is a new 3D
imaging technique (Dobbins III and Godfrey, 2003;
Wu et al., 2003) that may potentially overcome some
limitations of standard mammography such as tissue
superimposition (Gennaro et al., 2008). Such an im-
provement is gained at the expense of an increased
amount of data to be reviewed by the radiologist. In
this context the design of a Computer Aided Detec-
tion (CAD) system may help the radiologist to keep
a high sensitivity in his detection and characterization
task. Segmentation is usually a crucial step in CAD
systems, and a wrong segmentation can have a disas-
trous impact on the whole detection scheme. The use
of fuzzy sets avoids these drawbacks (Peters, 2007).
This can be done by using the fuzzy contour frame-
work, which is suitable to represent several possible
contours for one specific structure. Unfortunately,
only a small amount of techniques exist in the litera-
ture (Bothorel et al., 1997; Peters, 2007; Palma et al.,
2008) to extract such fuzzy contours and they suffer
from various limitations. In this paper, we introduce a
new fuzzy contour extraction procedure by extending
a crisp segmentation method originally proposed for
standard mammography images, which models con-
tours as paths in an image (Timp and Karssemeijer,
2004).
First, in Section 2 we present the limitations of
crisp segmentation methods. Then in Section 3, we
recall the formalism of fuzzy contours. In Section 4,
we describe the new proposed algorithm and we dis-
cuss two aspects: uncertainty and imprecision, which
are both handled by our approach. Finally we illus-
trate results on both synthetic and clinical data.
2 LIMITATIONS OF CRISP
SEGMENTATION
In breast imaging, crisp segmentation has many lim-
itations. Indeed, segmenting some masses may be
particularly difficult when the contrast between lesion
and backgroundof the image is low. Radiologists may
have different and various opinions on the exact loca-
tion of a contour. A segmentation algorithm that pro-
poses a single answer to this kind of problem is usu-
ally taking an arbitrary decision on the nature of the
contour. Since the shape of the contour is suggestive
of the nature of the lesion (benign or malignant), an-
ticipating its nature from a single and inaccurate con-
tour could lead to a classification error.
The problem is illustrated in Figure 1 where a
7
Apffel L., Palma G., Muller S. and Bloch I. (2010).
FUZZY SEGMENTATION OF MASSES IN DIGITAL BREAST TOMOSYNTHESIS IMAGES BASED ON DYNAMIC PROGRAMMING.
In Proceedings of the International Conference on Imaging Theory and Applications and International Conference on Information Visualization Theory
and Applications, pages 7-13
DOI: 10.5220/0002826300070013
Copyright
c
SciTePress
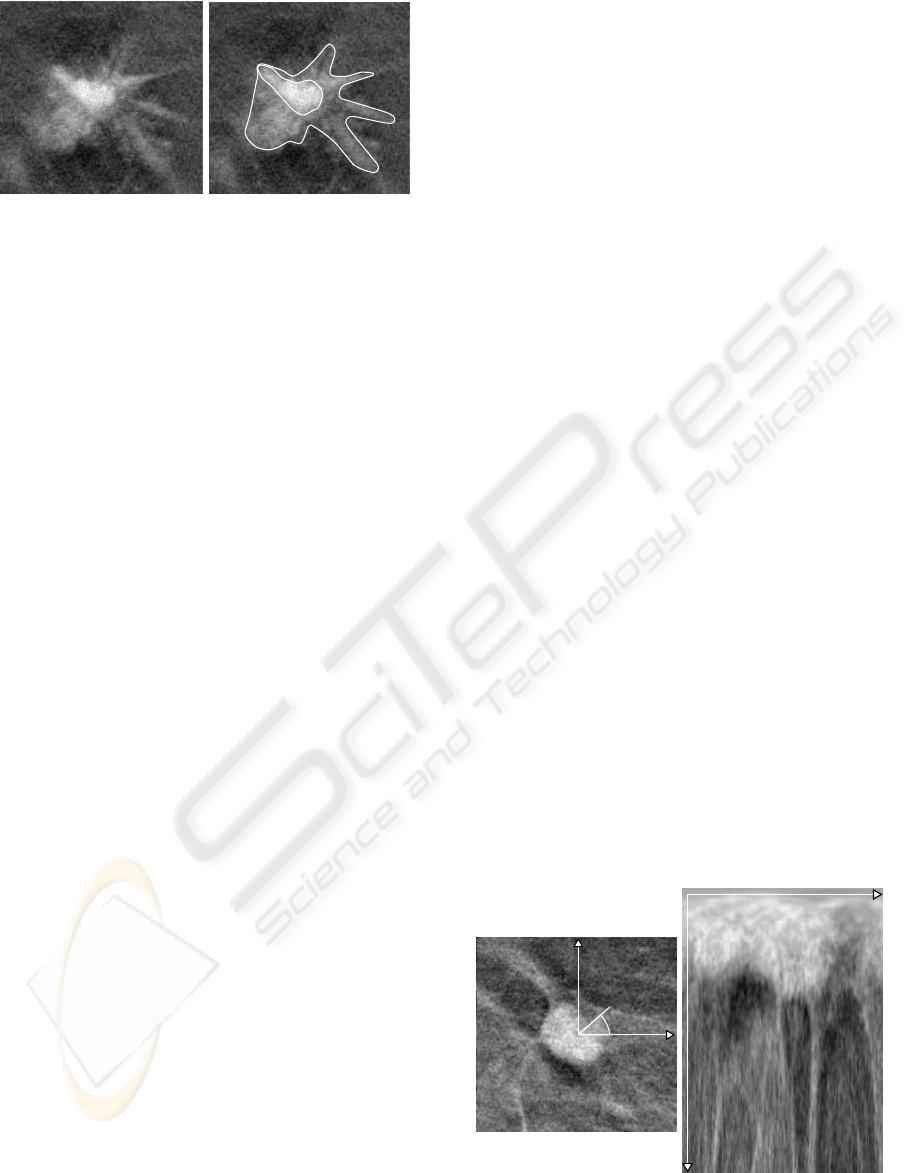
(a) (b)
Figure 1: Crisp segmentation problem: several contours can
fit a given lesion and may lead to different conclusions on
its class.
spiculated mass is presented with two different seg-
mentation results.
3 FUZZY SEGMENTATION
The fuzzy set framework seems to be suitable to deal
with the mass segmentationproblem (Peters, 2007). It
allows defining the concept of fuzzy contours, which
can overcome several limitations of regular segmen-
tation techniques by allowing not to make a decision
too early.
Definition 1. A fuzzy contour is a set of nested crisp
contours where each contour is associated with a
membership degree to the class contour.
3.1 Imprecision and Uncertainty
In DBT images, masses may present two types of im-
perfections. First, a lesion may be hard to define (i.e.
there are several possible contours that can fit the le-
sion boundaries) even if we are sure of its presence.
This is called imprecision. Secondly, it may some-
times be difficult to detect and locate a mass. In this
case we are dealing with uncertainty. A single fuzzy
contour can handle the notion of imprecision because
it considers several potential contours. On the other
hand, uncertainty can be handled by considering sev-
eral fuzzy contours.
3.2 Existing Schemes to Extract Fuzzy
Contours
In the literature, several techniques to extract fuzzy
contours have been proposed. Originally, a multi-
thresholding approach was designed in order to de-
tect microcalcifications in mammography (Bothorel
et al., 1997). This approach has also been used in
order to segment masses in projected images used to
reconstruct DBT volumes (Peters, 2007). Unfortu-
nately, because of potential superimpositions of tis-
sues in projection images, this approach is not well
suited for masses in 2D projection images.
More recently, a segmentation scheme based on
the level set framework (Osher and Fedkiw, 2002) has
been proposed (Peters, 2007; Palma et al., 2008). This
approach is taking advantage of the side effects in-
troduced on the Lipschitz function, which implicitly
represents a contour, during the minimization stage
of the contour energy. The idea is then to slice this
function at several levels after convergence to build a
fuzzy contour.
Unfortunately, tuning parameters of this segmen-
tation approach is a pretty difficult task. In fact, the
problem comes from the large variability of structures
that may be encountered in mammography. Further-
more, slicing the function representing the contour at
several levels is something that may be hard to inter-
pret.
4 DYNAMIC PROGRAMMING
AND FUZZY SEGMENTATION
4.1 Original Approach
Recently, an alternative to conventional approaches
was proposed (Timp and Karssemeijer, 2004). In this
approach, a contour is modeled as a path in an image
converted into the polar domain. This path is associ-
ated with a cost that depends on the image content.
This formulation allows using well known dynamic
programming (DP) techniques in order to efficiently
solve the problem. Several improvements have been
proposed based on this approach (Rojas and Nandi,
2007).
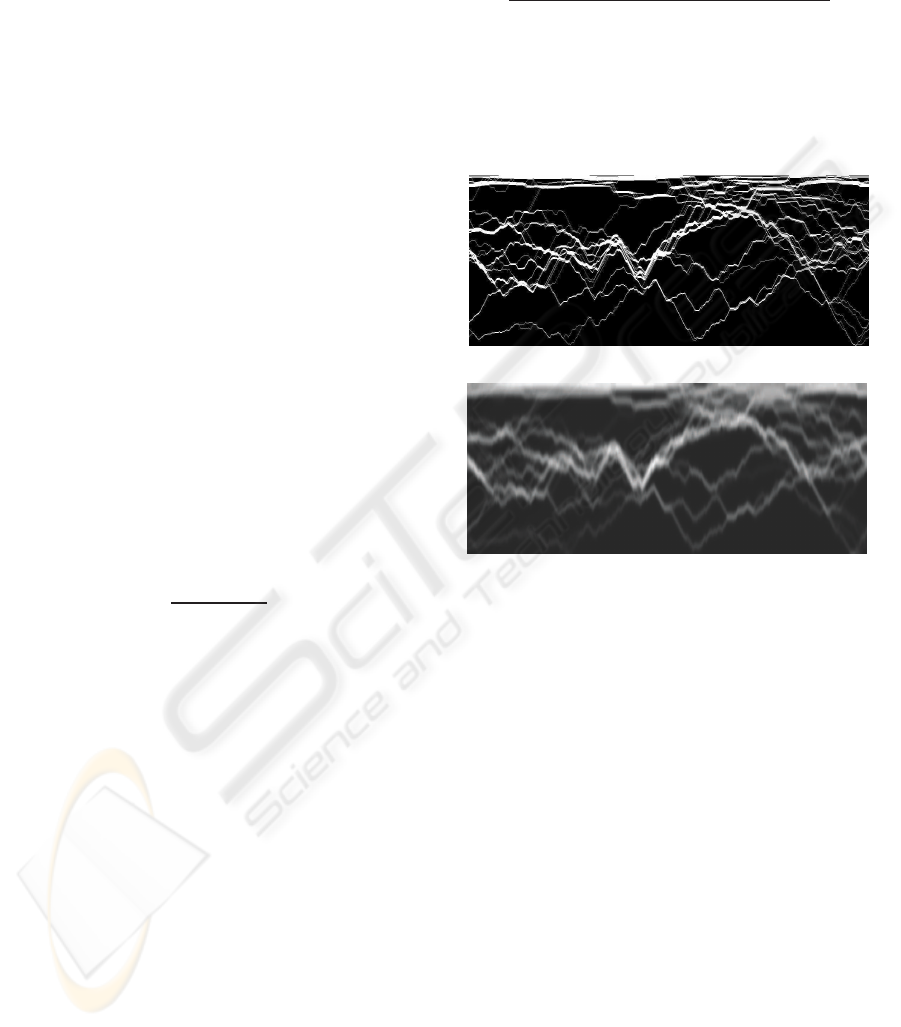
θ
r
(a)
θ
r
(b)
Figure 2: Polar coordinates representation (b) of a circum-
scribed lesion (a).
IMAGAPP 2010 - International Conference on Imaging Theory and Applications
8

The authors originally designed this algorithm on
standard mammography images. We eliminated the
use of the shape coefficient they propose since the
masses used in our database were of numerous shapes
and sizes and the research of fuzzy contours implies
contours of different radii. Concretely, the image to
segment is first converted in the polar domain. The
rows and the columns of the new image represent re-
spectively the distance to the lesion center and the
angle around it. This representation is illustrated in
Figure 2. A cost matrix is then defined on the same
domain leading to the definition of a cost function for
any path linking the first to the last column:
C (c) =
∑
θ∈[[0;θ
max
]]
M(θ,c(θ))
with M a cost matrix, θ
max
the index corresponding
to the maximum angle (2π), and c a path, which as-
sociates any angle in [0;2π[ with a radius. In our im-
plementation we used the measures based on the im-
age gradient along the radial direction and the optimal
gray value of the contour, which were proposed in the
original approach (Timp and Karssemeijer, 2004).
Now to introduce some smoothness in the con-
tours we may want to consider, we can restrict the
search space to the following set of contours:
P = {c/∀θ ∈ [[0;θ
max
]] |c(θ) − c(θ − 1)| ≤ f}
with f ∈ N the parameter allowing to tune the contour
smoothness.
The segmentation problem is then solved by
searching for a contour ˆc such that:
ˆc = arg
c∈P
minC (c)
This method was initially designed to segment cir-
cumscribed lesions in standard mammography. Our
implementation, which is similar as the original one
except for the lesion size prior, has been tested on
spiculated and circumscribed lesions in DBT as it will
be presented in Section 5.
We will now present our main contribution over
the original work by proposing means to extract fuzzy
contours from an image.
4.2 Penalization
To obtain several contours, the first idea was to pre-
vent the algorithm from using the pixels that have al-
ready been crossed by a path in the cost matrix by
setting their costs to an infinite value. This operation
can be iterated while non infinite cost paths exist in
the cost matrix.
When looking for a path in the cost matrix, the
DP-based algorithm is constrained by the parameter
f along the vertical axis whose role was previously
detailed. Thus, if we consider a pixel (θ,r) in the
cost matrix, the path can reach 2f + 1 pixels from
one column to another. This parameter allows radial
variations in the polar coordinates system described in
(Timp and Karssemeijer, 2004). Thus, a simple penal-
ization of the pixels through which goes the first path
does not prevent contours from crossing each other.
Contours obtained with such a method are often
similar to the first contour. To force finding a contour
with a significantly different shape, it is necessary to
generate a lot of contours, which might be hard to
handle in further processing. The information con-
veyed by the repetition of quasi-identical contours is
related to the imprecision contained in the lesion we
want to segment. This correlation has some mean-
ing but we may miss information related to the uncer-
tainty implicitly present in some images.
In order to satisfy the inclusion criterion required
by Definition 1, it is possible to penalize a band
nearby the path found in the cost matrix. Instead of
setting a one-pixel band to an infinite value, we pe-
nalize a band of 2f + 1 pixels. Thus, the algorithm
forces the contours to be nested.
4.3 Contour Selection and Elimination
In this section, we present an approach to model un-
certainty rather than imprecision. The goal is to ob-
tain a set of contours different from each other. To
guarantee that the contours will be different, we de-
fine a distance on the space of contours represented
in polar coordinates. Let c
1
(θ) and c
2
(θ) be two con-
tours, we define the distance d(r
1
,r
2
) as follows:
d(c
1
,c
2
) = max
θ
(|c
1
(θ) − c
2
(θ)|)
We can now extract representative contours us-
ing the penalization technique previously presented
with no need to use forbidden bands of pixels but
skipping contours that are too close from each other.
This is done iteratively by discarding all the contours
whose distance with the former representativecontour
is less or equal to a given threshold. This approach al-
lows modeling uncertainty and produces contours that
are not nested but that exhibit differences for at least
few points. Segmentation results obtained with this
method are presented in Section 5.
FUZZY SEGMENTATION OF MASSES IN DIGITAL BREAST TOMOSYNTHESIS IMAGES BASED ON DYNAMIC
PROGRAMMING
9
4.4 Extraction of Several Fuzzy
Contours
In order to capture both uncertainty and imprecision
contained in a given image, we can combine the band
penalization and the distance-based approaches. Ob-
viously, we can extract for each contour c obtained
with the second approach, a fuzzy contour by apply-
ing the first method on a matrix M
′
= M where the
path c is set to ∞ on a large band. Doing this enables
us to have a set (uncertainty) of nested contours (im-
precision).
4.5 Membership Degree
To complete the extraction of fuzzy contours, we need
to assign a membership degree to each contour consti-
tuting the fuzzy set. This membership degree should
be representative of the confidence we can have in the
contour.
The dynamic programming algorithm provides us
with a direct measurement of confidence linked to the
values of the gradient along the contour and its gray
levels: the total cost of the path (C ). This cost can be
used to derive a membership value for the contour if
we normalize it considering the whole set of contours
obtained for an image. For instance, if we obtain n
contours with the associated costs C
i
,i ∈ [[1;n]], we
can define the membership degree µ
i
as follows:
µ
i
=
C
max
−C
i
C
max
−C
min
(1)
where C
max
and C
min
are max
i
{C
i
} and min
i
{C
i
}, re-
spectively. Thus, we get a value ranging between 0
and 1, with 1 being the smallest cost (hence highest
membership value) and 0 being the highest cost.
Another type of membership degree can be de-
fined. Since we extract a lot of contours to construct
a pool from which we extract the contour with the
distance method, we are able to create a map of con-
tours density. Each time a path is derived in polar
coordinates (in the cost matrix), we set to 1 the corre-
sponding pixels in the contour map. A pixel cannot be
crossed twice because of the penalization. So, we ob-
tain a map as represented in Figure 3(a). By averaging
the image vertically with a Gaussian filter, we obtain
a blurred version as represented in Figure 3(b). This
step allows us to take into account the spatial den-
sity of the contours, thus the resulting density map is
representative of the possibility of having a contour
crossing given pixels. Summing up the values of the
density map D along a path enables us to obtain a rep-
resentative value of the confidence we can have in the
contour. The higher this value, the more confident we
can be in the contour. This total density can also be
normalized to create a membership degree:
µ
′
i
=
min
c
′
∈C
θ
max
∑
θ=0
D(θ,c
′
(θ)) −
θ
max
∑
θ=0
D(θ,c
i
(θ))
max
c
′
∈C
θ
max
∑
θ=0
D(θ,c
′
(θ)) − min
c
′
∈C
θ
max
∑
θ=0
D(θ,c
′
(θ))
(2)
with C the set of extracted contours and c
i
the consid-
ered contour.
The behavior of both approaches will be discussed
in Section 5.
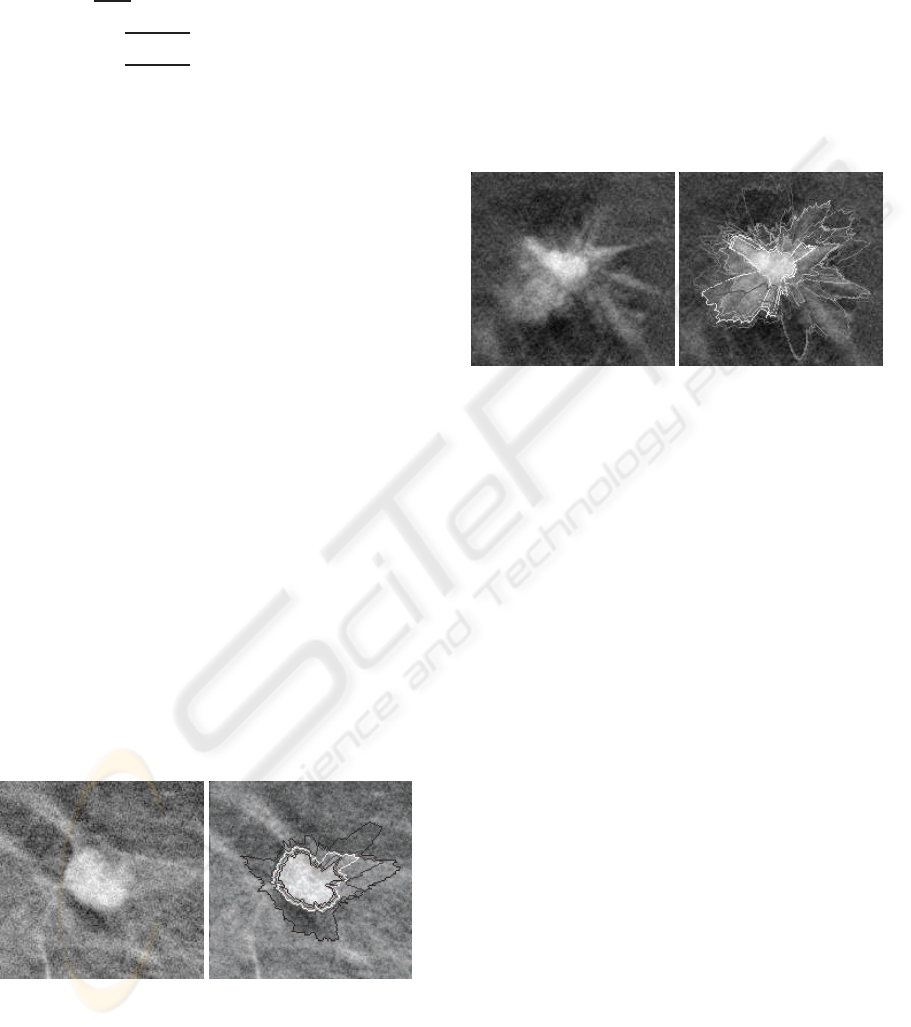
(a)
(b)
Figure 3: Computation of a contour density map. (a) Con-
tour map extracted from an image. 100 contours have been
marked on the image. (b) Density map after smoothing.
5 RESULTS
The database we used for evaluation contains 52 re-
gions of interest extracted from DBT slices. Sixteen
of them contain a circumscribed mass, while remain-
ing ones contain a spiculated lesion. The algorithm
was first validated on these images for crisp segmen-
tation. The results are presented in Section 5.1. In
Section 5.2 we interpret the results obtained with our
new fuzzy segmentation approach. We focus on the
results obtained with both the penalization and the
distance and discuss the combination of the two ap-
proaches. Finally we compare the two ways of con-
structing membership degrees.
5.1 Crisp Segmentation on DBT Slices
In order to validate the approach, we performed an
assessment of the crisp approach on two subsets of
IMAGAPP 2010 - International Conference on Imaging Theory and Applications
10
lesions (spiculated and circumscribed). This assess-
ment was done using ground truth contours built by a
human reader and a criterion P, which is the average
of 3 measures (Rojas and Nandi, 2007):
P
1
=
|A∩R|
|A∪R|
similarity
P
2
= 1 −
|R\(A∩R)|
|R|
under-segmentation
P
3
= 1 −
|A\(A∩R)|
|A|
over-segmentation
where R and A are the reference contour and the one
to be evaluated, respectively.
The evaluation was done using the leave-one-out
method in order to learn without bias the algorithm
parameters. The best results were obtained for the
segmentation of circumscribed lesion with a learn-
ing step using the same type of lesions (P = 0.87).
The performance obtained for spiculated lesions with
a learning step using the same population was a bit
lower (P = 0.71). Finally testing the approach on cir-
cumscribed lesions while learning on spiculated data
results in a small performance decrease compared to
the ideal case.
5.2 Fuzzy Segmentation
Figure 4 illustrates an example of contour extraction
using the penalization of a band on each side of the
contours to force them to be nested. Let us notice
that three of the contours are really close to each
other. This could be interesting because this models
the imprecision we have on the edges. Let us also
remark that it may be interesting to get a common
portion between several contours since imprecision
may take place only in a part of the lesion. Unfor-
tunately, the penalization method prevents such a be-
havior. Nonetheless, with a high enough radius quan-
tization step in the polar domain, the obtained con-
tours can be close enough to finally overlap when ex-
pressed in the Cartesian domain.
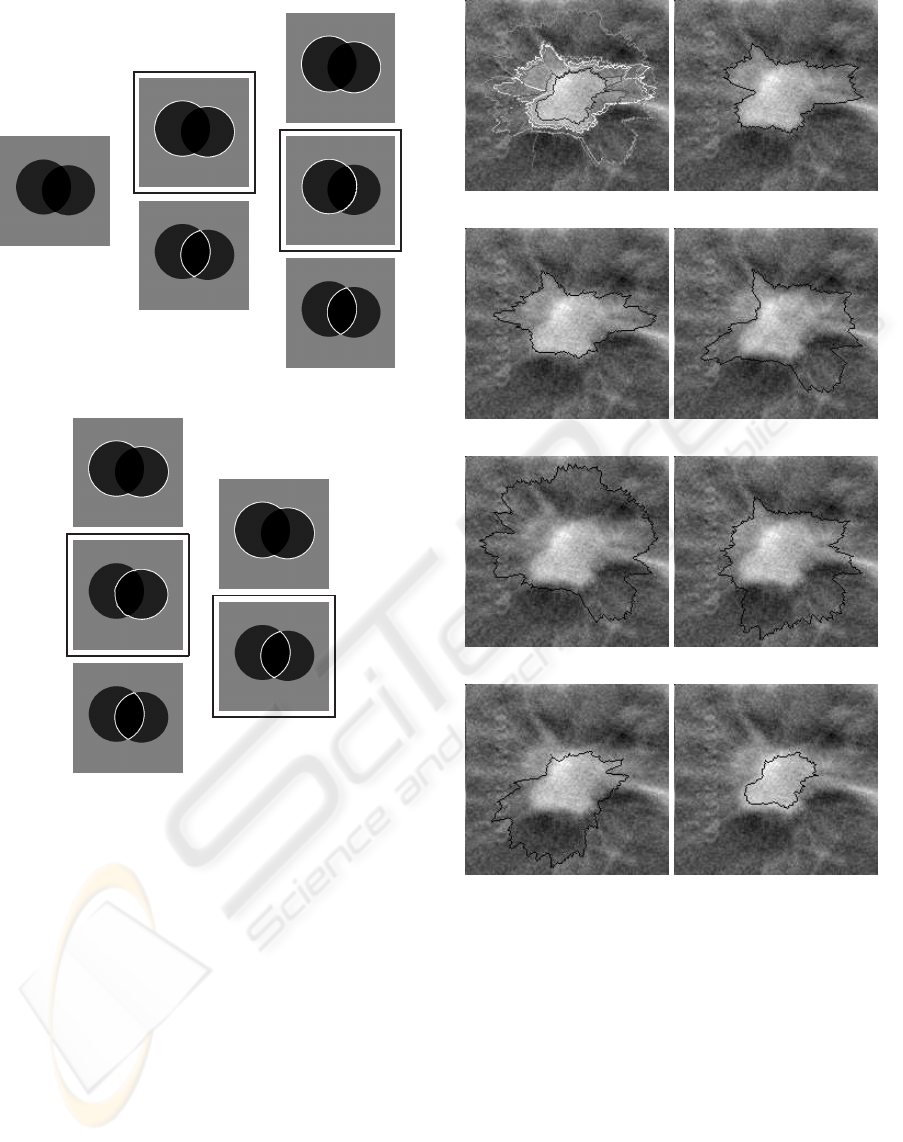
(a) (b)
Figure 4: Fuzzy segmentation (b) of a cicumscribed le-
sion (a) using the penalization method.
We now present the results obtained using the
distance-based contour selection method. Figure 5 il-
lustrates a clinical example with contours extracted
using the distance method. As we can see, the ad-
vantage of this method is that it captures the uncer-
tainty: there is a lot of variations in the proposed con-
tours. Let us remark that most of these contours make
sense according to the lesion to segment. Nonetheless
some are less likely to represent the lesion. However
this is not an issue if we can associate those contours
with a low membership degree. In this example, the
gray levels of the contours are proportional to their
membership degree: the lower the membership de-
gree (contour gray levels), the less possible the con-
tour.
(a) (b)
Figure 5: Fuzzy segmentation (b) of a spiculated lesion (a)
using the distance-based contour selection method.
Figure 6 shows how the fuzzy contours extraction
method relying on the two contours selection method
performs on a synthetic image. The distance based
method allows retrieving four contours representing
the uncertainty in the image. Those contours appear
in black boxes, corresponding to the two disks, their
union and intersection. For each of those contours, a
set of nested contours is then extracted using the band
penalization method allowing to build a fuzzy con-
tour. Here we have 4 fuzzy contours in Figure 6(b),
6(c), 6(d) and 6(e). Note that for the sake of clar-
ity, slight variations of the presented contours (part of
the imprecision) that are also extracted are not shown.
Let us also remark that fuzzy contours 6(b) and 6(e)
are almost the same. Such a redundancy may ap-
pear because we want to extract as much main con-
tours as possible in the first stage. Nonetheless such
a behavior should not be a problem in real applica-
tions like automatic detection/characterization of can-
cer because no information is discarded.
5.3 Comments on the Membership
Degree Definition
The comparison between the two techniques of mem-
bership degree computation is illustrated in Figures 7
and 8. These figures present the ranking of the con-
tours in a fuzzy contour according to their member-
ship degrees. It is interesting to notice the position of
FUZZY SEGMENTATION OF MASSES IN DIGITAL BREAST TOMOSYNTHESIS IMAGES BASED ON DYNAMIC
PROGRAMMING
11
(a) (b) (c)
(d) (e)
Figure 6: Fuzzy contours extraction. (a) Synthetic image
to segment. (b) First fuzzy contour. (c) Second fuzzy con-
tour. (d) Third fuzzy contour. (e) Fourth fuzzy contour. For
each sub-figure, the black box designates the main contour
retrieved by the distance based method, while the remaining
contours constitute the fuzzy contour.
the smallest contour correspondingto the kernel of the
lesion. When we use Equation 1 to compute the mem-
bership degrees, this contour is the worst one while
when Equation 2 is used, this contour is the best. Ac-
tually, the membership degrees of the three best con-
tours according to Equation 2 are almost the same,
which is coherent with the visual quality of these con-
tours. Let us also remark that this method could still
be improved because the second and third contours
may appear more relevant, but again since the dif-
ference between the membership degrees is low, this
would be a minor improvement.
(a) (b)
(c) (d)
(e) (f)
(g) (h)
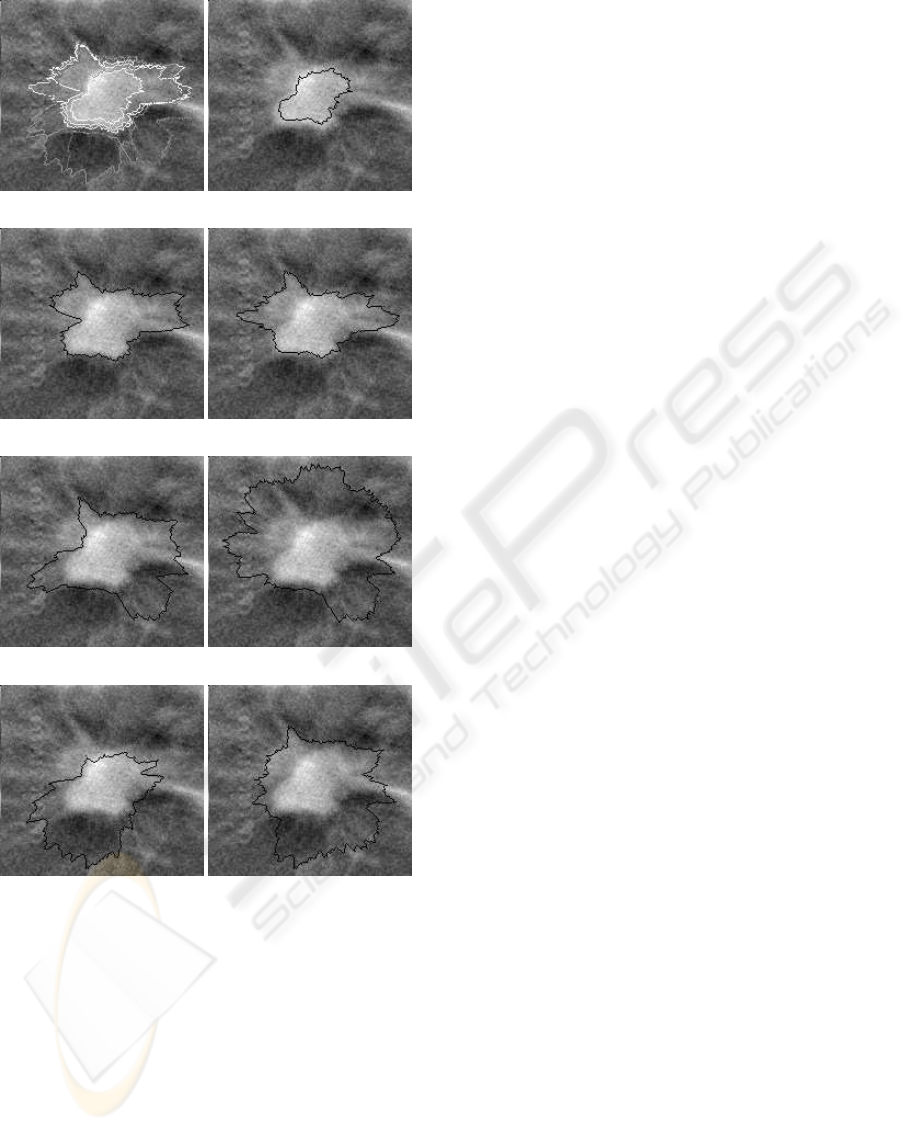
Figure 7: Membership degree computation using Equa-
tion 1. (a) Fuzzy contour to be considered. The remain-
ing images are ranked in decreasing order according to the
membership degree of the contour they contain. Due to this
ranking, the first contour also corresponds to the result of a
crisp segmentation.
6 CONCLUSIONS
We have proposed a new technique to extract fuzzy
contours from images containing breast masses. This
method relies on previous works that model a contour
as a path in the image to segment, which has been
converted in the polar domain (Timp and Karssemei-
IMAGAPP 2010 - International Conference on Imaging Theory and Applications
12
(a) (b)
(c) (d)
(e) (f)
(g) (h)
Figure 8: Membership degree computation using Equa-
tion 2. (a) Fuzzy contour to be considered. The remain-
ing images are ranked in decreasing order according to the
membership degree of the contour they contain.
jer, 2004; Rojas and Nandi, 2007). We extended this
method in order to capture imprecision as well as un-
certainty of lesions in mammography images or DBT
slices. This is performed through two distinct contour
extraction schemes, which we finally combine in or-
der to get several fuzzy contours for a given structure
to be segmented.
We also proposed a new technique to compute the
membership degree of each contour contained in a
fuzzy contour. This approach relies on the idea that
location where we can extract a lot of contours are
likely to represent good contours. Using a contour
density map, we thus derived a way to compute such
degrees.
Because building a ground truth database for
fuzzy contours is a pretty difficult task, as of today we
only evaluated our approach visually on the lesions of
our whole database. One next step may be to work
with clinical experts to review images in order to get
several contours for these lesions. Of course to be rel-
evant all the segmentations for each lesion should be
performed independently.
REFERENCES
Bothorel, S., Bouchon Meunier, B., and Muller, S. (1997).
A fuzzy logic based approach for semiological analy-
sis of microcalcifications in mammographic images.
International Journal of Intelligent Systems, 12(11-
12):819–848.
Dobbins III, J. T. and Godfrey, D. J. (2003). Digital X-ray
tomosynthesis: current state of the art and clinical po-
tential. Physics in Medicine and Biology, 48(19):R65–
R106.
Gennaro, G., Baldan, E., Bezzon, E., Grassa, M. L.,
Pescarini, L., and di Maggio, C. (2008). Clini-
cal performance of digital breast tomosynthesis ver-
sus full-field digital mammography: Preliminary re-
sults. In International Workshop on Digital Mammog-
raphy (IWDM), pages 477–482, Berlin, Heidelberg.
Springer-Verlag.
Osher, S. J. and Fedkiw, R. (2002). Level Set Methods and
Dynamic Implicit Surfaces. Springer.
Palma, G., Peters, G., Muller, S., and Bloch, I. (2008).
Masses classification using fuzzy active contours and
fuzzy decision trees. In SPIE Symposium on Medical
Imaging, number 6915, pages 691509.1–691509.11,
San Diego, CA, USA.
Peters, G. (2007). Computer-aided Detection for Digital
Breast Tomosynthesis. PhD thesis, Ecole Nationale
Sup´erieure des T´el´ecommunications.
Rojas, A. and Nandi, A. K. (2007). Improved dynamic-
programming-based algorithms for segmentation of
masses in mammograms. Medical Physics, 34:4256–
4269.
Timp, S. and Karssemeijer, N. (2004). A new 2D segmenta-
tion method based on dynamic programming applied
to computer aided detection in mammography. Medi-
cal Physics, 31:958–971.
Wu, T., Stewart, A., Stanton, M., McCauley, T., Phillips,
W., Kopans, D. B., Moore, R. H., Eberhard, J. W.,
Opsahl-Ong, B., Niklason, L., and Williams, M. B.
(2003). Tomographic mammography using a lim-
ited number of low-dose cone-beam projection im-
ages. Medical Physics, 30(3):365–380.
FUZZY SEGMENTATION OF MASSES IN DIGITAL BREAST TOMOSYNTHESIS IMAGES BASED ON DYNAMIC
PROGRAMMING
13
