
3D INSPECTION SYSTEM IN CERAMIC TILES SURFACES WITH
RANGE IMAGES
G. Pab
´
on-Rodr
´
ıguez, G. Andreu-Garc
´
ıa, A. Rodas-Jord
´
a
J. Valiente-Gonz
´
alez and F. Acebr
´
on-Linuesa
Computer Vision Group, Universidad Polit
´
ecnica de Valencia, Spain
Keywords:
Surface inspection, Computer vision system, 3D defect detection, Quality control, Range images.
Abstract:
In this paper we propose a system to characterize 3D defects of range images, which can be combined with
traditional surface inspection methods in an industrial environment for ceramic tiles inspection. Our applica-
tion has the advantage of learning the geometric features of the ceramic pieces, creating a unique 3D model
against which we compare the test pieces. In addition to this, the system includes a robust learning phase,
which discards tiles with defects impossible to see from a human expert and a more stringent inspection in
areas with low uncertainty. Experiments with real data were performed. Our data consist of tiles of different
types, shapes and silk-screen of ceramic tiles. Results are promising for tiles with a straight orientation, over
99 % of defects are correctly classified.
1 INTRODUCTION
This paper is concerned with the problem of auto-
matic inspection of ceramic tiles using computer vi-
sion. Our objective is to propose a suitable vision sys-
tem to detect and quantifier topographic surface de-
fects in tiles with nonplanar surfaces, irregular shapes
and glazed surfaces.
Decorative ceramic tile are manufactured in vast
quantities. According to (Smith, 2000) a large
range of tile designs are currently produced. These
tiles can have different shapes varying from conven-
tional simple planar designs to highly complex three-
dimensional forms and, in finish, from uniform color
to irregular pseudo-random designs or natural random
patterns typical of polished stone.
Most of ceramic tile automated inspection system
have predominantly been aimed at the inspection of
planar tile surfaces of uniform colouring. The de-
tection of defects in the case of nonplanar tiles or
tiles with pseudo-random patterns is more complex.
In (Boukouvalas et al., 1995) a successful applica-
tion of various image analysis techniques for the in-
spection of uniform planar tiles is described. In the
case of more complex patterned planar tile designs,
an off-line training stage has been proposed in or-
der to detect in both regular and random patterns.
However, such an approach is not able to explicitly
distinguish three-dimensional topographic, from two-
dimensional chromatic defects.
An automatic system to inspect and classify ce-
ramic tiles according to the integrity defects at the tile
corners is described in (Valiente et al., 1998). The
system detects the lack of material in the corner of
the tile basing on the differences of color among the
zone damaged and the remainder of tile, but if the
zone where there is a lack of material has been col-
ored the system does not work correctly.
Almost all the methods revised, like (Boukouvalas
et al., 1999), (Boukouvalas and Petrou, 2000), (L
´
opez
et al., 2001) and (L
´
opez et al., 2005) detect chro-
matic defects but not topographical ones. In (Smith,
2000) a technique that is able to isolated mixed topo-
graphic and chromatic surface features has been de-
veloped. They proposed a photometric stereo tech-
nique for the acquisition of quality data in the inspec-
tion of ceramic tiles, possessing both topographic and
albedo features. The method is able to separate a sur-
face topographic description from a coincident albedo
pattern. In the paper does not expose any method to
quantify the defects.
Our goal is to propose a suitable computer vision
system to detect and obtain measures of magnitude
of topographic surface defects. The system has to
inspect all the surface and to work with nonplanar
surfaces, irregular shapes and glazed surfaces. The
system has to offer solutions that can be used in real
world, this is in ceramic industry. A supervised ap-
158
Pabón Rodríguez G., Andreu-García G., Rodas-Jordá A., Valiente-González J. and Acebrón-Linuesa F. (2010).
3D INSPECTION SYSTEM IN CERAMIC TILES SURFACES WITH RANGE IMAGES.
In Proceedings of the International Conference on Computer Vision Theory and Applications, pages 158-163
DOI: 10.5220/0002827101580163
Copyright
c
SciTePress
proach to classifier requires a great number of defec-
tive samples, which can be difficult to obtain. So we
need to implement an inspection method based only
in good samples for training purpose. Contrary to
supervised classification novelty detection only need
normal samples. With novelty detection method the
system will have the advantage of being able to detect
new types of defects that were unknown at the time of
training.
In our proposed, a pattern 3D is obtained to each
tile model with uncertainly criterion that permit tak-
ing account the real inaccuracy in tile manufacturing.
Edge detection, matching and image registration tech-
niques to align tiles are used. Finally generates a 3D
pattern of a defect-free ceramic tile and via novelty
detection the defects are identified. Experiments with
commercial tiles show the good system performance.
2 ACQUISITION ENVIRONMENT
The surface inspection requires acquiring images that
are more suitable than the human visual perception.
Range images are a special class of digital images. A
range image reproduces the 3D structure of a scene.
Currently exists a variety of range measuring tech-
nologies to acquire 3D information about our world.
Laser range scanners can provide extremely accurate
and dense 3D measurement over a large working vol-
ume.
Our acquisition system is located in an opaque box
to not be affected by external light and put together a
commercial acquisition system based in ranger C55
camera, linear laser of 635nm and a conveyor belt.
The ranger C55 can be classified as MultiScan camera
where high speed 3D and gray-scale data are output
according to the line scan method. The object is illu-
minated from a position angle 45 degrees with a laser
line projector and viewed with the camera from a po-
sition on vertical to conveyor belt, see Figure 1. The
Figure 1: Left image represents the acquisition environment
camera, conveyor belt and lineal laser light. In the right
image can see the 3D line projection on tile.
lineal profiles acquired to obtain 3D shapes are based
on the method called laser triangulation. Ranger C55
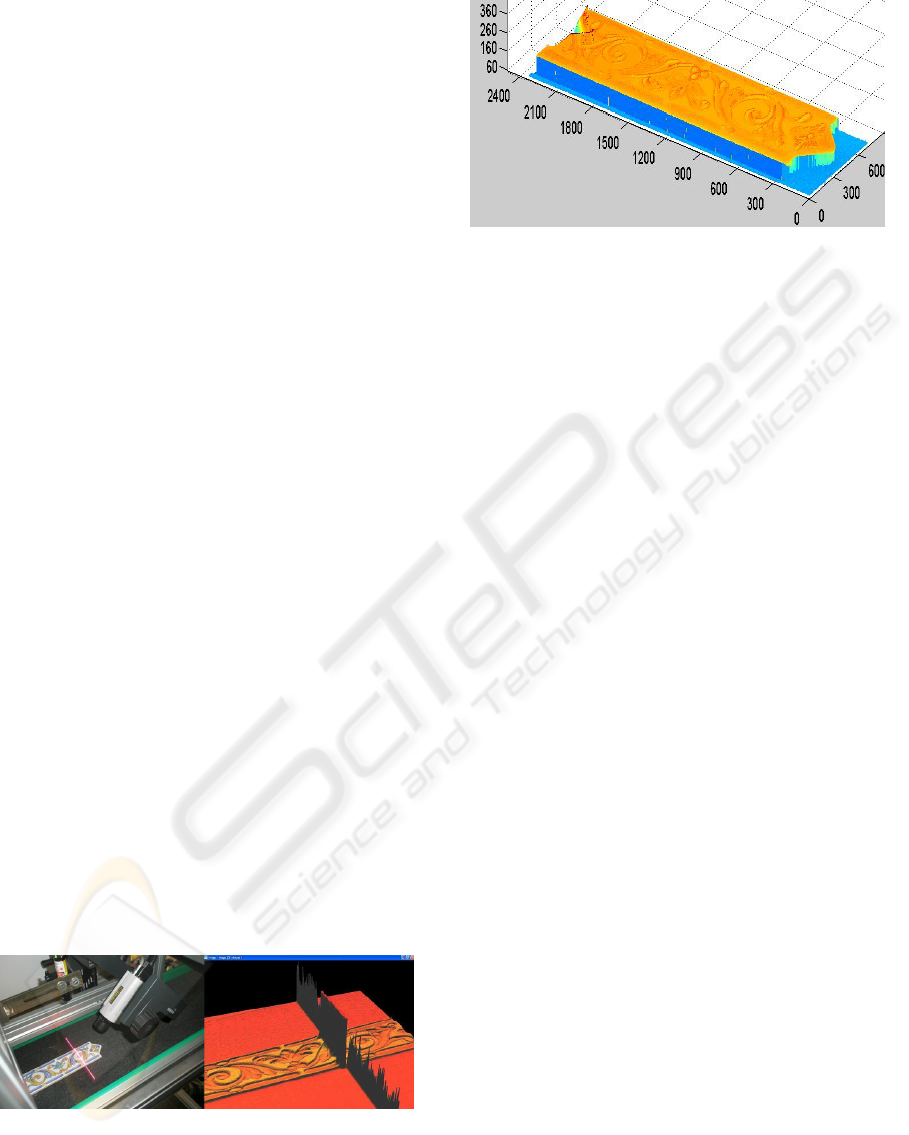
Figure 2: Example of 3D image tile obtained with our envi-
ronment acquisition.
resolution is 1536*512 pixels and can acquired until
35000 profiles per second.
An example of the 3D image tile used in this work
can see in Figure 2. The images used in this work
are acquired while the conveyor belt was working and
with a final resolution of 0.06 mm in the Z direction
(direction vertical to conveyor belt).
3 VISUAL INSPECTION VIA
NOVELTY DETECTION
Supervised classification has been demonstrated as a
powerful approach when both training data and test-
ing data are well-conditioned. However, supervised
approach often involves a lengthy training stage and,
more importantly, it requires a substantial number of
defective samples, which for some applications can
be difficult to obtain.
In a novelty detection task, the classifiers task is
to identify whether an input pattern is part of the data
or it is in fact unknown. As for defect detection, it
involves assigning a normal or abnormal label to a
pattern (e.g. a surface or a pixel). Contrary to su-
pervised classification, novelty detection only needs
the normal samples for training purposes and usually
uses a distance measure and a threshold for decision
making. Recently, (Markou and Singh, 2003) gave a
detailed review of novelty detection approaches, us-
ing statistical and approaches.
Statistical parametric approaches are commonly
used in visual inspection (Xie, 2008). The fundamen-
tal assumption is that the data distribution is Gaus-
sian in nature. Each pattern is usually represented as
a point in a d-dimensional feature space, where d is
the length of the feature vector. The objective is then
to establish decision boundaries in the feature space
and reject patterns that fall in regions of low density.
The decision boundaries are determined by the prob-
ability distribution of the patterns at training stage.
3D INSPECTION SYSTEM IN CERAMIC TILES SURFACES WITH RANGE IMAGES
159

The available performance measure for novelty
detection methods is the probability of false positives
(FP) that is rejection of good samples. Increasing the
acceptance decision boundary will then obviously de-
crease the risk. However, it is also clear that the prob-
ability of false negatives depends on the acceptance
region. In some applications, the decision boundary
is simply set as the maximum range of normal sam-
ples in the training stage.
Figure 3: Uncertainty image U obtained for arrow and apple
models. The darker areas indicate greater uncertainty and
the white area shows the areas marked as smoothing areas
by our system.
3.1 The 3D Tile Pattern
The aim is to obtain a 3D tile pattern with ability to
discriminate defective tiles and accept at the tiles con-
sidered non-defective. All tiles with free surface de-
fects and those tiles with subtle changes on original
design must be considered as non-defective tiles.
The tiles are manufactured automatically and the
ornamental designs are stamped on them with a rel-
ative accurate. Due to this fact there is no a precise
correspondence between points with the same coor-
dinates of two tiles, but most likely if there is cor-
respondence with points in your neighborhood. This
disagreement between regular samples is referred by
us as inter-discrepancy between samples, but it is not
considered as defects.
Another direct consequence of the manufacturing
process is that the material is not distributed with pre-
cisely on the surface. Small differences in the amount
of varnish not affect the quality of tile but if it com-
putes the absolute differences between two tiles then
it could be detected as defects. This fact is referred by
us as intra-discrepancy.
These aspects force us to implemented a pattern
that has account the uncertainly. Only true regular
tiles samples (free-defect) can be used to obtained
a 3D pattern. The use of the window concept and
Neighborhood criteria allow us to successfully ad-
dressing the inter-discrepancy and make an analysis
of how smooth or rough are the decorative designs,
this aspect is necessary to obtain measurements of
the intra-discrepancy. These two aspects are not con-
sidered real defects but inequalities of the production
process.
Let a T
i
range image that represents a tile, it de-
notes by t
i
lk
/t
i
lk
∈ T
i
the profile obtained to pixel with
coordinates (l,k) in the plane (x,y) of the image. Set-
ting a 3 ∗ 3 window pixels, it denotes by N
i
lk
the 8-
nearest neighbor to pixel with coordinate (l, k) in-
cluded itself. For each T
i
one image of intra average
A
i
is computed using a 3 ∗ 3 window, then each ele-
ment a
i
lk
∈ A
i
can be computed as:
A
i
=
a
i
lk
| a
i
lk
=
1
9
∑
(p,q)∈N
i
lk
t
i
lk
(1)
In a similar way, for each T
i
one image of intra max-
imum X
i
and one image of intra minimum M
i
, using
the 3 ∗ 3 window, are obtained as follow:
X
i
=
x
i
lk
| x
i
lk
= max(t
i
pq
| ∀t
i
pq
∈ N
i
lk
)
(2)
M
i
=
m
i
lk
| m
i
lk
= min(t
i
pq
| ∀t
i
pq
∈ N
i
lk
)
(3)
The criterion to detect defect cannot be equal to all
tile surface. In tile regions with smooth decorative el-
ements a severe criterion can be used. But in rough re-
gions, regions with wave or regions with many edges
the criterion has to be smoothing to avoid false detec-
tion. In order to identify the smoothing of the regions
a binary image S
i
will be used to implement the pat-
tern, the elements s
i
lk
∈ S
i
are computed as:
s
i
lk
=
(
1, if
∑
(p,q)∈N
i
lk
(t
i
lk
−t
i
pq
) = 0
0, if
∑
(p,q)∈N
i
lk
(t
i
lk
−t
i
pq
) 6= 0
(4)
The criterion of above expression is: if the 8-
nearest neighbors have the same value then the region
is considered as an homogeneous region. This can see
a very restrictive criterion but is important to be sure
about the variability that is appropriate to tolerate in
each zone tile
Two aspects are taken into account to design the
uncertainly image U; the intra-discrepancy through
theA
i
and A
j
images and la inter-discrepancy through
the S
i
and S
j
images. The images U can be defined
as,
U =
n
u
lk
| u
lk
=
1
n
u
ji
lk
o
(5)
being n the number of true samples selected to com-
pute the uncertainly image and the u
ji
lk
values obtained
as,
u
i j
lk
= max
1≤ j≤n
"
∑
j+1≤i≤n
C(a
j
lk
− a
i
lk
)(s
j
lk
∧ s
i
lk
)
#
(6)
where,
VISAPP 2010 - International Conference on Computer Vision Theory and Applications
160
C(x) =
1, if x = 0
0, if x 6= 0
(7)
The values of the u
i j
lk
pixels represent the amount of
regular tiles that have voted this area as homogeneous.
The uncertainly image U is a measurement about how
many training tiles (without defect) consider that a tile
region is homogeneous. Examples of uncertainty im-
age can see in figure 3, where white area are homoge-
neous region.
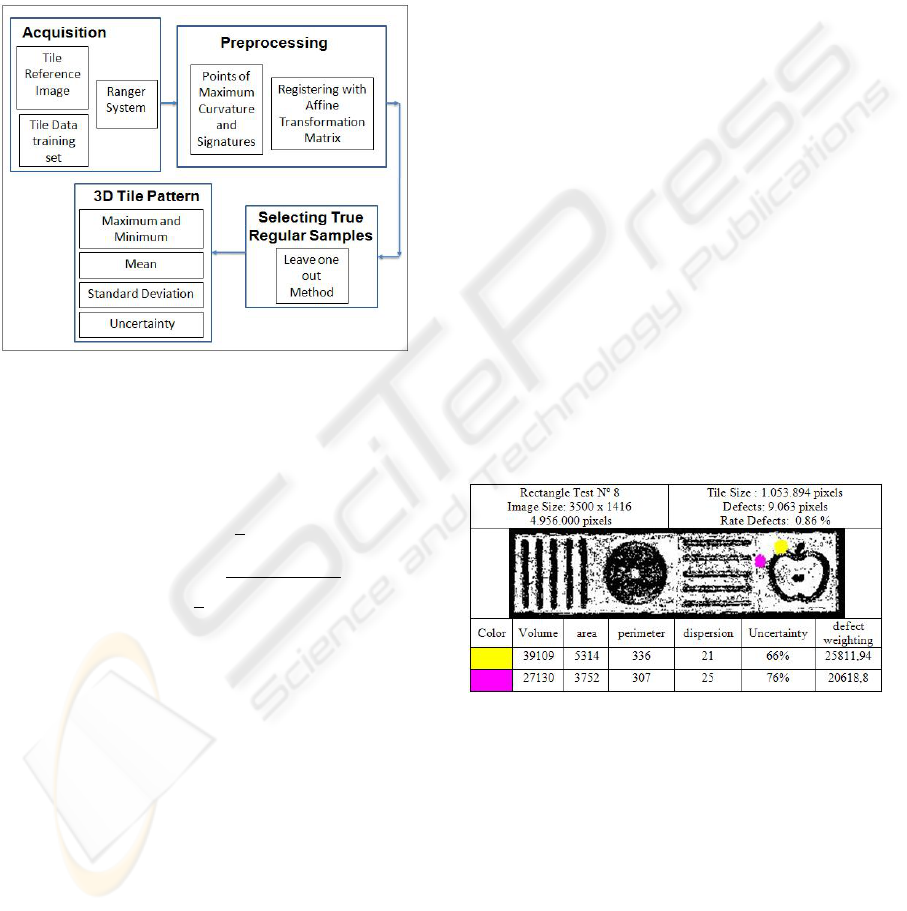
Figure 4: Sequence of steps to obtain 3D pattern Ω.
Let a training set data of tiles and their ranger
image set T = {T
i
}
n
i=1
= {T
1
,··· ,T
n
}, and evalu-
ated the corresponding A
i
,X
i
,M
i
and S
i
, the images
A,D,X and M can be deduced as follow,
A =
(
a
lk
| a
lk
=
1
n
n
∑
i=1
a
i
lk
)
(8)
D =
(
d
lk
| d
lk
=
1
n
s
n
∑
i=1
(a
lk
− a
i
lk
)
2
)
(9)
X =
x
lk
| x
lk
= max
1≤i≤n
(x
i
lk
)
(10)
M =
m
lk
| m
lk
= min
1≤i≤n
(m
i
lk
)
(11)
The Ω pattern can be set as a set of five images
Ω = {A,D,X,M,U} that representing the images of
the average, the deviation standard, the maximum, the
minimum and the uncertainty. The figure 4 shows a
diagram with the steps necessary to obtain the pattern.
An aspect very important is how can be selected the
set tile T appropriated to obtained the Ω pattern.
3.2 Selecting True Regular Samples
A selecting true regular samples process previous to
obtain the pattern is take out. The objective of this
process is to select between the classified tiles as reg-
ular tiles (free-defect) by the human operator that, one
time are evaluated by the vision system, also will be
considered as regular tiles. The tiles that satisfy the
above criterion are referred by us as true regular sam-
ples. Obviously those tiles that are in the final se-
lection are tiles with a minimal inter-discrepancy be-
tween them. The figure 4 shows all the process.
Considering a set T = {T
1
,·· · ,T
m
} of regular
samples candidates to be selected as regular true
samples, a subset of m − 1 pseudo-pattern Ψ =
{Ψ
1
,...,Ψ
m−1
} are obtained where Ψ
i
is computing
using all the samples of the T set except the sample i
in a process of leaving-one-out.
Each Ψ
i
is defined as Ψ
i
= {A
Ψ
i
,D
Ψ
i
} where A
Ψ
i
and D
Ψ
i
are obtained using the expressions (8) and (9)
respectively and with m − 1 samples.
For each sample T
i
a discrepancy map R
i
is ob-
tained using the pseudo-pattern Ψ
i
. The discrepancy
map to R
i
can be deduced as follow:
r
i
lk
=
0, if (a
Ψi
lk
− d
Ψi
lk
) ≤ t
i
lk
≤ (a
Ψi
lk
+ d
Ψi
lk
)
1, in other case
(12)
The pixels with r
i
lk
= 0 are considered no-
disagree. If all the pixels of tile T
i
have been con-
sidered as no disagree then T
i
is a true regular sam-
ples and T
i
will selected to figure up the pattern Ω. In
other case when ∃r
i
lk
∈ R
i
| r
i
lk
6= 0 the T
i
is rejected
to compute the pattern Ω.
Figure 5: A numerical example of different values to esti-
mate the defects.
3.3 Defect Maps
For each test tile a defect maps Θ
i
is obtained using
the pattern Ω = {A,D,X,M,U} defined in previous
sections.
Given T
i
a data test and Ω the 3D tile pattern, the
step in order to obtain the defect maps Θ
i
is as follow:
Step1. Compute A
i
,X
i
, and M
i
, applying (8), (10)
and ( 11).
Step 2. Estimate R
i
from A
i
and D
i
, applying (12).
Step 3. Calculate θ
i
lk
∈ Θ
i
as follow:
3D INSPECTION SYSTEM IN CERAMIC TILES SURFACES WITH RANGE IMAGES
161
θ
i
lk
=
0, if m
i
lk
≤ t
i
lk
≤ x
i
lk
r
i
lk
(x
i
lk
−t
i
lk
), if t
i
lk
> x
i
lk
r
i
lk
(m
i
lk
−t
i
lk
), if t
i
lk
< m
i
lk
(13)
Then Θ
i
is an image than contain pixels to zero and
pixels greater than zero. The pixels θ
i
lk
∈ Θ
i
are pixels
defects free if θ
i
lk
= 0, in other case, the pixels with
θ
i
lk
> 0 are pixel with defects and the positive value is
the first approximation to quantify the defect.
Obtained Θ
i
the image U is used to weigh the de-
fects. The aim is that small values in Θ
i
are very sig-
nificant if its on smoothing area and on rough area
only big values are considered as defect. In this sense
the image U is considered with an image of weights.
To remove noise in Θ
i
a morphological operator
was applied, with a disk shape of radius 5 pixels as
structuring element. Finally the defect pixels are clus-
tered with criterion of 8-connected pixels and a mea-
surement about the defect area is obtained. An exam-
ple of this region is shown in figure 5. Considering
this area, and the profiles of pixels inside of area, a
measurement of volume of defects is estimated. Us-
ing the measurement of volume and area and the im-
age U different criteria to quantify and to classify the
defects can be thought out.
4 EXPERIMENTS AND RESULTS
For the experiments was necessary to set up an image
database based on real samples from the tile indus-
try. We have used in our experiment a data set of 210
tiles extracted directly from the factory, the produc-
tion line, so we work with real data and real defects.
The database is comprised by two model named for
us ”arrow” and ”apple”, see figure 6. We considered
these two models appropriate to test our proposal, be-
cause its have different forms and contain on its sur-
face as smooth as rough areas.
Table 1: Composition and distribution of tiles in the
database used in the experiments.
Tile Pattern Test free Test with Total
Model tiles defect defect tile
Arrow 13 35 63 111
Apple 8 31 60 99
For each tile model, arrow and apple, a process of
selecting true regular samples was carried out, as is
described in section 3.2. Table 1 shows the tile distri-
bution for each model in database, in this table can see
a total of 111 arrow tiles and 99 apple tiles was used.
At the beginner of the selecting process 15 free defect
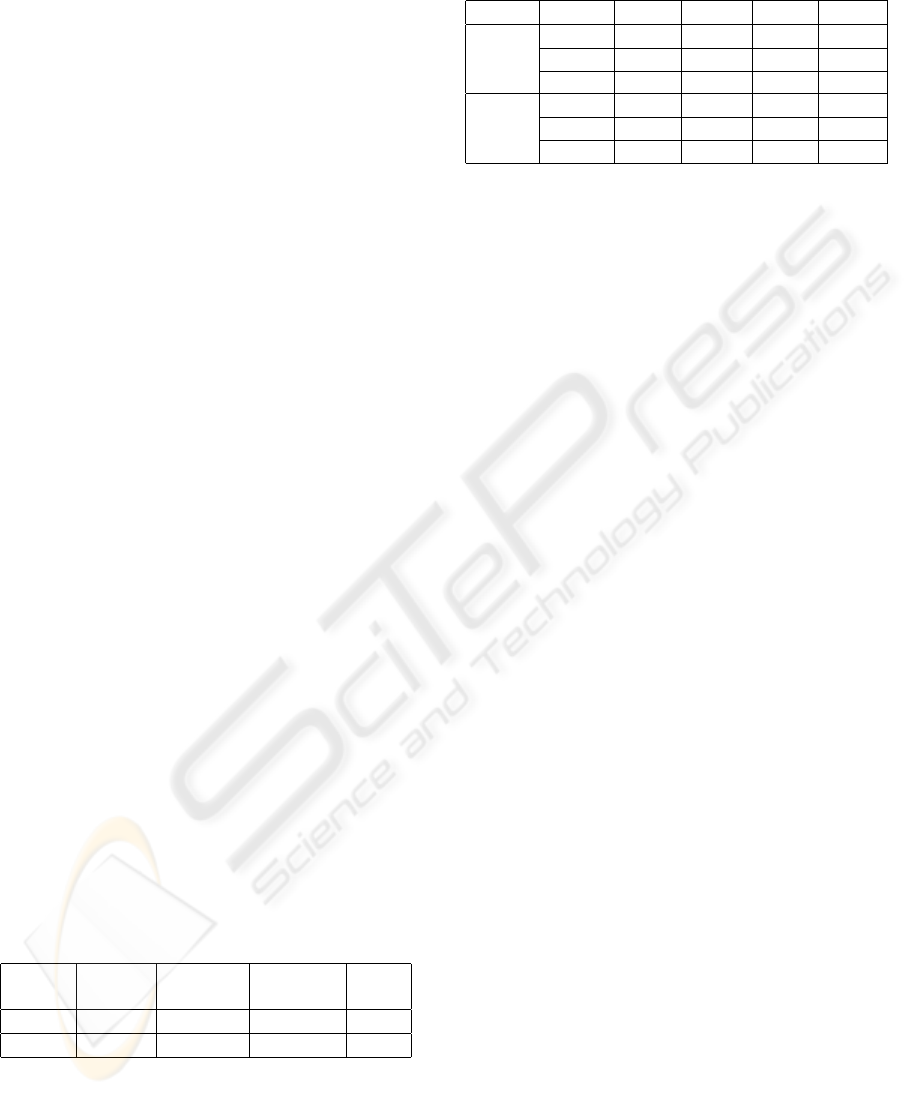
Table 2: Summary result.
Tile degree TP % TN % FP % FN %
0
◦
100 98.4 0 1.6
Arrow 10
◦
97.9 95.2 2.1 4.8
−10
◦
100 95.2 0 4.8
0
◦
100 100 0 0
Apple 10
◦
89.7 96.7 10.3 3.3
−10
◦
94.8 93.3 5.2 6.7
tiles was candidate to obtain the the 3D pattern but
after of the selecting process only 13 arrow tiles and
8 apple tiles were used to compute the pattern Ω the
other free defect tiles was used to test the system. The
defect of test samples was lumps, depressions,orange
peel, material lack and too varnish.
Three different orientations were taken into ac-
count to do the experiments: i) 0 degree, this is the
best position to acquire images during the test and
implies that the tiles will be placed on the conveyor
belt completely parallel to the bands. ii) 10 degree,
this implies that the tiles it is placed an angle α to the
central of belt such that 0 < α ≤ 10. iii) -10 degree,
this implies that the tiles it is placed an angle α to the
central of belt such that 0 > α ≥ −10.
In all stage of the process three orientation was
taken into account for thus, pattern Ω will be pro-
jected to three orientations so three different patterns
were obtained for each model Ω
10
◦
, Ω
0
◦
and Ω
−10
◦
and all the test on the tiles were repeat for each ori-
entation. During the test process the system select
automatically the pattern with the more appropriate
orientation have account the orientation of test data.
The increment of FP and FN in the rotated tiles
are due to greater deformation that is produced at the
laser line in capture stage.
All test pieces were successfully tested by the sys-
tem; the results were summarized in table 2. In test
stage, for each tile it image is acquired and the pro-
cessing steps represented in figure 4 are made as fol-
low:
i) The tile contour (signature) is computed in order
to find differences between the angles of the test im-
ages and pattern tiles. The maximum curvature points
are control points to generate a transformation matrix
and determine the correspondence between the test
tile points and the three pattern of model.
ii) Knowing the coordinates of a set points in the
test tile image, an affine transformation (Gottesfeld,
1992) is determined to re sample the geometry of the
test tile image.
A detailed performance is showed in Table 2
where the detection rate for each model is presented
as: true positives (TP), false positives (FP), true neg-
VISAPP 2010 - International Conference on Computer Vision Theory and Applications
162

Figure 6: From left to right: Original tiles, Range images and Defect marked on uncertainty image.
atives (TN) and false negatives (FN). This approach
keeps the success rate on expected levels, but de-
creases to 94% when test tiles is rotated. The weight
factor of a defect increases when its position is be-
tween areas of high and low uncertainty, see figure 5.
Our proposed approach add the quantification of
detected defects in contrast to other systems e.g.
(Smith, 2000). We achieved our goal inspecting the
entire surface of tiles and to work with no planar sur-
faces, irregular shapes and glossy or glazed surfaces.
The proposed system has a final resolution of 0.06
mm in the Z direction. This extracts a set of features:
quantity of defective pixels tile, centroid, bounding
box, area, volume, perimeter, confidence measure,
and dispersion each tile defect. Also, it can detect
silk-screened defects because the color affects some
depth measurement. Experiments with commercial
pieces show reconstruction errors caused by the com-
bination of color and varnish.
5 CONCLUSIONS
A system for industrial inspection of ceramic tiles is
presented, showing a sophisticated inspection strat-
egy, with promising results. The proposed algorithm
use range images, to improve small defects detection
so difficult to see for human eyes.
Our algorithm is aimed to characterize 3D de-
fects of range images with novelty detection tasks,
which that only needs the normal samples for train-
ing purposes and usually uses a distance measure and
a threshold for decision making. We tested success-
fully the algorithm in some orientations with test tiles
from different shapes and textures. With novelty de-
tection method the system will have the advantage of
being able to detect new defects that were unknown at
the time of training.
Our future efforts: improve the response of the al-
gorithm about color, shadows, brightness effects and
time response time. This will include a stage that au-
tomatically corrects the false measurements deep in
the 3D reconstruction.
ACKNOWLEDGEMENTS
This work has been supported partially by research
project DPI2007-51166596-C02-01 (VISTAC).
REFERENCES
Boukouvalas, C., Kittler, J., Marik, R., Mirmehdi, M., and
Petrou, M. (1995). Ceramic tile inspection for color
and structural defects. In Proceedings of AMPT95.
pages 390–399.
Boukouvalas, C., Kittler, J., Marik, R., and Petrou, M.
(1999). Color grading of randomly textured ceramic
tiles using color histograms. In IEEE Transactions on
Industry Electronics. pages 219–226.
Boukouvalas, C. and Petrou, M. (2000). Perceptual correc-
tion for color grading of random textures. In Machine,
Vision and Applications. pages 129–136.
Gottesfeld, L. (1992). A survey of image registration tech-
niques. ACM Computing Surveys. pages 327–376.
L
´
opez, F., Acebr
´
on, F., Valiente, J., , and Perez, E. (2001). A
study of registration methods for ceramic tile inspec-
tion purposes. In Proc. of the IX Spanish Symposium
on Pattern Recognition and Image Analysis. pages
145–150.
L
´
opez, F., Valiente, J., Baldrich, R., and Vanrell, M. (2005).
Fast surface grading using color statistics in the CIE
Lab space. In Iberian Conference on Pattern Recogni-
tion and Image Analysis. In LNCS 3523. pages 666–
673.
Markou, M. and Singh, S. (2003). Novelty detection: a
review - part 1: statistical approaches. In Signal Pro-
cessing 83. pages 2481–2497.
Smith, M., S. R. (2000). Automated inspection of textured
ceramic tiles. In Computers in Industry 43. pages 73–
82.
Valiente, J., Acebr
´
on, F., and L
´
opez, F. (1998). An Au-
tomatic Visual Inspection System for Ceramic Tile
Manufacturing Defects. In Proc.. IASTED Int. Conf.
on Signal Processing and Communications. pages
257–260.
Xie, X. (2008). A Review of Recent Advances in Surface
Defect Detection using Texture analysis Techniques.
In Electronic Letters on Computer Vision and Image
Analysis. pages 1–22.
3D INSPECTION SYSTEM IN CERAMIC TILES SURFACES WITH RANGE IMAGES
163
