
MOTION SEGMENTATION OF ARTICULATED STRUCTURES BY
INTEGRATION OF VISUAL PERCEPTION CRITERIA
Hildegard Kuehne and Annika Woerner
Institute for Anthropomatics, Karlsruhe Institute of Technology, Kaiserstr. 12, Karlsruhe, Germany
Keywords:
Motion segmentation, Articulated body tracking, Motion recognition.
Abstract:
The correct segmentation of articulated motion is an important factor to extract and understand the functional
structures of complex, articulated objects. Segmenting such body motion without additional appearance infor-
mation is still a challenging task, because articulated objects as e.g. the human body are mainly based on fine,
connected structures. The proposed approach combines consensus based motion segmentation with biological
inspired visual perception criteria. This allows the grouping of sparse, dependent moving features points into
several clusters, representing the rigid elements of an articulated structure. It is shown how geometric and
time-based feature properties can be used to improve the result of motion segmentation in this context. We
evaluated our algorithm on artificial as well as natural video sequences in order to segment the motion of
human body elements. The results of the evaluation of parameter influences and also the practical evaluation
show, that good motion segmentation can be achieved by this approach.
1 INTRODUCTION
The recovery of articulated structures from moving
elements is one of the main abilities of the human per-
ception system. In this context segmentation of artic-
ulated motion is an important factorto recognize com-
plex motion and to understand the underlying func-
tional structures.
Biological vision systems are able to understand
complex structures from only few motion informa-
tion. Just by seeing some moving features, we are
able to understand the structure of the moving object
and to recognize the perceived motion. One crucial
step in this context is the correct grouping of motion
information, in order to identify elements that are as-
sumed to represent a rigid object, and to use this in-
formation to combine the motion elements for higher
level recognition processes. An example for this has
been given by Johansson’s moving light displays (Jo-
hansson, 1973). The understanding of these biolog-
ical mechanisms is still an open problem in neuro-
science, but its importance for any vision system be-
comes increasingly clear and the work on this subject
is still going on as can be seen e.g. at Giese and Pog-
gio (Giese and Poggio, 2003).
Common motion segmentation algorithms are
usually to unspecific to keep up with the abilities of
biological vision systems. Many motion segmenta-
tion approaches are dealing with object tracking or
scene understanding, so they are focused on the seg-
mentation of compact, independent moving objects.
When it comes to the handling of dependent motions
of thin elements with only few data points as e.g. in
gesture recognition, they will usually fail.
One step towards the segmentation of these struc-
tures could be the combination of well know consen-
sus based motion segmentation with the constrains
and connectivity rules of biological vision system. It
is well known, that the visual perception usually fol-
lows a system of principles for the grouping of sta-
tionary and moving elements what has been described
e.g. by Ullman (Ullman, 1983). Using these princi-
ples, we usually get a fast accurate guess about our
environment.
In the here presented approach, a RANdom SAm-
ple Consensus (RANSAC) algorithm is used to com-
bine geometric criteria e.g. the affine projection of
motion features with biological inspired constrains
like center of mass distance, distance from main axis
or motion vector distance to group sparse, dependent
moving features to clusters, representing the rigid el-
ements of articulated structures. It is shown how geo-
metric and time-based feature properties can be used
to improvethe result of motion segmentation and help
to overcome common problems in this context.
54
Kuehne H. and Woerner A. (2010).
MOTION SEGMENTATION OF ARTICULATED STRUCTURES BY INTEGRATION OF VISUAL PERCEPTION CRITERIA.
In Proceedings of the International Conference on Computer Vision Theory and Applications, pages 54-59
DOI: 10.5220/0002829900540059
Copyright
c
SciTePress

2 RELATED WORK
As motion segmentation is a broad field with appli-
cations in a lot of different contexts, we want to re-
strict the following overview to methods dealing with
the clustering and grouping of feature points based on
motion information.
A survey of common motion segmentation algo-
rithms has been given by Tron and Vidal(Tron and
Vidal, 2007). The main algorithms are explained and
their performance is compared based on the results
obtained with a benchmark set. The strengths and
weaknesses of algorithms are also discussed here.
An example for RANSAC in context of motion
segmentation is given by Yan and Pollefeys (Yan and
Pollefeys, 2005), using RANSAC with priors to re-
cover articulated structures. The presented algorithm
is tested with a truck sequence with up to four de-
pended moving segments. But motion segmentation
by consensus can also be used to merge already seg-
mented groups. Such an approach is proposed by
Fraile et al. (Fraile et al., 2008). Here, a consensus
method is used to merge feature groups tracked on
video in order to analyze scenes from public transport
surveillance cameras. Another reference is the ap-
proach presented by Pundlik and Birchfield (Pundlik
and Birchfield, 2008) for motion segmentation at any
speed. Here an incremental approach to motion seg-
mentation is used to group feature points by a region-
growing algorithm with an affine motion model.
3 MOTION SEGMENTATION BY
CONSENSUS
One of the most popular applications of the RANSAC
algorithm is probably the stitching of two or more
overlapping images to a panoramic view. This is done
by comparing a lot of different point correspondences
in order to find the set that fits best into a projection
to find the largest group of elements with the most
uniform motion. This makes the algorithm very ac-
curate with a high robustness against outliers. Trans-
lating this idea to the problem of articulated motion
segmentation, we can assume more than one moving
region which can be approximated by different pro-
jection matrices. For a video sequence with articu-
lated body motion it is obvious that there is usually
more than one motion projection. Given a set of 2D
feature points F
n
= f
n
1
,..., f
n
k
at frame n, the aim is to
find all projections P
n
= P
n
1
,...,P
n
l
that approximate
the translations of the feature set from frame n over
the next m frames.
It can be assumed that an articulated motion can
be defined as a set of projections each determining a
set of inliers, which is also called consensus set CS,
so that the projection P
n
i
represents the projection of
the points f
n
CS(i)
over the frames n to n+ m. As there
is also no information about the number of expected
projections, an iterative approach is chosen that does
not need any prior knowledge about the number of
regions but terminates when the largest regions are
found. The iterative random sample consensus works
as follows:
1. Estimate random minimal sample set mss from all
given feature points F
n
2. Calculate the projection P
n
mss
from f
n
mss
over the
next m frames
3. Apply the projection P
n
mss
to all feature points F
n
4. Calculate the error of every feature point defined
by the error function E( f
n
) (see sec.5, equ.6). All
features whose error is below the predefined threshold
thresh are building the new consensus set f
n
CS
5.Calculated the overall cost of the consensus set by
cost function C( f
n
CS
). (see sec.5, equ.9)
6. If the cost of the new consensus set is decreased or
if the costs are the same and the size of the new con-
sensus set has increased, update the final consensus
set and its cost with the new one
7. Repeat the steps 1-6 until either all feature points
had been assigned to a consensus set or the consen-
sus set hasn’t been updated for a predefined number
of iterations or a predefined maximum number of it-
erations is reached
The final consensus set is assumed to be the best
projection of the largest set of remaining feature
points. So, the projection as well as the consensus set
is defined as a new group and the features assigned
to this group are removed from the feature set. This
procedure is repeated until either the size of the last
found consensus set or the number of remaining fea-
ture points becomes to small.
4 VISUAL PERCEPTION
CRITERIA
Perceiving a group of moving features the biologi-
cal perception systems usually depends a number of
perceptual constrains, that help to group clusters of
moving features. The following criteria are based on
human interpretation of perception of rigid objects
from 2D motion described by Ullman (Ullman, 1983).
Assuming features are situated on one rigid element,
they will probably follow one or more of follow crite-
ria:
MOTION SEGMENTATION OF ARTICULATED STRUCTURES BY INTEGRATION OF VISUAL PERCEPTION
CRITERIA
55

Geometric Projection. A feature point f
a
is rather
located on the same rigid element as the random min-
imum sample set f
mss
if the symmetric reprojection
error e
p
of f
a
of the projection P
mss
from f
mss
over all
m frames is small:
e
p
( f
n
a
) =
1
m− 1
n+m−1
∑
i=n
((P
i
mss
f
i
a
) − f
i+1
a
)
2
+
((P
i
mss
/ f
i+1
a
) − f
i
a
)
2
(1)
Local Distance. A feature point fa is rather located
on the same rigid element if its distance d from the
center of mass of the minimum sample set M( f
mss
)
over m frames is small:
d( f
n
a
,M( f
n
mss
)) =
1
m
n+m
∑
i=n
q
( f
i
a
− M( f
i
mss
))
2
(2)
Motion Vector. A feature point f
a
is rather located on
the same rigid element if it has the same or a similar
motion vector as the minimum sample set f
mss
:
d
v
( f
n
a
) =
1
m− 1
n+m−1
∑
i=n
(d( f
i
a
, f
i+1
a
) − d( f
m
ss
i
, f
m
ss
i+1
))
2
(3)
Axial Distance. A feature point fa is rather located
on the same rigid element if the distance da to the
axis spanned by the minimum sample set axis( f
mss
)
is small:
d
a
( f
n
a
) =
1
m
n+m
∑
i
min(d( f
a
(i),axis( f
i
mss
))) (4)
All these criteria are then integrated in the random
sample consensus algorithm.
5 INTEGRATION OF
PERCEPTION CRITERIA
The listed parameters are integrated in the RANSAC
algorithm by using them as penalty factor for the over-
all error estimation. In a common RANSAC approach
the error function (see sec.3, step 4) is based on the
symmetric reprojection error, as has been described
in equ.1. So, the common error function is defined
by:
E
org
( f
n
a
) = e
p
( f
n
a
) (5)
To integrate the predefined visual perception criteria,
the related distances of the feature point to the actual
minimum sample set are integrated in this function.
To achieve this, all factors are weighted and added to
the original error estimation. So the new consensus
set error function is defined by:
E
new
( f
n
a
) = e
p
( f
n
a
) + w
d
· d( f
n
a
,M( f
n
mss
))+
w
v
· d
v
( f
n
a
) + w
a
· d
a
( f
n
a
)
(6)
Here, w
d
, w
v
and w
a
represent the weighting factors
for the local distance, motion vector and axial dis-
tance. The feature distance as well as the distance
from the principal axis is normalized over the half im-
age diagonal, whereas the motion vector distance is
normalized from [0...1]. Additionally, the visual per-
ception criteria is applied to the overall cost function
of the consensus set (sec.3, step 4). Usually the cost
function is based on the error function (equ.5) and is
defined as:
C( f
n
CS
) =
1
m
n+m
∑
i=n
C( f
i
CS
) (7)
where n is the number of elements of the consensus
set. The cost function for every element is defined as:
C( f
n
a
) =
E
org
( f
n
a
),i fE
org
( f
n
a
) < thresh
thresh,ifE
org
( f
n
a
) ≥ thresh
(8)
where thresh refers to the predefined threshold that
has been used to select the consensus set (see sec.3,
step 4). The visual perception criteria are integrated
in the cost function by replacing the original error
formulation by the new error function formulated in
equ.6:
C( f
n
a
) =
E
new
( f
n
a
),i fE
new
( f
n
a
) < thresh
thresh,ifE
new
( f
n
a
) ≥ thresh
(9)
So both, the selection of the consensus set as well as
the overall cost function are adapted and the influence
of every criterium is controlled by the error function.
6 IMPLEMENTATION
The realization of the here presented approach has
been done as follows: First, the feature points of a
video sequences are detected and tracked by a motion-
based feature tracking algorithm (Koehler and Wo-
erner., 2008), which is mainly based on the pyramidal
implementation of the KLT feature tracking method
described by Bouget (Bouguet, 2002), following the
’good features to track’ method of Shi and Tomasi
(Shi and Tomasi, 1994).
For every frame n, the feature set is reduced to
those changing continuously their position over the
next m frames to estimate a projection. Only, if the
number of those features is larger than a predefined
minimum, the RANSAC algorithm is applied.
The RANSAC implementation of the here pre-
sented approach is mainly based on the Matlab open
source library by Marco Zuliani (Zuliani, 2008) and
follows the description in section 3. The result for ev-
ery frame is a set of groups representing the motion
VISAPP 2010 - International Conference on Computer Vision Theory and Applications
56
segments for this frame. To avoid an over segmenta-
tion a maximum number of groups can be defined, so
that only the largest groups are considered. This pre-
vents the segmentation of groups with only few fea-
tures that can also result from outliers or noise.
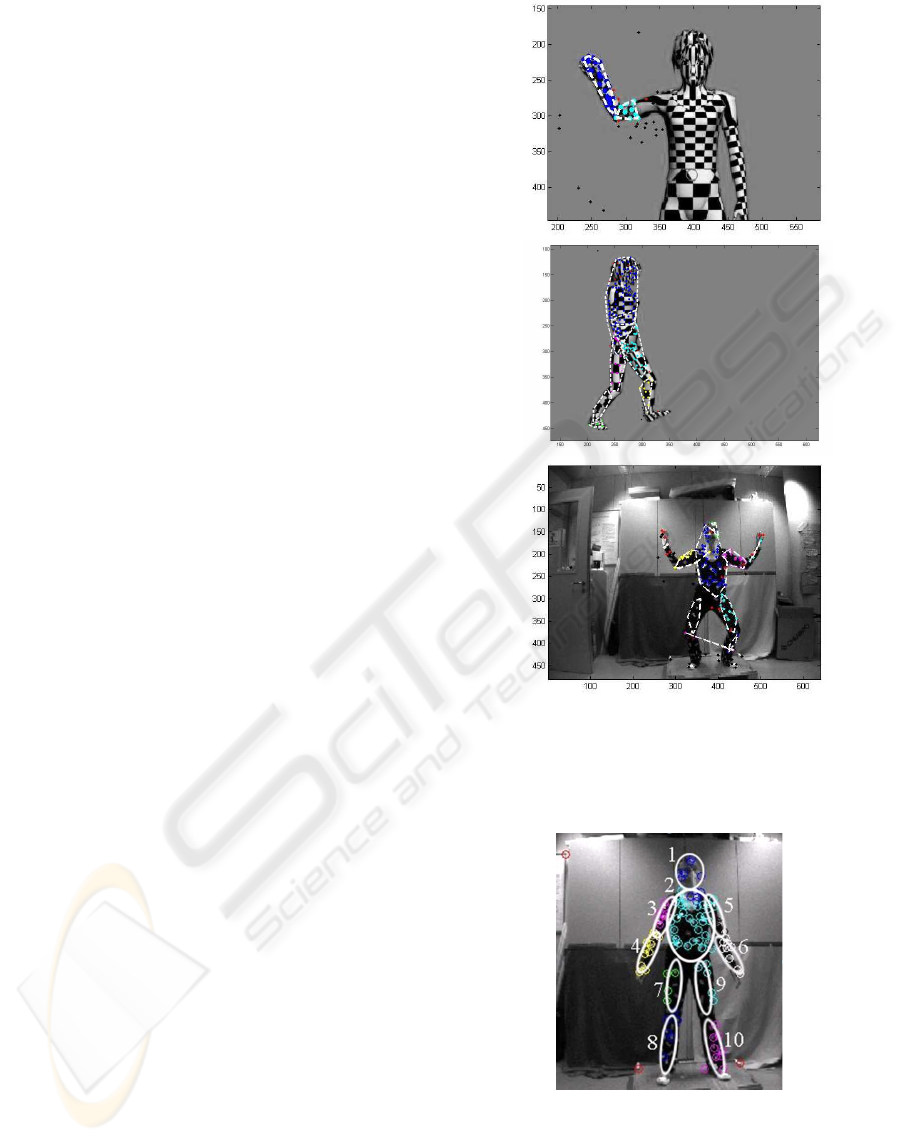
7 EVALUATION
The algorithm is evaluated on several video sequences
with artificial and natural human body movements: an
artificial rendered motion with a textured avatar lifting
up his hands (Figure 1a), an artificial rendered motion
with a walking avatar (Figure 1b) and a real human
motion (Figure 1c) captured with a BumbleBee cam-
era with 20
˜
fps and a resolution of 640x480px with
duration of ca. 3 seconds. Each video sequence com-
prises ca. 60 frames. The features of the evaluated
motion sequences are labeled by hand to get a ground
truth for the clustering algorithm. For the hand label-
ing up to 10 clusters (head, body, left upper and lower
arm, right upper and lower arm, left upper and lower
leg, right upper and lower leg) are defined represent-
ing the significant rigid parts of the human body as
shown in Figure 2. To evaluate the different percep-
tion criteria, we analyzed the correctness and speci-
ficity of the clustering of the labeled body segments.
7.1 Evaluation of Perception Criteria
The influence of the described perception criteria, lo-
cal distance and mean motion as well as axial dis-
tance, on the clustering result is analyzed. There-
fore, the feature points of the all video sequences are
segmented on basis of a rotation-scaling-translation
(RST) based-projection. For every frame, the feature
motion over the last three frames has been considered.
The segmentation results of everyframe are compared
to the ground truth and true positive and false positive
rate is calculated. The true positive and false positive
rate of the complete video sequence is calculated by
the mean true positive and false positive rate over all
frames.
To evaluate the clustering quality with regard to
different weighting factors, w
d
, w
v
and w
a
, all com-
binations of weighting factors are tested for the val-
ues 0.0, 0.5, and 1.0 with increasing thresholds (0.1,
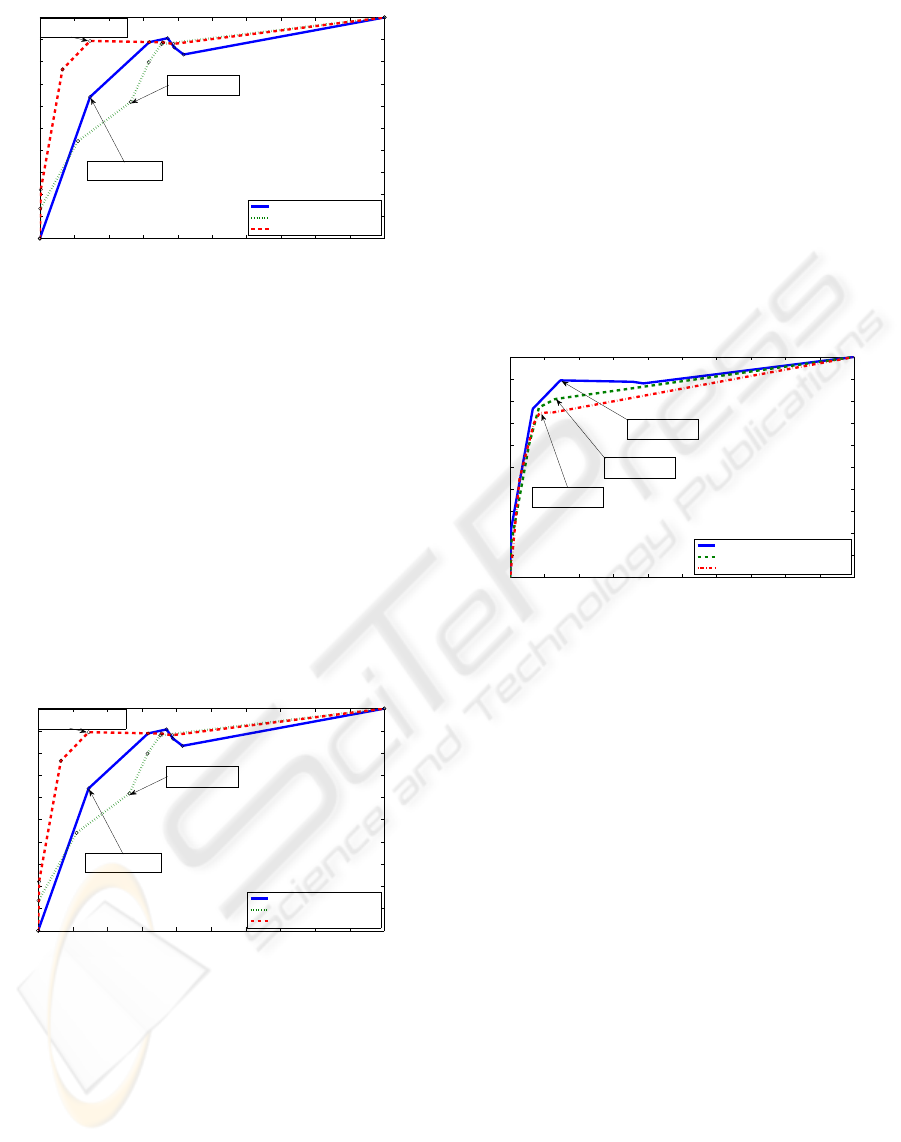
0.3, 0.5, 0.7, and 0.9). The best and the worst re-
sult, as well as the original RANSAC segmentation
is shown in Figure 3. As can be seen the receiver
operator characteristics (ROC) of segmentation with
additional perception criterions vary to the original
RANSAC segmentation. Best performance can be
found for a weighting factor of w
d
= 1, w
v
= 1, w
a
= 0
a)
b)
c)
Figure 1: Results for the three different video sequences
used for evaluation, a) and b) are artificial rendered waving
and walking motions, c) is a video sequence with natural
full body motion. The segmented regions are shown by dif-
ferent feature color.
Figure 2: Ground truth for the evaluation of clustering and
corresponding labeling of body segments: 1. head, 2. body,
3. upper right arm, 4. lower right arm, 5. upper left arm,
6. lower left arm, 7. upper right leg, 8. lower right leg, 9.
upper left leg, 10. lower left leg.
MOTION SEGMENTATION OF ARTICULATED STRUCTURES BY INTEGRATION OF VISUAL PERCEPTION
CRITERIA
57
0 0.1 0.2 0.3 0.4 0.5 0.6 0.7 0.8 0.9 1
0
0.1
0.2
0.3
0.4
0.5
0.6
0.7
0.8
0.9
1
False Positive Rate
True Positive Rate
Example for ROC results − Waving
Usual Ransac result
Worst segmentation result
Best segmentation result
Worst Result:
w
d
= 0, w
a
= 0, w
a
= 1
Ransac result without
perception criteria
Best result:
w
d
= 1, w
v
= 1, w
a
= 0
Figure 3: Best and worst ROC curves for RST based seg-
mentation with different weights for artificial avatar motion
’Waving’. Best result has a weighting factor of w
d
= 1,
w
v
= 1, w
a
= 0 at thresh = 0.3, worst has a weighting fac-
tor of w
d
= 0, w
v
= 0, w
a
= 1 at thresh = 0.3.
and thresh = 0.3 with a true positive rate of 0.8937
and a false positive rate of 0.1458. The samples in-
cluding only the axial distances (w
d
= 0, w
v
= 0,
w
a
= 1, thresh = 0.3), are performing worse than
usual RANSAC segmentation results. The best results
of the true-positive and false-positive rate for the dif-
ferent criterions for the different video sequences are
shown in Figure 4. The relation of true positive and
false positive rate is usually better, the higher local
distance w
d
and mean motion w
v
are weighted. They
also show better performance when the weighting of
the axial distance is low.
0 0.1 0.2 0.3 0.4 0.5 0.6 0.7 0.8 0.9 1
0
0.1
0.2
0.3
0.4
0.5
0.6
0.7
0.8
0.9
1
False Positive Rate
True Positive Rate
Example for ROC results − Waving
Usual Ransac result
Worst segmentation result
Best segmentation result
Worst Result:
w
d
= 0, w
a
= 0, w
a
= 1
Ransac result without
perception criteria
Best result:
w
d
= 1, w
v
= 1, w
a
= 0
Figure 4: Comparison of best ROC results for RST based
segmentation of different video motion sequences with the
used weighting factors.
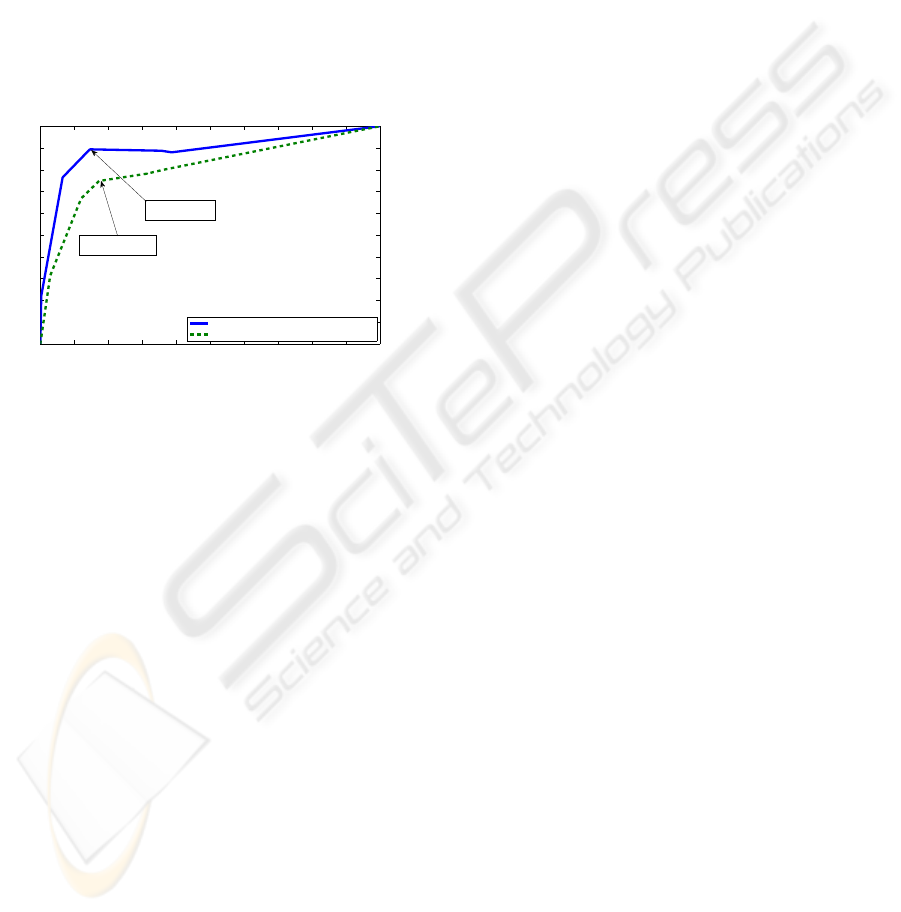
7.2 Evaluation of Segmentation over
Three, Five and Ten Frames
As the segmentation is done over time, we have to
consider the tradeoff between a long time period,
which would be good to get reliable motion estima-
tion and the problem that features tend to vanish be-
cause of occlusions etc. So, if the time period is cho-
sen to long, it can happen that not enough features
exist to reconstruct the motion. To analyze this trade-
off, we compared the best results of segmentations
over three, five and ten frames. The feature points of
the first video sequence are segmented with different
weighting factors, and for every frame, the properties
of the last three, five or ten frames are considered.
We can see that, comparing the best results of ev-
ery segmentation (Figure 5), the true positive as well
as the false positive rate decreases the more frames
are used. Noteworthy is that the best result over ten
frames, has been achieved without the integration of
any additional weighting factors (w
d
= 0, w
v
= 0,
w
a
= 0, thresh = 0.3).
0 0.1 0.2 0.3 0.4 0.5 0.6 0.7 0.8 0.9 1
0
0.1
0.2
0.3
0.4
0.5
0.6
0.7
0.8
0.9
1
False Positive Rate
True Positive Rate
Comparsion of best ROC results for different frame counts
Best ROC result over 3 frames
Best ROC result over 5 frames
Best ROC result over 10 frames
3 frames:
w
d
= 1, w
v
= 1, w
a
= 0
5 frames:
w
d
= 1, w
v
= 1, w
a
= 0
10 frames:
w
d
= 0, w
v
= 0, w
a
= 0
Figure 5: Comparison of best ROC result for segmentation
of artificial avatar motion Waving over 3, 5 and 10 frames.
True positive as well as the false positive rate of best results
decrease with a higher number of frames used for segmen-
tation.
7.3 Evaluation of RST and
Homographic based Segmentation
To find elements which could be underlying by a rigid
element, two different geometric projections can be
used. From a geometrical point of view, it would
be accurate to estimate the homographic projection
of the feature motion, which needs at least 4 points
to calculate the transformation. But from a per-
ceptional point of view, also a Rotation-Translation-
Scaling transformation, which only needs two points
to be computed, can be assumed. This can be seen on
a simple example of Johansson point light displays.
Usually, the human perception system only needs one
point at every joint to build up a human pose. This
means that for the reconstruction and recognition of
a rigid element, only two points are enough. So it is
likely, that biological vision systems are recognizing
information on the basis of RST transformations as
well as on the basis of homographic projections.
To evaluate this characteristic, both projection cri-
teria had been analyzed. To do this, the feature points
VISAPP 2010 - International Conference on Computer Vision Theory and Applications
58
of the first video sequence are segmented on basis of
a RST as well as on a homographic projection with
different weighting factors.
Comparing the results which had been achieved
with a RST projection with those of a homographic
projection as can be seen in Figure 6, we can see that
the segmentations on the basis of an RST projection
has a much better relation of true positive and false
positive rate than those on basis of a homographic
projection. This could amongst others be caused by
the fact that a RST projection is more robust against
noise, because here, smaller variations don’t have so
much influence on the overall result as they would
have considering a homographic projection.
0 0.1 0.2 0.3 0.4 0.5 0.6 0.7 0.8 0.9 1
0
0.1
0.2
0.3
0.4
0.5
0.6
0.7
0.8
0.9
1
False Positive Rate
True Positive Rate
Best ROC result for RST and homographic projection
Best ROC result RST projection
Best ROC result homographic projection
RST−based
w
d
= 1, w
v
= 1, w
a
= 0
homograpy−based
w
d
= 0.5, w
v
= 1, w
a
= 0
Figure 6: Comparison of best ROC results of RST based
segmentation with homographic based segmentation for ar-
tificial avatar motion Waving.
8 CONCLUSIONS
We presented a motion segmentation approach that
combines a consensus based motion segmentation al-
gorithm with criteria from biological vision system in
order to cluster sparse groups of feature points only
by their motion information. It is show, that this com-
bination has the potential to cluster also small, depen-
dent moving features.
The results of the performance evaluation of pa-
rameter influences as well as the practical evaluation
on artificial and real human motion video sequences
show that good motion segmentation can be achieved
by this approach
REFERENCES
Bouguet, J. Y. (2002). Pyramidal implementation of the
lucas kanade feature tracker: Description of the algo-
rithm.
Fraile, R., Hogg, D., and Cohn, A. (2008). Motion seg-
mentation by consensus. international conference on
pattern recognition. ICPR.
Giese, M. and Poggio, T. (2003). Neural mechanisms for
the recognition of biological movements. Nature Re-
views Neuroscience, 4:179–192.
Johansson, G. (1973). Visual perception of biological mo-
tion and a model for its analysis. Perception and Psy-
chophysis, 14:201–211.
Koehler, H. and Woerner., A. (2008). Motion-based feature
tracking for articulated motion analysis. In IEEE Int.
Conf. on Multimodal Interfaces (ICMI 2008), Work-
shop on Multimodal Interactions Analysis of Users a
Controlled Environment., Chania, Greece.
Pundlik, S. J. and Birchfield, S. T. (2008). Real-time motion
segmentation of sparse feature points at any speed.
IEEE Transactions on Systems, Man, and Cybernet-
ics, 38(3):731–742.
Shi, J. and Tomasi, C. (1994). Good features to track. In
IEEE, editor, IEEE Conference on Computer Vision
and Pattern Recognition, Seattle.
Tron, R. and Vidal, R. (2007). A benchmark for the com-
parison of 3-d motion segmentation algorithms. IEEE
Conference on Computer Vision and Pattern Recogni-
tion, CVPR, pages 1–8.
Ullman, S. (1983). Computational studies in the interpreta-
tion of structure and motion: Summary and extension.
Human and Machine Vision.
Yan, J. and Pollefeys, M. (2005). Articulated motion seg-
mentation using ransac with priors. ICCV Workshop
on Dynamical Vision.
Zuliani, M. (2008). Ransac toolbox for matlab.
http://www.mathworks.com/matlabcentral/fileex
change/18555.
MOTION SEGMENTATION OF ARTICULATED STRUCTURES BY INTEGRATION OF VISUAL PERCEPTION
CRITERIA
59
