
COMBINED MACHINE LEARNING WITH MULTI-VIEW
MODELING FOR ROBUST WOUND TISSUE ASSESSMENT
Hazem Wannous
IMS Laboratory, University of Bordeaux, Talence, France
Yves Lucas, Sylvie Treuillet
PRISME Institute, University of Orleans, Orleans, France
Keywords:
Tissue classification, 3D modeling, Machine learning, Wound assessment.
Abstract:
From colour images acquired with a hand held digital camera, an innovative tool for assessing chronic wounds
has been developed. It combines both types of assessment, colour analysis and dimensional measurement
of injured tissues in a user-friendly system. Colour and texture descriptors have been extracted and selected
from a sample database of wound tissues, before the learning stage of a support vector machine classifier
with perceptron kernel on four categories of tissues. Relying on a triangulated 3D model captured using
uncalibrated vision techniques applied on a stereoscopic image pair, a fusion algorithm elaborates new tissue
labels on each model triangle from each view. The results of 2D classification are merged and directly mapped
on the mesh surface of the 3D wound model. The result is a significative improvement in the robustness of the
classification. Real tissue areas can be computed by retro projection of identified regions on the 3D model.
1 INTRODUCTION
Wound assessment process is based on visual exam-
ination, in order to identify different tissues such as
granulation, slough, and necrotic ones. The wound is
usually described by its spatial measurements and the
colours of its tissues, providing an important indica-
tion of its types and thus the particular stage of heal-
ing. The monitoring of the wound healing process
represents a difficult task for clinicians and nurses,
where it is necessary to assess the different tissue
types on consecutive visits.
The clinical assessment of chronic wounds still
essentially rely on manual tedious and expensive
practices, which do not produce objective measure-
ments and quantitative assessment of healing. Re-
cently, research has focused on the analysis of the
wound images in order to develop quantitative non
invasive measurement with image processing tech-
niques for monitoring. However, they addressed sep-
arately the problems of wound shape capture and tis-
sue classification. Attempts to extract automatically
the wound area using colour measurements did not
completely succeeded and semi-automatic methods
were preferred (Oduncu et al., 2004). Furthermore,
the results obtained on several colour spaces by direct
classification on the pixels were still not acceptable,
even when combining several colour and texture pa-
rameters to describe the tissues (Kolesnik and Fexa,
2004). The region-based classification approach has
been discussed by (Zheng et al., 2004), but the tis-
sue samples have been manually extracted as squared
homogeneous regions of interest and finally, the as-
sessment has been partially achieved (classification
between only two types of tissues).
Concerning the spatial measurements, some
prototypes based on structured light techniques
(Krouskop et al., 2002) or photogrammetry (Malian
et al., 2002) were tested, but these cumbersome and
complex systems were not adapted to the clinical
practice which requires a low cost, handy and simple
tool operated by a nurse. The second version of the
MAVIS system (Jones et al., 2006) which uses only a
reflex digital camera equipped with special dual lens
optics can record two half images from slightly dif-
ferent viewpoints on a single shot. But it suffers
from several drawbacks: a costly digital reflex cam-
era is required to adapt the special dual lens with extra
cost, the very close viewpoints do not enable accurate
3D measurements and finally, the tissue classification
98
Wannous H., Lucas Y. and Treuillet S. (2010).
COMBINED MACHINE LEARNING WITH MULTI-VIEW MODELING FOR ROBUST WOUND TISSUE ASSESSMENT.
In Proceedings of the International Conference on Computer Vision Theory and Applications, pages 98-104
DOI: 10.5220/0002833300980104
Copyright
c
SciTePress

problem has not been addressed. In the Derma project
(Callieri et al., 2003), wound measurements and tis-
sue classification have been both tackled, as it enables
shape and natural texture grabbing, but the classifica-
tion process remains user assisted as seeds need to
be manually pointed inside the wound and a similar-
ity measure adjusted to control the merging process.
Moreover, it is based on a costly Minolta 3D scanner,
forbidding totally its spreading in clinical staff.
In contrast to the aforementioned methods dealing
separately with wound shape and tissue classification
tasks, we propose in this paper an original approach
using a sharp 3D model of the wound to ensure ro-
bust classification of its tissues. Furthermore, a smart
training of the classifier over tissue samples extracted
automatically will be discussed. We mainly focus on
the integration of geometrical structure of the wound
in classification process, which improves wound as-
sessment and gives access to real measurements. The
paper is organized as follows: Section 2 presents the
constitution of the sample data as a pre-processing
step of the classification method described in section
3. Section 4 discusses the multi view approach. The
improvement of classification is presented in section
5 before to conclude in the last section.
2 WOUND SAMPLE DATABASE
A database of chronic wound images has been consti-
tuted with the help of the clinical staff in several hos-
pital centers, in order to get a exhaustive set of images
for different types of tissues. Furthermore, a variety
of types of chronic wounds has been collected from
different care services, such as a leg ulcers, diabetic
lesions, bed sores, etc. Several hundreds of colour im-
ages (3 Mpixels, 24 bits) have been taken, by different
digital cameras under uncontrolled illumination con-
ditions, with respect to a specific protocol integrating
several points of views for each single wound.
Colour pre-segmentation provides an automatic
delineation of tissue samples and simplifies the fol-
lowing classification step by extracting more robust
and discriminant local attributes on tissue area than
with direct pixel classification. JSEG algorithm
(Deng and Manjunath, 2001) has been selected as it
has been proved that it is the more efficient compared
to three other advanced methods for unsupervised tis-
sue segmentation (Wannous et al., 2007). A graphical
interface allows clinicians to directly label automati-
cally pre-segmented regions. Next, a unique medical
reference is elaborated by merging the region labels
of the college of experts. This practical medical ref-
erence has been used exclusively for all tasks in the
following, in particular in the classifier learning step.
The pre-segmented image database has been pro-
vided to a group of clinicians in order to label it ac-
cording to the classical colour code: red for granula-
tion, yellow for slough and black for necrosis. Labeli-
sation realized by the different clinicians have been
merged to get a unique and reliable medical reference
by applying a majority vote criterion according to a
given tissue class. We retained for each tissue the pix-
els with confidence level greater than or equal to 75
%. Following machine learning and algorithm evalu-
ation will be based on this medical reference.
Labeling sessions repeated one month apart by the
clinicians confirm that the identification of tissues is
a subjective task, as the obtained overlap scores for
these tests remain moderate (58% to 85%) and also
each clinician does not produce similar labels one
month later (65% to 91%) (Wannous et al., 2007).
Therefore, the multi expert medical reference is a so-
lution to build a more robust and non-subjective tis-
sue sample database from automatically segmented
regions.
3 MACHINE LEARNING SYSTEM
To enable a sharp discrimination among the tissue
classes, different types of colour and texture descrip-
tors have been calculated on the sample database,
composed of four types of tissues. Consequently, rel-
evant descriptors have been searched for the learning
step of a supervised classifier thanks to manual la-
beled tissue samples from the wound database.
3.1 Colour and Texture Features
To characterize each tissue class more accurately, a
total of 850 significant tissue regions has been ex-
tracted in the wound image database from the seg-
mentation phase of the wound images. These regions
correspond to the four known types of tissue identified
manually (30% Granulation, 24% Slough, 9% Necro-
sis and 37% Healthy). We have only tested the most
common descriptors for the dermatological applica-
tions, especially those concerning wound and ulcer.
The extracted colour descriptors are: Mean
Colour Descriptor (MCD), locally adapted Dominant
Colour Descriptors (DCD) (Deng et al., 1999) cal-
culated using Mean Shift colour clustering algorithm
(Comaniciu and Meer, 2002) and 2D/3D histograms
in different colour spaces. The extracted texture de-
scriptors are: Gabor based features (GAB), Local
Binary Pattern histogram calculated from the Gray
Level wound image GL (Ojala et al., 2002), Haralick
COMBINED MACHINE LEARNING WITH MULTI-VIEW MODELING FOR ROBUST WOUND TISSUE
ASSESSMENT
99

Gray Level Co-occurrence Matrix features (GLCM)
and the normalized texture contrast and the anisotropy
(CA) computed from the second moment matrix, de-
rived from the gradient of the GL image (Carson et al.,
2002).
To evaluate the discriminating power of the de-
scriptors, we measure directly the classification rates
at the classifier output. This provides more consistent
evaluation and more efficiency in the process. More-
over, our classifier integrates the correlation between
the descriptors and avoids data reconditioning.
3.2 Classifier Parameters Tuning
The performance of the classifier depends strongly
on the selection of appropriate kernel functions and
the setting of their parameters, but also on the perti-
nence of the input descriptors. Consequently,we must
test all feature vectors with different settings of the
classifier parameters. The samples have been divided
equally into two subsets for test and training, in or-
der to evaluate the different descriptor vectors. As the
training subset needs to provide a complete and repre-
sentative description of the tissue classes, several iter-
ations are applied to randomly select the training set
and the final results are obtained by averaging on all
iterations.
Concerning the classifier, we have selected soft-
margin SVM algorithm (so-called C-SVM) tested
with different classical kernels: linear, polynomial,
Radial Basic Function (RBF) and perceptron kernel
(Lin and Li., 2005). The adopted C-SVM is a multi-
class classifier based on the Error Correcting Output
Codes framework (Huang et al., 2006) which pro-
vides, more than the labels, the probability estimates
of belonging to a class. These probability estimates
are used later by the fusion algorithm to label a re-
gion of the 3D model.
After the selection of a particular kernel, a regu-
larization parameter (C), which controls the penalty
of the classification errors, must be tuned. In the case
of linear or perceptron kernels, we have only to opti-
mize this single parameter but in the case of the RBF
and polynomial kernels, a second parameter has to be
tuned (resp. α and θ). For the tuning of these pa-
rameters, we used the line search technique for the
two first kernels and the parallel grid search tech-
nique for the two others, combined with k-fold cross
validation with k=5 (Chapelle et al., 2001). Figure
1 illustrates the setting of hyper parameters (C and
α) of C-SVM classifier with RBF kernel by parallel
grid search technique and the ROC curve obtained for
each kernel. The search intervals were [2
−5
, 2
15
] for
the regularization parameter C and [2
−15
, 2
3
] for the
(a) (b)
Figure 1: Classifier design: (a) ROC curve obtained by
4 different kernels (b) hyper-parameters setting of C-SVM
classifier with RBF kernel. The training set is obtained by
combining MCD-DCD with GLCM descriptors.
kernel parameter (α).
The selection of descriptors thanks to the evalu-
ation based-classifier result is presented in Table 1.
The classification accuracy is expressed by four pre-
dictive measures, commonly used by clinicians to
evaluate the quality of a diagnostic method. These
measure are sensitivity (Se), specificity (Sp), Success
rate (Sr) and Overall accuracy (Oa). These results are
expressed as the averaged of each predictive measure
over the 4 classes. The multiple experimental tests
between all color/texture descriptors show that bests
results can be obtained by MCD-DCD as a colour
descriptor and GLCM as a texture descriptor, using
C-SVM classifier with perceptron kernel (Wannous
et al., 2010).
These results indicate that texture is less relevant
than colour for wound tissue discrimination. How-
ever, it provides complementary information and,
therefore, is significant. In this way, texture and
colour information of tissue wound can be combined
to achieve better classification accuracy. The quality
of the tissue classification has been validated over a
series of 50 wound images by computing Kappa co-
efficients between the medical reference provided by
the experts and automatic classification (see Table 4 ).
These coefficients are close to those obtained between
clinicians and medical reference.
4 MULTI VIEW APPROACH
The 2D classification results still suffer from a signif-
icant drawback, as it has been established that a devi-
ation of 20
◦
of the optical axis from the normal of the
wound typically leads to an underestimation of sur-
face around 10% (Treuillet et al., 2009). This is due
to lighting variations which modify the colours and
perspective effects from distant viewpoints which in-
duce significant bias in the classification results (see
2D classification in Figure 4) and then do not allow
computing real surfaces. Like the clinician, who dis-
VISAPP 2010 - International Conference on Computer Vision Theory and Applications
100
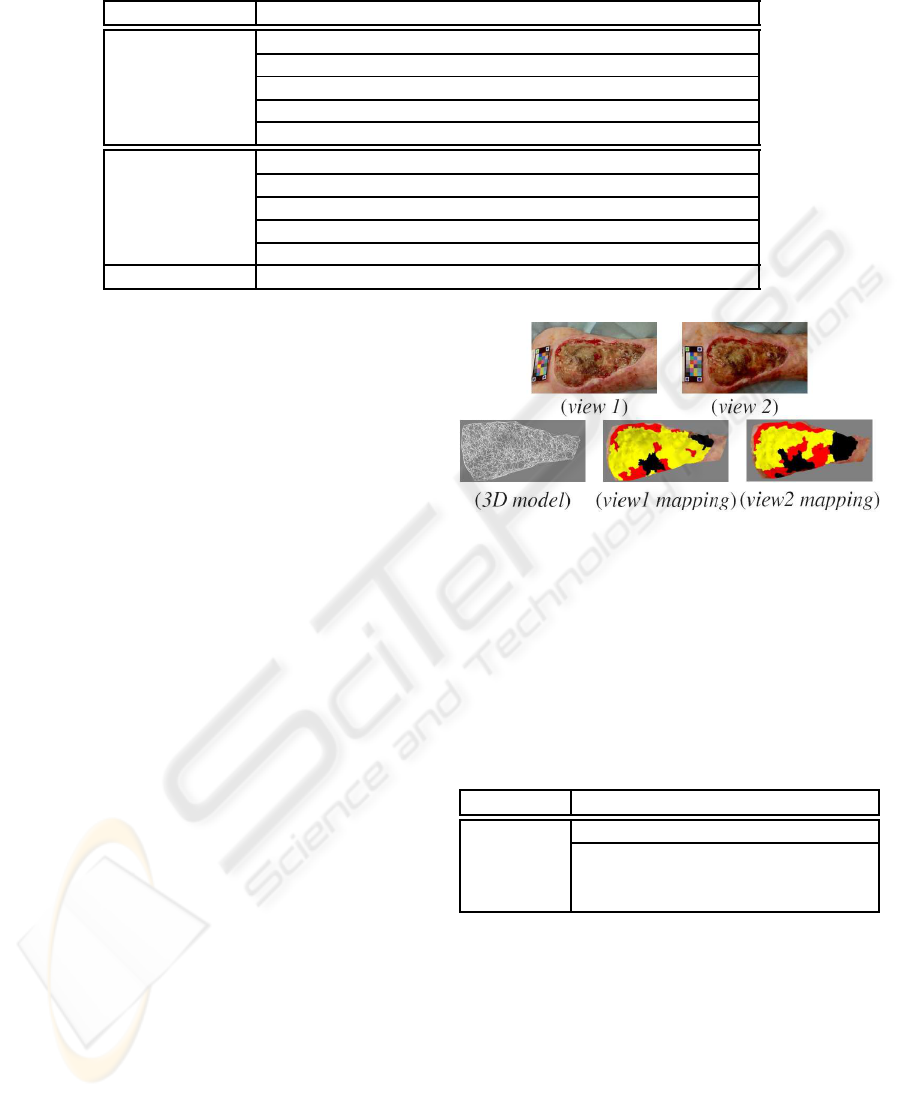
Table 1: Predictive power of colour and texture descriptors.
Descriptor Symbol Se (%) Sp (%) Sr (%) Oa (%)
h-RGB 58 87 72 80
h-LAB 66 87 76 82
Colour h-HSV 62 87 75 81
h-rgb 57 86 72 80
MCD-DCD 67 89 78 84
h-LBP 30 78 54 66
m-LBP 29 77 53 66
Texture GLCM 54 82 68 72
GAB 47 81 64 71
CA 32 79 55 68
Colour+Texture MCD-DCD+GLCM 77 92 84 88
poses of many observation points to provide a reli-
able diagnosis, a multi view technique should allow
more robust results. So, we propose to use the dimen-
sional information captured from a multi view model
because reliable wound assessment must provide re-
producible results, regardless to the position and ori-
entation of the camera.
4.1 View-dependent Classification
Wound images have been taken from different points
of view. 3D model has been obtained using uncali-
brated vision techniques completed by original refine-
ments to obtain semi-dense matching between widely
separated views (Albouy et al., 2006).
Clinicians establish their diagnosis visually on the
photographed wound, with the help of a red-yellow-
black scale placed in the camera field, corresponding
to the three types of tissu. However, this diagnosis
is also based on their observations of the wound dur-
ing the patient visit. Then, the clinician assessment of
tissues can be seen as a combination of the colorimet-
ric information (image plane) with shape information
(through observation of the human eye). So, we can
illustrate the dependance of the classification assess-
ment on the point of view by a simple projection on
a 3D model computed from two views of a wound.
To do this, the classification result from each one of
the single view have been mapped on the 3D model
separately in order to label the triangular mesh. Each
triangle is labeled according to its higher score and
then the surface of each tissue type can be computed
by summing the triangles belonging to the same tis-
sue class. Figure 2 shows the variation of the cartog-
raphy mapping on the an ulcer 3D model according
to the classification results coming from single view
approach.
The 3D model allows accurate comparison of
single-view classifications since the differences are
Figure 2: Dependance of the classification result on the
point of view.
expressed in cm
2
and not in pixel. Table 2 presents
the area of the surfaces calculated in cm
2
for each tis-
sue type, when mapping the image plane on the 3D
model presented in Figure 2.
Table 2: Measured real surfaces for each type of tissue when
mapping separately the classification results obtained from
two views of the same wound on the 3D model.
Tissue class 3D surface (cm
2
)
Accord. to view1 Accord. to view2
Granulation 12.9 18.2
Slough 36.9 27.4
Necrosis 4.2 8.4
The obtained differences reflect the effect of per-
spective projection in the image and the relief of skin
ulcers. This experiment confirms the limitations of
the single-view approach and the need to take into ac-
count the 3D aspect. So it is possible to fusion the
results of tissue labeling coming from each image.
4.2 Merging of the Classification
Results
Based on the 3D reconstruction of the scene, the main
idea is to combine the colour information of the re-
COMBINED MACHINE LEARNING WITH MULTI-VIEW MODELING FOR ROBUST WOUND TISSUE
ASSESSMENT
101
gions, the calculation of points of view and the relief
in order to get a classification more robust and also ac-
cess to real surfaces. To do this, pictures of the wound
have been taken from different point of views and a
3D model of 3000 to 4500 matches have been ob-
tained in 1024× 768 image pairs, allowing the match-
ing between widely separated views. It is so possible
to match homologous regions in each view and to fu-
sion classification results.
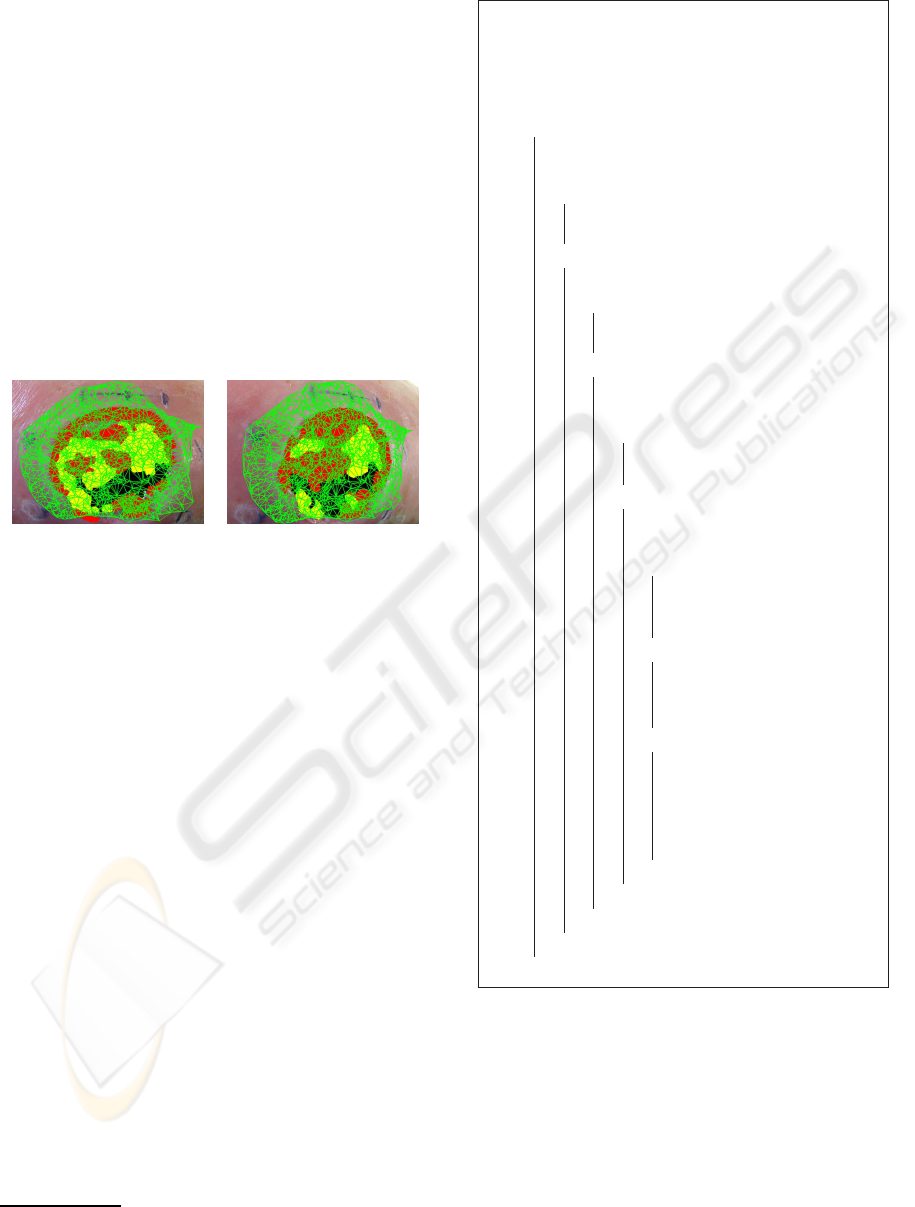
The 3D mesh is projected on the stereo pair to pro-
vide a 2D Delaunay mesh of triangles in each image
(Figure 3). Due to the point correspondences between
the two images, each triangle in the left image has a
homologous one in the right image. So it is possible
to fusion the results of tissue labeling coming from
each image.
(on view 1) (on view 2)
Figure 3: Triangular model projected on the classification
results.
The strategy we have experimented is based on se-
quential multi-criterion tests with recursive splitting
of the triangles
1
. It takes into consideration the tri-
angle area, its dominant class, the class probabilities
at the classifier output and the solid angle of the cone
generated from the optical center and for which the
triangle is a cross section (cf. Algorithm 1).
5 EXPERIMENTAL RESULTS
To analyze the management of the triangle labeling
process through the fusion algorithm, we perform it
on fifteen pairs of wound images. The Table 3 gives
the numbers of triangles labeled at each step of the fu-
sion algorithme applied on the 3D model of the Figure
3. It appears clearly that for more than half of model
surface, the classification results dependent strongly
on the viewpoint where only 40% of the total sur-
face were labeled with the same class in both views.
Only a few triangles are concerned with the splitting
step; this is because of the semi-dense 3D model in
our matching process. However, about 20% of the
wound model area is labeled according to solid angle
1
the triangle is recursively split along the median line of
its longest side
Data: classification results on two views +
3D model
Result: multi view classification
project the 3D triangular model on each
0.1
view;
forall triangles of the 3D model do0.2
find tissue percentage on each view;0.3
if the two views have the same tissue0.4
class then
label triangle with common tissue0.5
class;
else
0.6
compute 3D triangle surface;0.7
if surface > threshold then0.8
split the triangle & go back to0.9
0.2;
else0.10
identify dominant tissue in each0.11
view;
if same majority class then0.12
label triangle with this0.13
majority class;
else
0.14
compute the solid angle in0.15
each view (S1, S2);
if S1≫S2 then
0.16
label triangle0.17
corresponding to 1
st
view;
else if S2≫S1 then
0.18
label triangle0.19
corresponding to 2
nd
view;
else
0.20
compute the class0.21
probabilities in each
view;
label triangle by max
0.22
probability class;
end
0.23
end0.24
end0.25
end0.26
end0.27
Algorithm 1: Fusion algorithm
Algorithm 1: Fusion algorithm.
criteria. Finally, for about 35% of the model surface,
the two criteria of dominant class and probability es-
timates need to be computed. Such analysis attests
of the fact that the classification is view dependent,
which implies to combine several viewpoints.
As the pertinence of the fusion algorithme is
demonstrated. Since we are more interested in the
performance of our method in practical applications,
by testing its accuracy on the classification results and
VISAPP 2010 - International Conference on Computer Vision Theory and Applications
102
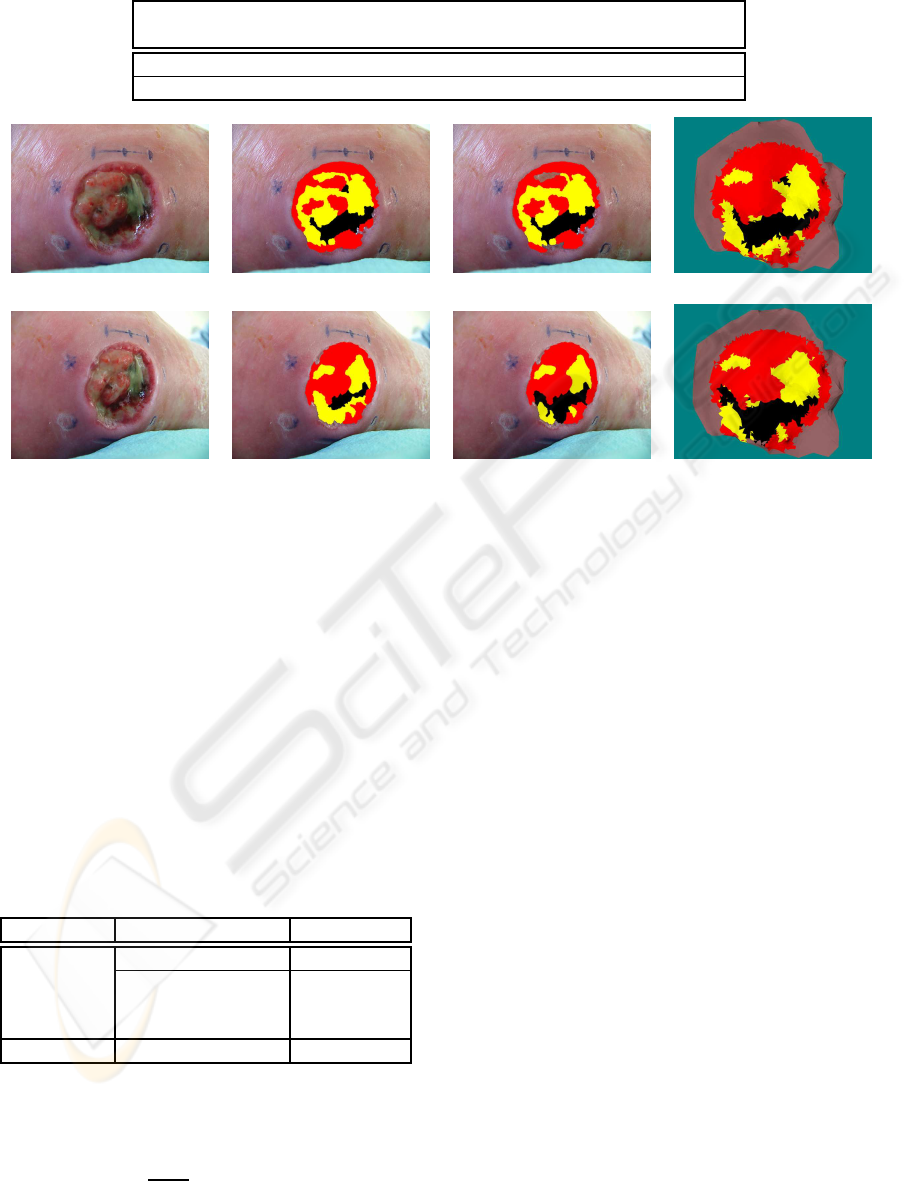
Table 3: Number of triangles labeled at each step of the fusion algorithm.
Common After Dominant Solid Probability
class splitting class angle estimates
Nbr of triangles 1280 77 540 700 561
Percentage 40.5 % 2.4 % 17.0 % 22.2 % 17.9 %
view 1 2D medical ref 1 2D classification 1 3D medical ref
view 2 2D medical ref 2 2D classification 2 3D classification
Figure 4: Multi view classification.
its advances for tissue wound assessment application.
To evaluate the improvement due to the fusion of 2D
classification, we compared the scores between 2D
medical reference and 2D automatic classification on
one part and the overlap scores between 3D medical
reference and 3D classification results on the other
part (Table 4). The 3D medical reference is simply
the result of the fusion of the medical references com-
ing from the left and right images, mapped on the 3D
model. In this case, the class probability is replaced
by the level of confidence obtained from manual ex-
pert labeling.
Table 4: 2D/3D Overlap scores and Kappa coefficients av-
eraged over the wound database.
Tissue class Overlap score (%) Kappa coef.
2D 3D 2D 3D
Granulation 79.8 81.4 0.82 0.84
Slough 69.3 72.0 0.75 0.77
Necrosis 60.7 67.9 0.73 0.77
Average 69.9 73.8 0.77 0.79
The Kappa coefficient is also commonly used to
compute the degree of agreement between two med-
ical judgements (Landis and Koch, 1977). This sta-
tistical indicator, varying between 0 and 1, can be
calculated by K =
P
o
−P
e
1−P
e
where P
o
is the relative ob-
served agreement and P
e
the hypothetical probabil-
ity of chance agreement, using the observed data to
calculate the probabilities of each observer randomly
voting for each category. We therefore calculated the
Kappa coefficient in 2D approach (between classifier
and 2D medical reference) and 3D approach (between
3D classification and 3D medical reference) Table 4.
We observe that the agreement between medical
reference and automatic classification is globally im-
proved after the fusion step. The convergence of re-
sults from 2D to 3D approach is verified not only
globally but separately on each type of tissue. As
everything depends on the relevance of our 3D med-
ical reference, combining assessments from various
points of view leads logically greater robustness. The
improved performance of multi view classification is
visible in Figure 4, where some areas of the wound
were misclassified in one of two views before the fu-
sion. We are observing a convergence of the classifi-
cations from the single view to the multi view case,
which is expressed by a better agreement between
manual labeling and automatic classification.
These tests show that the fusion of 2D classi-
fications enables more accurate tissue classification.
Moreover, as the results can be mapped on the mesh
surface of the wound 3D model, real tissue surfaces
can be computed on it.
COMBINED MACHINE LEARNING WITH MULTI-VIEW MODELING FOR ROBUST WOUND TISSUE
ASSESSMENT
103

6 CONCLUSIONS
Machine learning based on SVM classifier with re-
gion descriptors as input has been improved by multi
view management. We have combined the region
classification results coming from several 2D images
of a skew surface, using the matched vertices of the
reconstructed 3D model. This approach has been
applied to the design of a complete 3D and colour
wound assessment tool. Experimental results show
that the fusion of 2D classification enables more ac-
curate tissue classification. Moreover, as the results
can be mapped on the mesh surface of the wound 3D
model, real tissue surfaces and volumes can be com-
puted on it. Future works include several tests on
a larger image database. We also intend to improve
these results by matching regions from more than two
views and by testing colour descriptors invariant to
viewpoint and lighting conditions.
REFERENCES
Albouy, B., Koenig, E., Treuillet, S., and Y.Lucas: (2006).
Accurate 3d structure measurements from two uncali-
brated views. In ACIVS, pages 1111–1121,.
Callieri, M., Cignoni, P., Coluccia, M., Gaggio, G., Pingi,
P., Romanelli, M., and Scopigno, R. (2003). Derma :
monitoring the evolution of skin lesions with a 3d sys-
tem. In 8th Int. Work. on Vis. Mod. and Visualization,
pages 167–174.
Carson, C., Belongie, S., Greenspan, H., and Malik,
J. (2002). Blobworld: image segmentation using
expectation-maximization and its application to image
querying. IEEE Trans. PAMI, 24(8):1026–1038.
Chapelle, O., Vapnik, V., Bousquet, O., and Mukherjee, S.
(2001). Choosing kernel parameters for support vector
machines. Machine Learning, pages 131–160.
Comaniciu, D. and Meer, P. (2002). Mean shift: a robust
approach toward feature space analysis. IEEE Trans.
PAMI, 24(5):603–619.
Deng, Y., Kenney, S., Moore, M., and Manjunath, B. S.
(1999). Peer group filtering and perceptual color im-
age quantization. In IEEE Inter. Symp. on Circ. and
Sys. VLSI (ISCAS’99), volume 4, pages 21–24, Or-
lando, FL.
Deng, Y. and Manjunath, B. S. (2001). Unsupervised
segmentation of colour-texture regions in images and
video. IEEE Trans. PAMI ’01, 23:800–810.
Huang, T., Weng, R. C., and Lin, C.-J. (2006). Generalized
bradley-terry models and multi-class probability esti-
mates. Journal of Machine Learning Research, 7:85–
115.
Jones, C. D., Plassmann, P., Stevens, R. F., Pointer, M. R.,
and McCarthy, M. B. (2006). Good practice guide to
the use of mavis ii. Technical report, Medical Imaging
Research Unit TR-07-06, Univ. of Glamorgan.
Kolesnik, M. and Fexa, A. (2004). Segmentation of wounds
in the combined color-texture feature space. SPIE
Medical Imaging, 5370:549–556.
Krouskop, T. A., Baker, R., and Wilson, M. S. (2002). A
noncontact wound measurement system. J Rehabil
Res Dev, 39(3):337–345.
Landis, J. and Koch, G. (1977). The measurement of ob-
server agreement for categorical data. Biometrics,
33:159–174.
Lin, H.-T. and Li., L. (2005). Infinite ensemble learning
with support vector machines. J. Gama et al., eds.,
Machine Learning: ECML ’05, Lecture Notes in Arti-
ficial Intelligence, 3720:242–254, Springer–Verlag.
Malian, A., Heuvel van den, F., and Azizi, A. (2002). A
robust photogrammetric system for wound measure-
ment. In International Archives of Photogrammetry
and Remote Sensing, volume 34, pages 264 –269,
Corfu, Greece.
Oduncu, H., Hoppe, H., Clark, M., Williams, R., and Hard-
ing, K. (2004). Analysis of skin wound images using
digital color image processing: a preliminary commu-
nication. Int J Low Extrem Wounds, 3(3):151–156.
Ojala, T., Pietikainen, M., and Maenpaa, T. (2002). Mul-
tiresolution gray-scale and rotation invariant texture
classification with local binary patterns. IEEE Trans.
PAMI, 24(7):971–987.
Treuillet, S., Albouy, B., and Lucas, Y. (2009). Three-
dimensional assessment of skin wounds using a stan-
dard digital camera. IEEE Trans. on Medical Imaging,
28:752–762.
Wannous, H., Treuillet, S., and Lucas, Y. (2007). Su-
pervised tissue classification from color images for a
complete wound assessment tool. In 29th Inter. Conf.
of the IEEE Eng. in Med. and Bio. Soc. EMBS’07,
pages 6031–6034.
Wannous, H., Treuillet, S., and Lucas, Y. (2010). Robust tis-
sue classification for reproducible wound assessment
in telemedicine environments. to appear in the Jour-
nal of Electronic Imaging.
Zheng, H., Bradley, L., Patterson, D., Galushka, M., and
Winder, J. (2004). New protocol for leg ulcer tissue
classification from colour images. In 26th Inter. Conf.
of the IEEE Eng. in Med. and Bio. Soc. EMBS’04, vol-
ume 1, pages 1389–1392.
VISAPP 2010 - International Conference on Computer Vision Theory and Applications
104
