
SPATIAL COLOR CONFIDENCE FOR PHYSICALLY BASED
RENDERING SETTINGS ON LC DISPLAYS
J
¨
org Koch, Niklas Henrich and Stefan M
¨
uller
Institute for Computational Visualistics, University of Koblenz-Landau, Germany
Keywords:
Display characterization, Spatial inhomogeneity, LCD, GPU.
Abstract:
Color confidence is crucial regarding physically-based rendering settings in order to produce most promising
visual results. Display characterization and in particular spatial inhomogeneity correction is often neglected
in physically-based rendering applications, yet, are important to achieve color confidence. By evaluating rele-
vant display characteristics, this paper recommends a strategy for selecting the most suitable characterization
model for a given device. We indicate the importance of correcting spatial inhomogeneity and, on that ac-
count, provide an extension to the applied characterization models. All characterization models as well as
our proposed extensions are implemented using modern graphics hardware, therefore, applicable to real time
applications. The focus is on finding an optimal characterization model which can achieve color confidence
across the display while reducing characterization time and effort. All models are created using a common,
single point, consumer measurement device and applied to two LC displays.
1 INTRODUCTION
Always rising computing power allows for promising
physically-based rendering systems with images even
described as spectral radiance distributions of light
(Pharr and Humphreys, 2004). Yet, the final quality
of these renderings is determined by the way output
devices display the simulated colors. For color criti-
cal applications, e.g., physically-based predictive ren-
derings in design review, it is essential that the dis-
play of an image produces the same color stimulus in
the observer’s mind as the spectral radiance distribu-
tion of the simulation intends. Color confidence in
this work refers to the colorimetric correct display of
color on LCDs within the boundaries of the device
gamut. As devices have different characteristics, dif-
ferent color stimuli result from the same color coor-
dinates on various devices. To specify color unrelated
to a certain device, device-independent color specifi-
cations exist, typically, the 1931 CIE XYZ standard
observer color system (CIE, 2004). The characteri-
zation of a device aims to infer a transformation be-
tween device-dependent RGB values and a device-
independent color space. For accurate colorimetric
reproduction of CIE XYZ values the inverse trans-
formation is required. The inverse model predicts
device-dependent RGB values needed to provoke the
same color sensation to the standard human observer
as the corresponding device-independent CIE XYZ
values.
Various characterization models exist which agree
on certain display characteristics and prerequisite di-
verse characterization tests to be conducted. The test
results provide information about the shortcomings of
a display and allow for the selection of an appropriate
characterization model in order to agree on the found
deficiencies.
Display characterization and in particular spa-
tial inhomogeneity correction is often neglected in
physically-based rendering applications but are im-
portant to achieve color confidence. By evaluating
important characterization tests this work proposes a
recommendation for selecting the most suitable char-
acterization model for a given device. Three charac-
terization models are employed, comprising further
display deficiencies in each case, and applied to two
LC displays. Since characterization needs plenty of
time and effort, the main focus is on the selection of
a model that needs the fewest measurements to be set
up while still allowing for precise colorimetric out-
put. We indicate the importance of correcting spatial
inhomogeneity and it is shown how all of the pre-
sented characterization models can be extended for
spatial characterization using the processing power of
the GPU, whereas a common, single point, consumer
measurement device is utilized.
173
Koch J., Henrich N. and Müller S. (2010).
SPATIAL COLOR CONFIDENCE FOR PHYSICALLY BASED RENDERING SETTINGS ON LC DISPLAYS.
In Proceedings of the International Conference on Computer Graphics Theory and Applications, pages 173-180
DOI: 10.5220/0002835001730180
Copyright
c
SciTePress

The content is structured as follows: In Section
2 we give a brief outline of related work on dis-
play characterization models including spatial inho-
mogeneity correction. Section 3 introduces LC dis-
play characteristics and the associated characteriza-
tion tests. Section 4 addresses the characterization
models and their extension to spatial inhomogeneity
correction. A strategy to choose the optimal inverse
characterization model for a certain display is pre-
sented in Section 5. Subsequently, Section 6 presents
the results of the applied characterization models and
Section 7 summarizes and concludes the contribu-
tion.
2 RELATED WORK
Day et al. (Day et al., 2004) describe the process
of characterization as modeling of the Optoelectronic
Transfer Function (OETF). The OETF specifies the
relationship between the digital input value used to
drive a display channel and the radiant output pro-
duced by that channel.
Fundamental characterization models include the
Piecewise Linear interpolation assuming Constant
Chromaticity coordinates (PLCC) model, models that
approximate the OETF by second-order polynomial
functions or power functions, the Piecewise Linear
interpolation assuming Variable Chromaticity coordi-
nates (PLVC) model, or Berns’ Gain-Offset-Gamma
(GOG) model (Berns et al., 1993a; Berns et al.,
1993b) for CRTs. Evaluations of these models were
presented by Post and Calhoun (Post and Calhoun,
1989; Post and Calhoun, 2000). They also stated
the importance of black correction (Post and Calhoun,
2000), whereas Day et al. presented a definition of the
different types of black light (Day et al., 2004). Black
correction can be incorporated in all characterization
models. PLCC and the function models assume chan-
nel independence and constant chromaticity coordi-
nates of the display’s color channels. Thereby the use
of the (3 x 3) primary transform matrix is justified for
the transformation from RGB to XYZ (Fairchild et al.,
1998; Thomas et al., 2008). On the contrary, PLVC
only assumes channel independence. Here, a single
(3 x 3) matrix cannot be applied due to the variable
chromaticity coordinates assumption. Fairchild and
Wyble tried to apply the GOG model to LCDs and
found it inadequate for colorimetric characterization
for research purposes (Fairchild et al., 1998). They re-
sulted in good performance when replacing the GOG
functions with 1D LUTs per channel to model the
OETF together with a black corrected color transform
matrix. Except for PLVC, the models are directly in-
vertible. An inversion of PLVC can be realized by
a geometrical backward transformation using a tetra-
hedral structure (Hung, 1992; Hung, 1993), as pro-
posed by Thomas et al. (Thomas et al., 2008). For
an in-depth review of existing characterization mod-
els we recommend a recent publication by Thomas et
al. (Thomas et al., 2008).
Spatial inhomogeneity refers to the lack of consis-
tency of a display’s output characteristics with respect
to different locations on the screen. A first approach
for spatial correction of luminance across a CRT mon-
itor has been introduced by Cook et al. (Cook et al.,
1993). Their method is limited to a maximum uni-
form luminance of the algorithm grid cell with the
lowest luminance, resulting in a gamut restriction for
the display. Sharma (Sharma, 2002) as well states
the importance of spatial inhomogeneity correction
for scientific applications and notes changes in lumi-
nance across the screen of up to 25%. He also refers
to the approach of Cook et al. Day et al. (Day et al.,
2004) comment on the importance of characterizing a
display at multiple positions and angles. They recom-
mend to perform two colorimetric characterizations
for paired comparison of images displayed side by
side.
Another research area is the correction of single-
(Hardeberg et al., 2003; Menu et al., 2005; Renani
et al., 2009) and multi-projector images (Majumder
and Stevens, 2002). Here, the perceived image is fur-
ther influenced by the projection screen. Instruments
as spatial radiospectrometers, colorimetric cameras,
as well as consumer cameras or even webcams are
used to correct spatial non-uniformities of the pro-
jector light as well as the projection screen. In this
work, we concentrate on LC displays using a single
point consumer color measurement device to achieve
spatial color confidence with a minimum of measure-
ments.
3 DISPLAY CHARACTERISTICS
Color confidence can only be achieved with a mini-
mum of time and effort if the appropriate display char-
acterization model is chosen. To determine a suitable
model for a given device, several tests are to be per-
formed in order to analyze the properties of the dis-
play (Fairchild et al., 1998; Day et al., 2004; Gib-
son and Fairchild, 2000; Berns, 1996). Since there
are various display characteristics which can be con-
sidered (Brainard et al., 2002), we focus on the ones
we think are the most critical to evaluate. We explic-
itly assume that additivity is given for a device, as
the models which account for channel dependencies
GRAPP 2010 - International Conference on Computer Graphics Theory and Applications
174

are rather complex, too inaccurate, or not readily in-
vertible and thus impracticable if an inverse model is
needed (Wen and Wu, 2006; Cho et al., 2006).
In this work, all tests are presented in reference
to LCDs, yet, they are also applicable for other ad-
ditive devices. The display devices being used are
a midrange model (Samsung SnycMaster 244T) and
a high-end model (NEC SpectraView 1690), in the
following being abbreviated Samsung and NEC. As a
measurement device a X-Rite i1-pro spectroradiome-
ter has been utilized. Measurements have been per-
formed in complete darkness.
Warm-up Phase. The back light of a LCD needs
time to warm up and stabilize. This is a prerequi-
site for an accurate characterization and it needs to be
tested when this state is reached. Our tests revealed
that display devices can have a warm-up phase of up
to 3 hours, much more then declared by the manufac-
turers.
Chromaticity Constancy. One of the main criteria
to evaluate before choosing a suitable display char-
acterization model is chromaticity constancy. Chro-
maticity constancy is the property of the primaries to
maintain their chromaticity coordinates regardless of
their intensities. When this criteria is fulfilled, sim-
ple characterization models only requiring a few mea-
surements can be applied. To identify chromaticity
constancy of the display primaries, RGB ramps can be
measured and the resulting CIE XYZ values are trans-
formed to chromaticity coordinates. Figure 1 shows
the plotted results for the red, green, blue, and com-
bined channels. Black correction (Post and Calhoun,
2000) can be employed to improve the results in order
that chromaticity constancy is fulfilled, as e.g., for the
NEC display.
Spatial Homogeneity. Spatial homogeneity refers
to the differences of a display’s color output at one
location on the screen compared to another location
on the screen. I.e., a certain configuration of R, G,
and B digital input values can result in different color
stimuli on various positions on the screen.
Spatial inhomogeneity can be examined by mea-
suring and comparing different colors or primary
ramps at different locations on the screen with respect
to their change in chromaticity coordinates and lumi-
nance, as well as differences in lightness, chroma,
and hue in CIE LAB. Figure 2 depicts the differ-
ences in lightness ∆L
∗
, chroma ∆C
∗
ab
, and hue ∆H
∗
ab
for 52 increasing intensity steps of the red channel
measured at the center of the screen compared to the
same measurements at the bottom right of the screen.
0
0.1
0.2
0.3
0.4
0.5
0.6
0.7
0.8
0.9
0 0.1 0.2 0.3 0.4 0.5 0.6 0.7 0.8
y
x
0
0.1
0.2
0.3
0.4
0.5
0.6
0.7
0.8
0.9
0 0.1 0.2 0.3 0.4 0.5 0.6 0.7 0.8
y
x
0
0.1
0.2
0.3
0.4
0.5
0.6
0.7
0.8
0.9
0 0.1 0.2 0.3 0.4 0.5 0.6 0.7 0.8
y
x
0
0.1
0.2
0.3
0.4
0.5
0.6
0.7
0.8
0.9
0 0.1 0.2 0.3 0.4 0.5 0.6 0.7 0.8
y
x
Figure 1: Chromaticity coordinates of the red, green, blue,
and combined channels. On the left without black correc-
tion; on the right with black correction (top: Samsung, bot-
tom: NEC).
Both, the Samsung and NEC show a rising difference
in lightness and chroma with increasing input inten-
sity. The Samsung e.g., has a maximum difference in
lightness of 7.16 ∆L
∗
and in chroma of 11.29 ∆C
∗
ab
.
Since lightness and chroma differences more or less
increase proportional, the ramps exhibit a constant
chroma-lightness difference ratio, meaning that col-
ors are more saturated at the center of the displays
with rising channel input values. The overall low hue
differences point out the almost hue constancy for the
different positions. Analyzing maximum luminance
differences, both displays vary between up to 45 to
50 cd · m
−2
across the screen. The other channels as
well as different measurement locations behave in a
similar way. From the results it can be inferred that
spatial inhomogeneity should be accounted for in dis-
play characterization models.
0
2
4
6
8
10
12
0 0.2 0.4 0.6 0.8 1
∆L
*
/ ∆C
*
ab
/ ∆H
*
ab
Relative DC
-1
0
1
2
3
4
5
6
7
0 0.2 0.4 0.6 0.8 1
∆L
*
/ ∆C
*
ab
/ ∆H
*
ab
Relative DC
Figure 2: Differences in lightness ∆L
∗
(gray), chroma ∆C
∗
ab
(green), and hue ∆H
∗
ab
(magenta) between 52 red channel
intensity steps measured in the middle and at the bottom
right of the screen (left: Samsung, right: NEC).
4 CHARACTERIZATION
MODELS AND STRATEGY
This section presents an overview of the inverse dis-
play characterization models that are considered in
SPATIAL COLOR CONFIDENCE FOR PHYSICALLY BASED RENDERING SETTINGS ON LC DISPLAYS
175

our proposed procedure to find the optimal charac-
terization model (see Figure 4). The characterization
models try to agree on different characteristics of a
device in order to model it adequately and to limit the
number of measurements. They have been selected to
sequentially build upon each other with respect to the
characteristics they agree on. Later on, we show how
all models are extended for spatial characterization by
utilizing contemporary graphics hardware.
Matrix and Gamma (MG) Model. This model is
subject to the most assumptions: It assumes that the
primaries of a display device are independent and ex-
hibit perfect chromaticity constancy. Furthermore,
this model is constraint to an OETF with the char-
acteristics of a power function, having an exponent of
the native gamma value of the display. With the help
of this model, the RGB values that reproduce a certain
CIE XYZ stimulus can be estimated as follows:
R
0
G
0
B
0
=
X
r,max
X
g,max
X
b,max
Y
r,max
Y
g,max
Y
b,max
Z
r,max
Z
g,max
Z
b,max
−1
X
Y
Z
, (1)
R
G
B
=
R
01/γ
G
01/γ
B
01/γ
, (2)
where (X
k,max
,Y
k,max
,Z
k,max
)
T
, k ∈ {r, g,b} denote the
CIE XYZ values measured for the red, green, and blue
primaries set to their maximum intensity. The first
step transforms a desired CIE XYZ stimulus to linear
R’G’B’ values. In the second step, the linear R’G’B’
values are transformed by a power function with the
reciprocal of the display’s gamma value as the expo-
nent to non-linear RGB values which are sent to the
framebuffer. Although the γ value can be different for
all three primaries, in consideration of the simplicity
of the model, only a single value has been used.
Matrix, Gamma, and Offset (MGO) Model. Dis-
plays often exhibit variable chromaticity coordinates
for different channel intensities. Black correction
(Post and Calhoun, 2000) accounts for this problem
up to a certain degree. This model assumes that after
black correction, the display’s primaries exhibit chro-
maticity constancy. Thus, Eq. (1) becomes:
R
0
G
0
B
0
= M
−1
X − X
0
Y −Y
0
Z − Z
0
, (3)
M =
X
r,max
− X
0
X
g,max
− X
0
X
b,max
− X
0
Y
r,max
−Y
0
Y
g,max
−Y
0
Y
b,max
−Y
0
Z
r,max
− Z
0
Z
g,max
− Z
0
Z
b,max
− Z
0
.
(4)
The light emitted when all primaries are set to zero is
given by (X
0
,Y
0
,Z
0
).
T
The second step in this model
is the same as in Eq. (2). If the measurement de-
vice is not capable of measuring the black light, it can
be estimated using methods proposed by Berns et al.
(Berns et al., 2003).
3D Tetrahedral LUT and Offset (3D LUT) Model.
If the displays primaries do not exhibit chromaticity
constancy (even after black correction) a model which
agrees on variations in chromaticity has to be applied.
We use a simplified version of the inverse model of
Thomas et al. (Thomas et al., 2008) which is based
on their forward PLVC model (Thomas et al., 2008)
to reduce the number of measurements.
Since the forward model is not directly invertible
analytically, a 3D LUT forms the basis of the inverse
model. Dividing the RGB axes in arbitrary steps and
summing up all combinations of RGB values estab-
lishes a grid in device-dependent (destination) space.
As channel independence and thus additivity is as-
sumed, the grid can also be constructed in device-
independent (source) space by summing up the CIE
XYZ tristimulus values of the measured RGB chan-
nel ramps in all combinations. Tetrahedral devision
after the model of Hung (Hung, 1992; Hung, 1993) is
performed on the grid in source and destination space.
Thus, a point in a tetrahedron in source space is lin-
early related to a point in the correspondent tetrahe-
dron in destination space by its barycentric coordi-
nates:
R
G
B
= M
RGB
· M
−1
XY Z
·
X − X
0
Y −Y
0
Z − Z
0
+
R
0
G
0
B
0
, with
(5)
M
RGB
=
R
1
− R
0
R
2
− R
0
R
3
− R
0
G
1
− G
0
G
2
− G
0
G
3
− G
0
B
1
− B
0
B
2
− B
0
B
3
− B
0
, and
M
XY Z
=
X
1
− X
0
X
2
− X
0
X
3
− X
0
Y
1
−Y
0
Y
2
−Y
0
Y
3
−Y
0
Z
1
− Z
0
Z
2
− Z
0
Z
3
− Z
0
,
where vector (R,G,B)
T
is the corresponding point
in destination space to the desired CIE XYZ stim-
ulus vector (X,Y,Z)
T
in source space. The matrix
components (X
k
,Y
k
,Z
k
)
T
and (R
k
,G
k
,B
k
)
T
with k ∈
{0,1,2,3} denote corresponding vertices of a tetrahe-
dron in source and destination space. The barycentric
GRAPP 2010 - International Conference on Computer Graphics Theory and Applications
176
coordinates α,β, and γ of a point (X,Y, Z)
T
in a tetra-
hedron are determined using Eq. 6:
α
β
γ
= M
−1
XY Z
·
X − X
0
Y −Y
0
Z − Z
0
. (6)
If all barycentric coordinates j ∈ {α,β,γ} lie in [0, 1]
the point is inside the tetrahedron. In order to be more
efficient, a bounding box approach has been used to
reduce the number of tetrahedra to be tested for point
inclusion. The downside of this approach is the in-
terpolation error, which is introduced since the shape
and size of the tetrahedra may change when trans-
forming the tetrahedra structure into the source space.
In order to achieve a more uniform grid in source
space, and therefore reduce the interpolation error,
Thomas et al. (Thomas et al., 2008) propose to opti-
mize the tetrahedral structure by a function describing
the generation of the 3D grid, whereby its parameters
are optimized using a globalized Nelder-Mead sim-
plex downhill algorithm.
GPU Assisted Spatial Characterization. One way
to extend all of the presented models for spatial char-
acterization is to perform the characterization inde-
pendently of each other at different locations on the
screen. By using this strategy, it is possible to ex-
ploit the maximum capabilities of the display device.
Furthermore, this approach is very well scalable and
could also be taken to the extreme by performing a
display characterization per pixel if a suitable mea-
surement device is available.
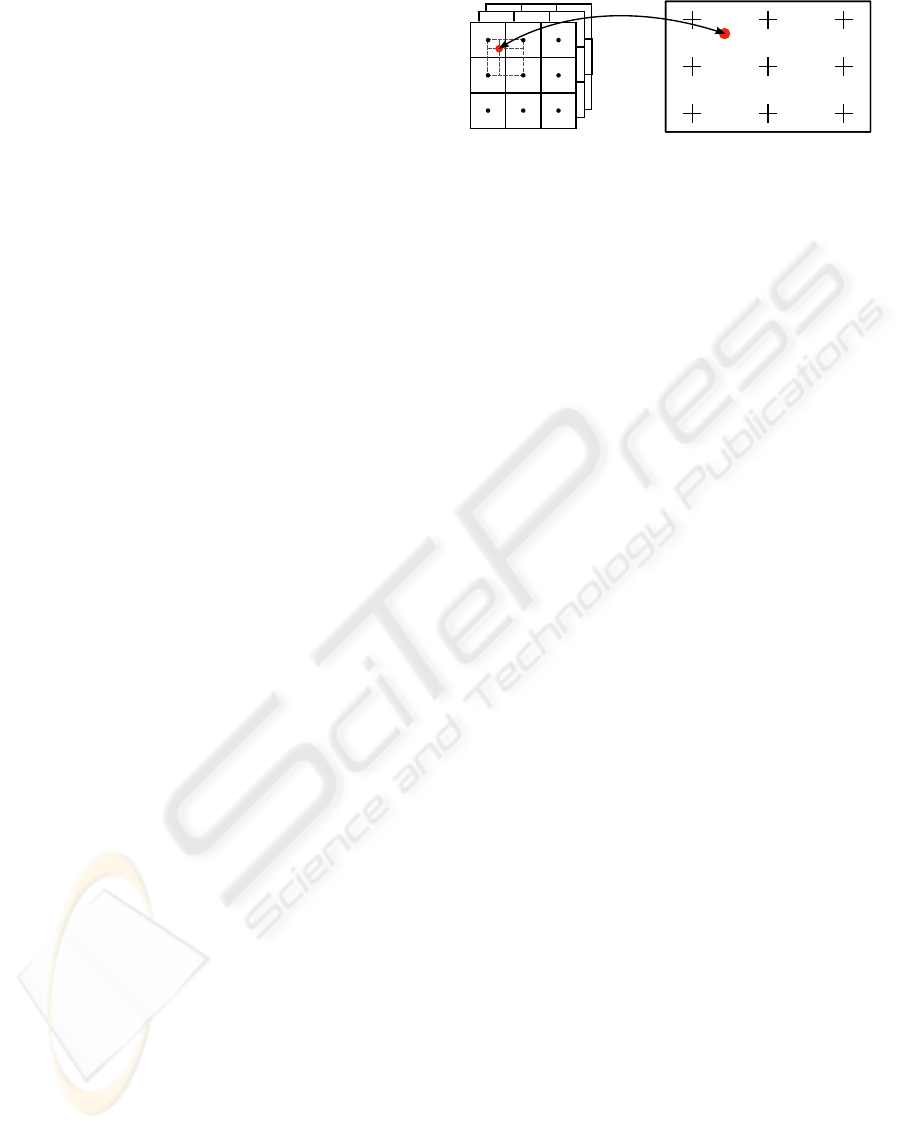
If a CIE XYZ value is to be displayed between
the locations for which the characterization was per-
formed, bilinear interpolation can be used to interpo-
late between the characterization data for these mea-
surement locations as depicted in Figure 3. For the
MG and MGO Model, interpolation can be performed
between the columns of the primary transform ma-
trix, each representing a CIE XYZ tristimulus value.
For the 3D LUT Model it is most feasible to interpo-
late between the final RGB values which result from
transforming the desired CIE XZY value at each of
the surrounding measurement locations. The interpo-
lation can be done straightforward with help of the
built-in texture interpolation of current graphics hard-
ware so that no additional computational costs occur.
For example, if the MGO model is used the data of
n×n measuring positions is written to textures of size
n × n. One texture for each row of the primary trans-
form matrix and one texture for the black value. If
the shader displays the image, it uses the current tex-
ture coordinate of each fragment to access the tex-
tures storing the calibration data. If bilinear filtering
1. 2.
4.
5.
7. 8. 9.
6.
3.
P
Figure 3: The characterization data of nine positions is writ-
ten to textures of size 3 × 3. If a pixel is displayed, the data
of the four nearest characterized locations (4,5,7 and 8) is
automatically interpolated with the help of the built-in bi-
linear texture interpolation.
is turned on, the graphics hardware automatically in-
terpolates the textures and the resulting values can be
used to evaluate Eq. 3.
We recommend to characterize nine positions on
the screen for the spatial characterization as shown in
Figure 3. This number of locations provides a good
coverage of the screen and also a good trade-off be-
tween the quality of the spatial characterization and
the time it takes to perform the measurements neces-
sary for the given characterization model.
5 MODEL SELECTION
STRATEGY
Display devices should be characterized at least once
a week if they are used for critical applications like
virtual design review. The goal is to find a model
which provides the best trade-off between quality and
measurement time. We propose to use the procedure
depicted in Figure 4 to determine the most suitable
characterization model for a particular device.
After the warm-up phase, the device has to be
tested for chromaticity constancy. If the device ex-
hibits chromaticity constancy, the MG Model can be
used. Otherwise, black correction should be em-
ployed. If this does not improve the results, the 3D
LUT Model needs to be used. In all other cases, the
MGO Model is most suitable. After determining the
characterization model, the display has to be tested
for spatial inhomogeneity. If present, spatial charac-
terization needs to be employed as described above,
otherwise, a global characterization at the center of
the screen is sufficient.
SPATIAL COLOR CONFIDENCE FOR PHYSICALLY BASED RENDERING SETTINGS ON LC DISPLAYS
177
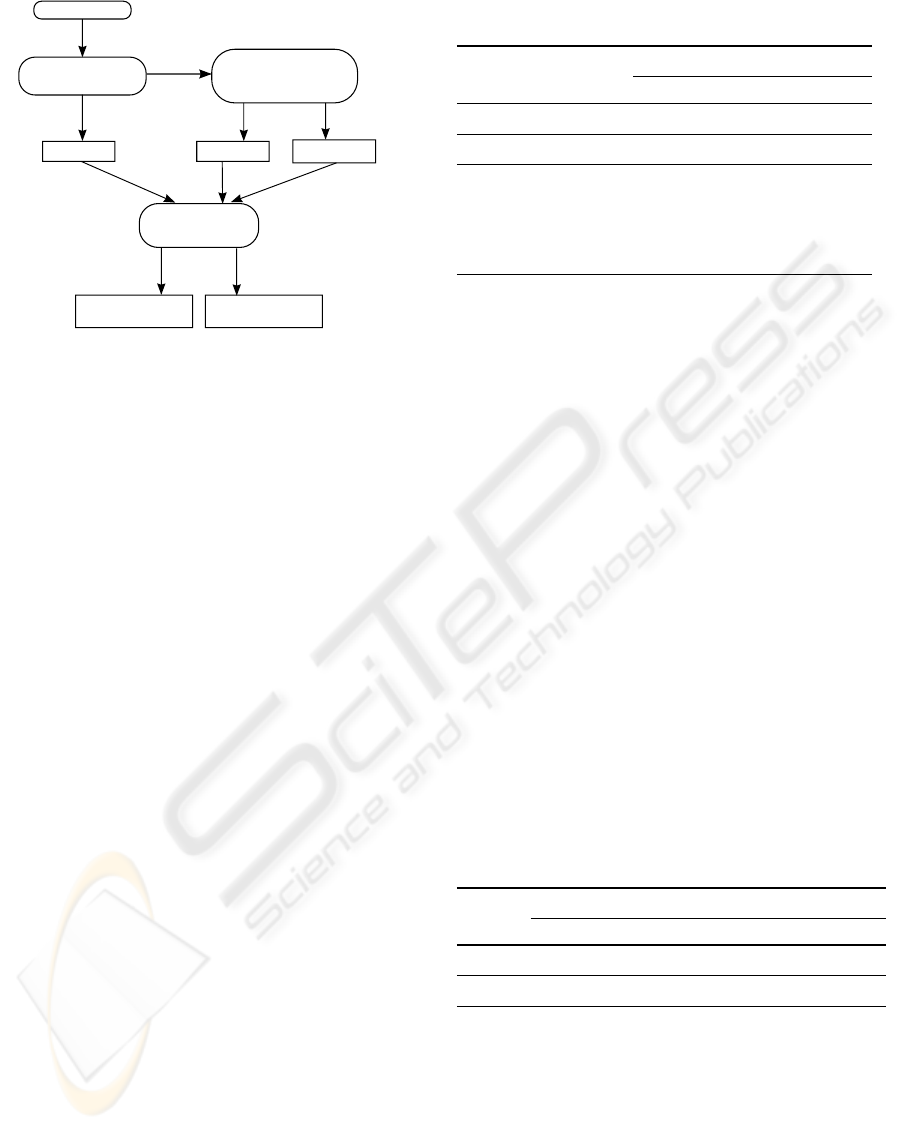
Global
characterization
Spatial
characterization
fullfilled not fullfilled
Test for
spatial homogeneity
fullfilled
not fullfilled
fullfilled not fullfilled
MG Model
MGO Model
3D LUT Model
Warm-up phase
Test for
chromaticity constancy
Test for
chromaticity constancy
applying black correction
Figure 4: A flow-chart describing the process of choosing
the optimal characterization model for a particular display
device.
6 RESULTS
We apply our proposed strategy (see Figure 4) to two
LC displays and show how an optimal characteriza-
tion for each of these displays can be found.
After the warm-up phase, the primaries of the dis-
play devices are tested for chromaticity constancy. As
illustrated in Figure 1, the assumption of chromaticity
constancy is not fulfilled by both devices. Thus, black
correction is employed. Afterwards, the primaries of
the Samsung device still do not exhibit chromaticity
constancy and the 3D LUT model is applied. For the
NEC, the MGO model is sufficient, since chromatic-
ity coordinates are constant (cf. Figure 1).
Global Characterization. In a first step, the test for
spatial inhomogeneity is ignored. The characteriza-
tion results for the center of the screen are shown to
demonstrate the applicability of the first half of the
proposed flow-chart.
The chosen characterization model is applied to
24 patches of absolute CIE XYZ tristimulus values
obtained by measurements of the ColorChecker. For
comparison, we applied all characterization models
to each display device and computed the CIE ∆E
∗
ab
color difference. The results are listed in Table 1. The
display characteristics already revealed that the Sam-
sung device does not exhibit chromaticity constancy
even after black correction, thus the CIE XYZ val-
ues could not be reproduced accurately with the MG
and MGO model. According to our proposed proce-
dure a model which accounts for variations in chro-
maticity constancy should be selected. The 3D LUT
model was able to reproduce the given CIE XYZ val-
Table 1: Results of the global characterization models.
Model LUT size ∆E
∗
ab
Samsung NEC
Av. Max. Av. Max.
MG - 4.92 8.49 1.61 2.67
MGO - 4.71 8.48 1.24 2.86
3D LUT
9 6.90 18.79 7.10 19.65
18 3.08 9.28 3.79 11.03
24 3.18 7.50 2.35 5.91
33 2.56 5.52 1.40 4.37
86 2.69 4.26 0.99 2.43
ues more precisely. The primaries of the NEC de-
vice exhibit chromaticity constancy after black cor-
rection and therefore the MGO Model was sufficient
for an excellent reproduction of the CIE XYZ tristim-
ulus values.
Spatial Characterization. The results of Section
3 revealed that spatial inhomogeneity is present on
both devices. Following our proposed procedure, the
characterization models have to be extended for spa-
tial characterization. We use nine different, equally
distributed positions across the screen for the spatial
characterization process. To test the performance of
our spatial characterization shader, the 24 patches of
the ColorChecker are shown at three positions on the
screen which seem to exhibit the greatest differences
on both devices.
Table 2 lists the results for the Samsung device for
which the 3D LUT model was extended for spatial
characterization.
Table 2: Spatial characterization results for the Samsung
(3D LUT Model). The column “Shader” indicates whether
spatial characterization was performed with the help of the
GPU or not.
Shader ∆E
∗
ab
Middle Bottom Left Bottom Right
Av. Max. Av. Max. Av. Max.
Off 2.24 4.27 5.36 8.31 8.70 12.57
On 2.47 4.95 2.50 5.28 2.65 4.60
The results reveal that color confidence across the
display can only be achieved if spatial characteriza-
tion is performed. For example, the bottom right
position has a mean ∆E
∗
ab
of 8.70 and a maximum
∆E
∗
ab
of 12.57 if the spatial characterization shader
is turned off. With spatial characterization enabled,
mean and maximum ∆E
∗
ab
drop to 2.65 and 4.60, re-
spectively. To visualize the results in another way,
Figure 5 depicts two luminance relief maps for Patch
11 of the ColorChecker. Without spatial characteri-
GRAPP 2010 - International Conference on Computer Graphics Theory and Applications
178

Spatial MGO Model
Global MG Model (sRGB)
Photograph
merge
Figure 6: Two LC displays were characterized with two different characterization methods. A picture was taken of the two
devices displaying the same CIE XYZ tristimulus image. The parts of the picture containing the output of the two displays
were merged. The spatial characterization was able to reduce the differences in the output.
0
0.2
0.4
0.6
0.8
1
x, rel. pixel
0
0.2
0.4
0.6
0.8
1
y, rel. pixel
30
35
40
45
50
Y, cd * m
-2
30
32
34
36
38
40
42
44
46
48
0
0.2
0.4
0.6
0.8
1
x, rel. pixel
0
0.2
0.4
0.6
0.8
1
y, rel. pixel
30
35
40
45
50
Y, cd * m
-2
41.5
42
42.5
43
43.5
44
44.5
45
45.5
46
Figure 5: Luminance relief map of Patch 4 of the Col-
orChecker with global characterization (top) and spatial
characterization (bottom) for the Samsung device. Mea-
surements were taken at nine different positions across the
screen.
zation the patch exhibits a maximum luminance dif-
ference of 15.71 cd · m
−2
across the screen. With
activated shader, the differences are reduced to 3.91
cd · m
−2
indicating that a luminance compensation
across the screen is achieved.
The results for the NEC device are shown in Table
3. Overall improvements become apparent since all
mean and maximum color difference values ∆E
∗
ab
are
hardly perceptible across the screen when the shader
is applied resulting in an excellent spatial characteri-
zation.
Table 3: Spatial characterization results for the NEC (MGO
Model). The shader state indicates whether spatial charac-
terization was performed with the help of the GPU or not.
Shader ∆E
∗
ab
Middle Top Left Top Right
Av. Max. Av. Max. Av. Max.
Off 0.78 2.07 2.62 4.04 3.29 6.72
On 0.84 2.22 1.88 2.79 1.17 2.34
Visual Comparison. If two displays are character-
ized successfully, the output of the same image on
both devices should be indistinguishable from each
other. We have conducted an experiment in which
such a visual evaluation is performed. A global and
a spatial characterization was applied to two LC de-
vices (NEC SpectraView 1690 and EIZO S2000). The
global characterization assumed that the two devices
adhere to the sRGB specification as stated in their de-
vice manuals. The appropriate model for spatial char-
acterization was chosen according to the proposed
strategy which suggested using the MGO Model and
nine different measurement locations. The displays
were positioned in a way so that a picture could be
taken of both displaying the same image that resulted
from a physically-based rendering system. An un-
characterized digital consumer camera has been used.
The images of both monitors were merged as illus-
trated in Figure 6. Please note that it is very hard
to reproduce such a visual comparison, as there are
many factors which alter the result (e.g., the response
curves of the digital camera, angular dependencies of
the displays, external flare, ...). Still, it is clearly visi-
ble that a spatial characterization yields in results su-
perior to a global characterization and is necessary to
achieve color confidence across the display and across
different devices.
7 CONCLUSIONS AND FUTURE
WORK
In this work, we introduced a strategy for selecting the
most suitable inverse display characterization model
for a given device by evaluating important character-
ization tests. The tests incorporate the evaluation of
a display’s warm-up phase, the behavior of the chan-
nels’ chromaticity at various input levels, the impact
of black correction, as well as spatial inhomogeneity.
SPATIAL COLOR CONFIDENCE FOR PHYSICALLY BASED RENDERING SETTINGS ON LC DISPLAYS
179

Furthermore, the need for spatial characterization has
been pointed out and a method has been proposed to
extend the presented characterization models for spa-
tial characterization. All of the models have been im-
plemented entirely on the GPU, making them applica-
ble to real-time applications. In addition, we showed
that spatial characterization can by employed by the
use of a single point consumer measurement device.2
For future work, we try to incorporate consumer
digital cameras as measurement device in order to
facilitate the process of spatial characterization and
make a per-pixel characterization of a display de-
vice feasible. Furthermore, we analyze if the recom-
mended strategy can be applied to other devices, e.g.
projection devices, or has to be extended. An eval-
uation of existing models that incorporate channel-
dependencies would also be an interesting task in or-
der to further improve color confidence for displays
with poor additivity characteristics and to integrate
such models in our proposed strategy.
REFERENCES
Berns, R., Motta, R., and Gorzynski, M. (1993a). CRT col-
orimetry. Part I: Theory and practice. Color Research
& Application, 18(5).
Berns, R., Motta, R., and Gorzynski, M. (1993b). CRT col-
orimetry. Part II: metrology. Color Research & Appli-
cation, 18(5).
Berns, R. S. (1996). Methods for characterizing crt displays.
Displays, 16(4):173 – 182. To Achieve WYSIWYG
Colour.
Berns, R. S., Fernandez, S. R., and Taplin, L. (2003). Esti-
mating black-level emissions of computer-controlled
displays. Color Research & Application, 28(5):379–
383.
Brainard, D., Pelli, D., and Robson, T. (2002). Display
Characterization. Encyclopedia of Imaging Science
and Technology.
Cho, Y., Im, H., and Ha, Y. (2006). Inverse characterization
method of alternate gain-offset-gamma model for ac-
curate color reproduction in display device. Journal
of Imaging Science and Technology, 50:139.
CIE (2004). CIE 15: 2004 Colorimetry. Vienna: Central
Bureau of the CIE.
Cook, J., Sample, P., and Weinreb, R. (1993). Solution to
spatial inhomogeneity on video monitors. Color Re-
search & Application, 18(5).
Day, E. A., Taplin, L., and Berns, R. S. (2004). Colorimetric
characterization of a computer-controlled liquid crys-
tal display. Color Research & Application, 29(5):365–
373.
Fairchild, M., , Fairchild, M. D., and Wyble, D. R.
(1998). Colorimetric characterization of the apple
studio display (flat panel lcd). In LCD), Munsell
Color Science Laboratory Technical Report, page
http://www.cis.rit.e.
Gibson, J. and Fairchild, M. (2000). Colorimetric charac-
terization of three computer displays (LCD and CRT).
Munsell Color Science Laboratory Technical Report,
40.
Hardeberg, J., Seime, L., and Skogstad, T. (2003). Colori-
metric characterization of projection displays using a
digital colorimetric camera. In Proceedings of SPIE,
volume 5002, page 51.
Hung, P. (1992). Tetrahedral division technique applied to
colorimetric calibration for imaging media. In Annual
Meeting IS&T, NJ, pages 419–422.
Hung, P.-C. (1993). Colorimetric calibration in electronic
imaging devices using a look-up-table model and in-
terpolations. Journal of Electronic Imaging, 2:53–61.
Majumder, A. and Stevens, R. (2002). LAM: Luminance
attenuation map for photometric uniformity in pro-
jection based displays. In Proceedings of the ACM
symposium on Virtual reality software and technology,
pages 147–154. ACM New York, NY, USA.
Menu, G., Peigne, L., Hardeberg, J., and Gouton, P. (2005).
Correcting projection display nonuniformity using a
webcam. In Proceedings of SPIE, volume 5667, page
364.
Pharr, M. and Humphreys, G. (2004). Physically Based
Rendering: From Theory to Implementation. Morgan
Kaufmann Publishers Inc., San Francisco, CA, USA.
Post, D. L. and Calhoun, C. S. (1989). An evaluation of
methods for producing desired colors on crt monitors.
Color Research & Application, 14(4):172–186.
Post, D. L. and Calhoun, C. S. (2000). Further evaluation of
methods for producing desired colors on crt monitors.
Color Research & Application, 25(2):90–104.
Renani, S., Tsukada, M., and Hardeberga, J. (2009). Com-
pensating for non-uniform screens in projection dis-
play systems. In Proceedings of SPIE, volume 7241,
page 72410F.
Sharma, G. (2002). LCDs versus CRTs-color-calibration
and gamut considerations. Proceedings of the IEEE,
90(4):605–622.
Thomas, J.-B., Colantoni, P., Hardeberg, J. Y., Foucherot, I.,
and Gouton, P. (2008). An inverse display color char-
acterization model based on an optimized geometrical
structure. In Society of Photo-Optical Instrumentation
Engineers (SPIE) Conference Series, volume 6807.
Thomas, J.-B., Hardeberg, J. Y., Foucherot, I., and Gou-
ton, P. (2008). The plvc display color characteriza-
tion model revisited. Color Research & Application,
33(6):449–460.
Wen, S. and Wu, R. (2006). Two-primary crosstalk model
for characterizing liquid crystal displays. Color Re-
search & Application, 31(2).
GRAPP 2010 - International Conference on Computer Graphics Theory and Applications
180
