
Motion and Single-trial Biosignal Analysis Platform for
Monitoring of Rehabilitation
Perttu Ranta-aho
1
, Stefanos Georgiadis
1
, Timo Bragge
1
, Eini Niskanen
1,2
Mika P. Tarvainen
1
, Ina M. Tarkka
3
and Pasi A. Karjalainen
1
Department of Physics, University of Kuopio, Kuopio, Finland
Department of Clinical Neurophysiology, Kuopio University Hospital, Kuopio, Finland
Department of Health Sciences, University of Jyvskyl, Jyvskyl, Finland
Abstract. Three-dimensional motion analysis is a powerful tool for the assess-
ment of human movements during different rehabilitation applications. An adap-
tive virtual reality rehabilitation environment which is based on modern motion
and biosignal analysis techniques is described.
1 Introduction
Noninvasive brain computer interface (BCI) has in the recent years become a highly ac-
tive research topic in neuroscience, engineering and signal processing. BCIs utilize neu-
rophysiological signals to interact with external devices and computers. Despite diverse
applications that BCI technologies promise, the general methodology may open new
opportunities for clinical rehabilitation, for example, by training patients with move-
ment disabilities to control abnormal activity in selected brain regions.
Stroke can affect physical, mental and social functions. Disability or paralysis is of-
ten affected only to one hemisphere, e.g. movements of one hand can be impaired while
the other hand remains intact. Some stroke survivors exhibit poor control of movement
smoothness [1], and movements seem to grow more smooth with recovery [2]. In mon-
itoring of rehabilitation of stroke patients, objective evaluation methods are required.
Furthermore, evaluation of the effectiveness of rehabilitation is also crucial. However,
at present monitoring can only be based on qualitative measures, such as visual inter-
preting of movements during specific tasks.
Three-dimensional motion analysis techniques can be a powerful and objective tool
for the assessment of human movements and it can be used to monitor rehabilitation
progress. With an adaptive task setting customized to individual patient’s needs and
performances, motion analysis can give valuable quantitativeinformation. Additionally,
combining 3D motion analysis techniques with neurophysiological signals could pro-
vide feedback for adaptive rehabilitation tasks, thus further improving the effectiveness
of the whole process. In this paper, a virtual, adaptive and controllable rehabilitation
environment which uses modern motion and biosignal analysis techniques in parallel is
described.
Ranta-aho P., Georgiadis S., Bragge T., Niskanen E., P. Tarvainen M., M. Tarkka I. and A. Karjalainen P. (2010).
Motion and Single-trial Biosignal Analysis Platform for Monitoring of Rehabilitation.
In Proceedings of the 1st International Workshop on Bio-inspired Human-Machine Interfaces and Healthcare Applications, pages 75-82
DOI: 10.5220/0002839100750082
Copyright
c
SciTePress

2 Multimodal Platform
Human motion, and thereby, performance in a specific rehabilitation task can be tracked
by using motion analysis methods. The physiological or neurophysiological status of
the patient, on the other hand, can be estimated from different biosignals acquired dur-
ing the rehabilitation task. By combining these modalities, a multimodal platform for
monitoring of rehabilitation can be constructed.
2.1 Motion and Performance Tracking
Motion analysis methods have been widely used to measure and model human move-
ments. Biomechanics can be considered as the base of modern motion analysis, which
aims for modeling of human body as a mechanical composition of joints and rigid
segments [3]. Motion analysis can be considered to consist of three components: kine-
matics, kinesiological electromyography (EMG) and kinetics. Kinematics examines the
motion of body segments from geometric point of view without paying attention to
forces producing the movements, whereas kinetics interlinks forces and movements
produced by the forces [4,5].
In human body modeling, the body is modeled as joints and bones, and in more
sophisticated models, also muscles and ligaments are included in the model. The kine-
matic 3D human body model describes the translational motion and orientation of dif-
ferent body parts. By using the model various parameters such as velocities and accel-
erations of body segments or joint angles can be derived for further analysis.
The most advanced methods in motion analysis, which can be used for modeling of
movements of the whole human body, are based on photogrammetric methods [6]. The
camera technology has advanced during last years. Cameras utilizing FireWire or Eth-
ernet interface are nowadays available at a reasonable price. Photogrammetry can be de-
fined as measurement of three-dimensional objects geometry through two-dimensional
images. In motion analysis the photogrammetric methods are utilized for determining
the temporal positions and orientations of body segments with help of markers attached
on the body. When the three-dimensional point of interest, e.g. a marker, is observed
simultaneously with at least two calibrated cameras, the 3D-coordinates of the point
can be solved.
We have developed and built a flexible mobile motion analysis laboratory which
consists of multiple high speed cameras, image processing system, biosignal and in-
ertial sensor measurement system and pressure insoles. The setup is suited for various
research projects as well as development of methods applied in motion analysis. As an
example, marker placements and marker trajectories for tracking of hand in rehabilita-
tion task is shown in Fig. 1[7].
In many applications, motion tracking is performed in real time. This opens new
possibilities for adaptive and interactivetask settings, especially in virtual or augmented
reality (VR or AR) applications.
2.2 Biosignal Analysis Platform for BCI Applications
Modeling brain’s activity following environmental stimuli or in the context of dynam-
ically changing tasks is crucial for better understanding the central nervous system
76

Fig.1. The placement of retroreflective markers attached to hand and trajectories of markers
reconstructed from a grabbing task. A reconstructed 3D-model of the hand [7].
(CNS). Ideally, methods for assessing brain’s ability to interact with the environment
should be computationally feasible, adaptive, and sensitive to cognitive changes. The
ultimate goal is to make joint inference about the CNS dynamics based on complemen-
tary information from multimodal data sets [8], by conducting experiments focusing on
adaptively changing cognitive tasks, such as time-varying workload and task difficulty.
Furthermore, various autonomic nervous system signals such as heart rate (HR), blood
pressure (BP) and galvanic skin response (GSR) are also important for phychophysio-
logical modeling and monitoring.
Electroencephalogram(EEG) providesinformation about neural dynamics on a mil-
lisecond scale. EEG’s ability to characterize certain cognitive states and to reveal patho-
logical conditions is well documented.A significant advantage of single-trial EEG anal-
ysis is that cortical reactivity and function can be assessed with high-temporal reso-
lution. However, the limited signal-to-noise ratio (SNR) of noninvasive brain signals,
makes the detection of single-trial events a difficult estimation task. Traditional way
of analyzing event related potentials (ERPs), or any other event-related biosignals, has
been to use heavy averaging, and thereby loosing significant inter-trial variability. Re-
cently, several methods for single-trial estimation of even related EEG have been pro-
posed [9–13].
Functional magnetic resonance imaging (fMRI) is another noninvasive method for
studying cognitive function by measuring the hemodynamic response related to neu-
ral activity in the brain. The blood oxygenation level dependent (BOLD) effect is used
for determining where activity occurs in the brain. The relationship between stimula-
tion, neural activation, and BOLD response has been studied since fMRI was intro-
duced. However, it is still not yet thoroughly understood. It has been found that the
shape of the BOLD response varies across subjects and also within subject depending
on the type of the stimulus and active brain area. Recently, BCIs based on single-trial
metabolic activity of the brain have been introduced, defining new opportunities in neu-
77
roscience research, for instance, for studying brain plasticity and functional reorganiza-
tion following sustained training [14]. Furthermore, simultaneous acquisition of EEG
and fMRI combined with single-trial analysis provides an additional monitoring tool
for the investigation of brain state fluctuations [15].
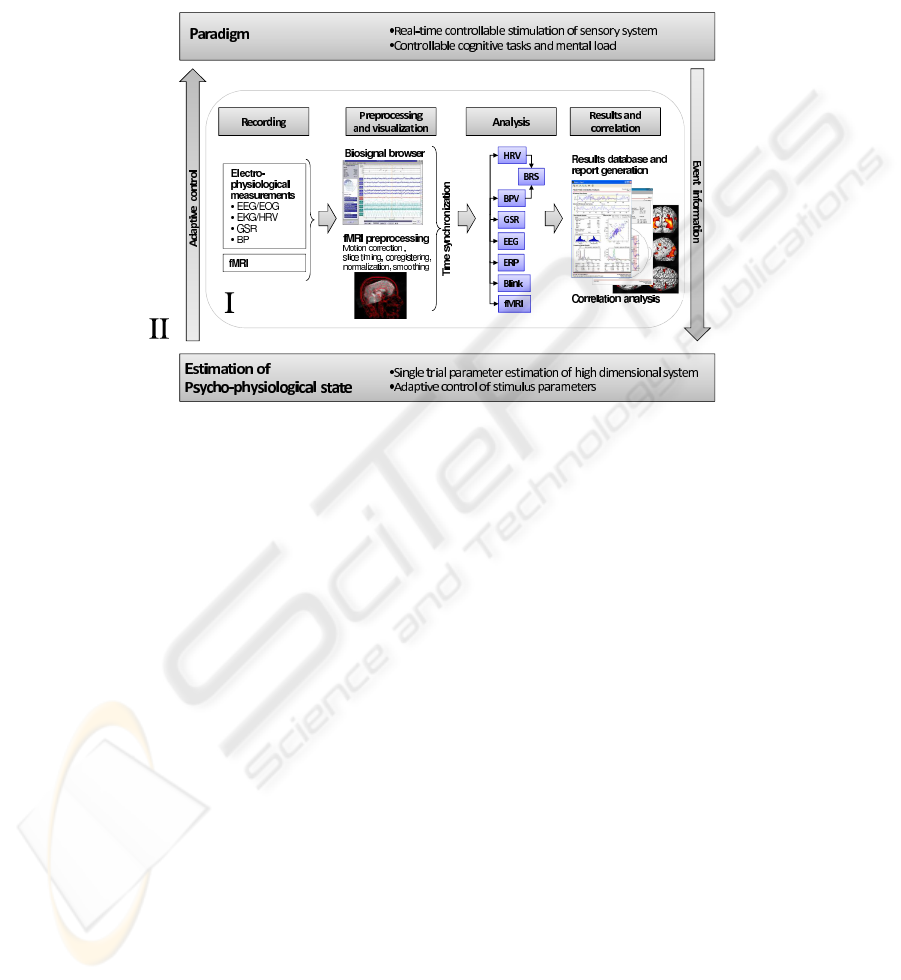
Fig.2. A closed-loop biosignal analysis system for BCI based on adaptive stimulation.
An illustration of a biosignal acquisition and analysis system for BCI applications
is given in Fig. 2. The system is operating in two phases, namely the signal acquisition
and parameter estimation phase, and the feedback and adaptive control phase. During
the first phase, all relevant signals are simultaneously recorded and synchronized in
relation to various tasks. Individual signals are preprocessed simultaneously or sepa-
rately, depending on the type of the signal and task, for accurate noise reduction. Then,
features of interest are extracted for visualization, extra analysis, or classification. This
procedure is performed by combining all information extracted from multimodal mea-
surements with all available prior information in a Bayesian mathematical framework.
In the second phase, event-related information is used to define and differentiate psy-
chophysiological states of the subject and subject’s performance. Finally, the extracted
parameters are used as a feedback to the subject, for instance as a visual feedback pro-
viding a reward mechanism or within a virtual reality environment. Furthermore, the
parameters can be directly used to adaptively change physical characteristics of the sen-
sory stimulation, for instance, type, intensity and duration of the next stimulus, or even
to control task difficulty for optimal subject’s performance, thus providing an adaptive
control mechanism.
Example 1: Dynamic Estimation of Event Related Potentials. An example of single-
trial estimation of evoked potentials is given in Fig. 3. In this example, measurements
78
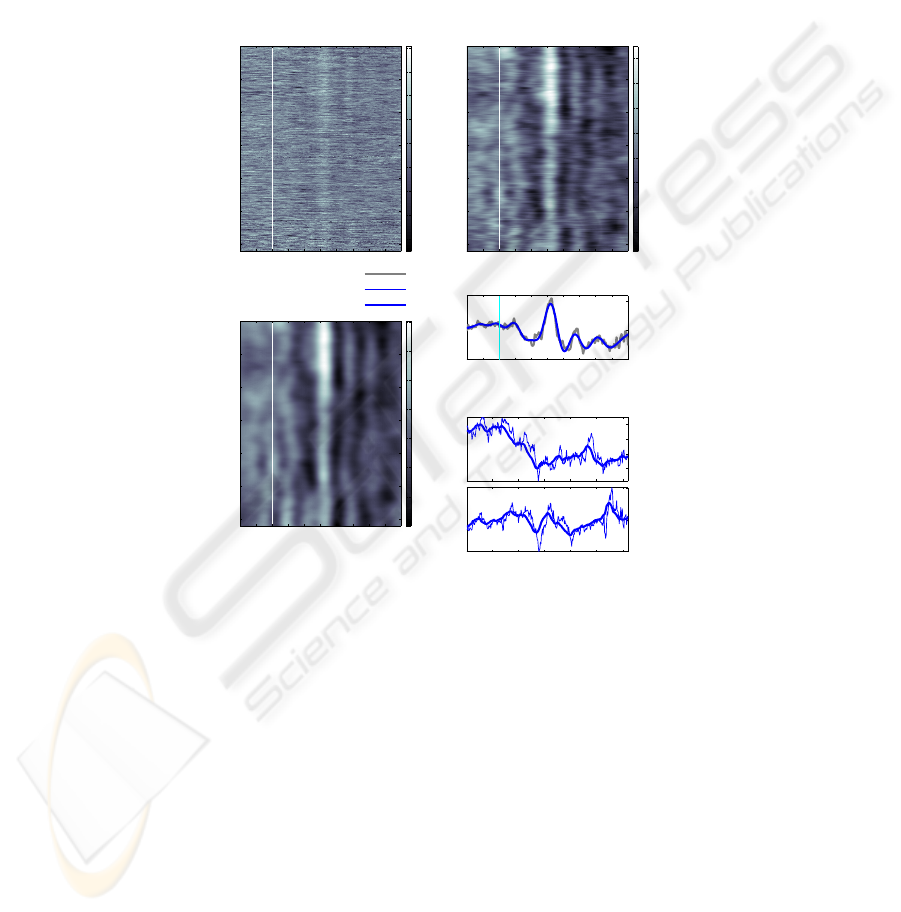
were obtained from an experiment with visual stimulation. A number of fixed intensity,
fixed duration flash stimuli were predefined and sequentially delivered to the subject
through a monitor. A decrease in amplitude of the dominant positive peak is clearly
observed, suggesting possible habituation to the stereotypic stimuli. For this particular
example, amplitude information can provide an indicator for the degree of habituation,
and thereafter used to adaptively change the stimuli characteristics in real time with
goal of forcing stable responses.
Visual stimulation (channel Oz)
µV µV
µV
Trial [t]
Time [s]
Measurements
−0.05 0 0.05 0.1 0.15 0.2 0.25 0.3 0.35
50
100
150
200
250
300
−40
−30
−20
−10
0
10
20
30
40
Trial [t]
Time [s]
Kalman filter
−0.05 0 0.05 0.1 0.15 0.2 0.25 0.3 0.35
50
100
150
200
250
300
−6
−4
−2
0
2
4
6
8
Trial [t]
Time [s]
Kalman smoother
−0.05 0 0.05 0.1 0.15 0.2 0.25 0.3 0.35
50
100
150
200
250
300
−4
−2
0
2
4
6
8
−0.05 0 0.05 0.1 0.15 0.2 0.25 0.3 0.35
−5
0
5
Amplitude [µV]
Time [s]
Averages
Measurements
KF
KS
2
4
6
8
Amplitude [µV]
Positive peak
50 100 150 200 250 300
0.15
0.16
0.17
Latency [s]
Trial [t]
Fig.3. Tracking single-trial characteristics (amplitude and latency) of evoked potentials during
visual stimulation with a Kalman filter based approach.
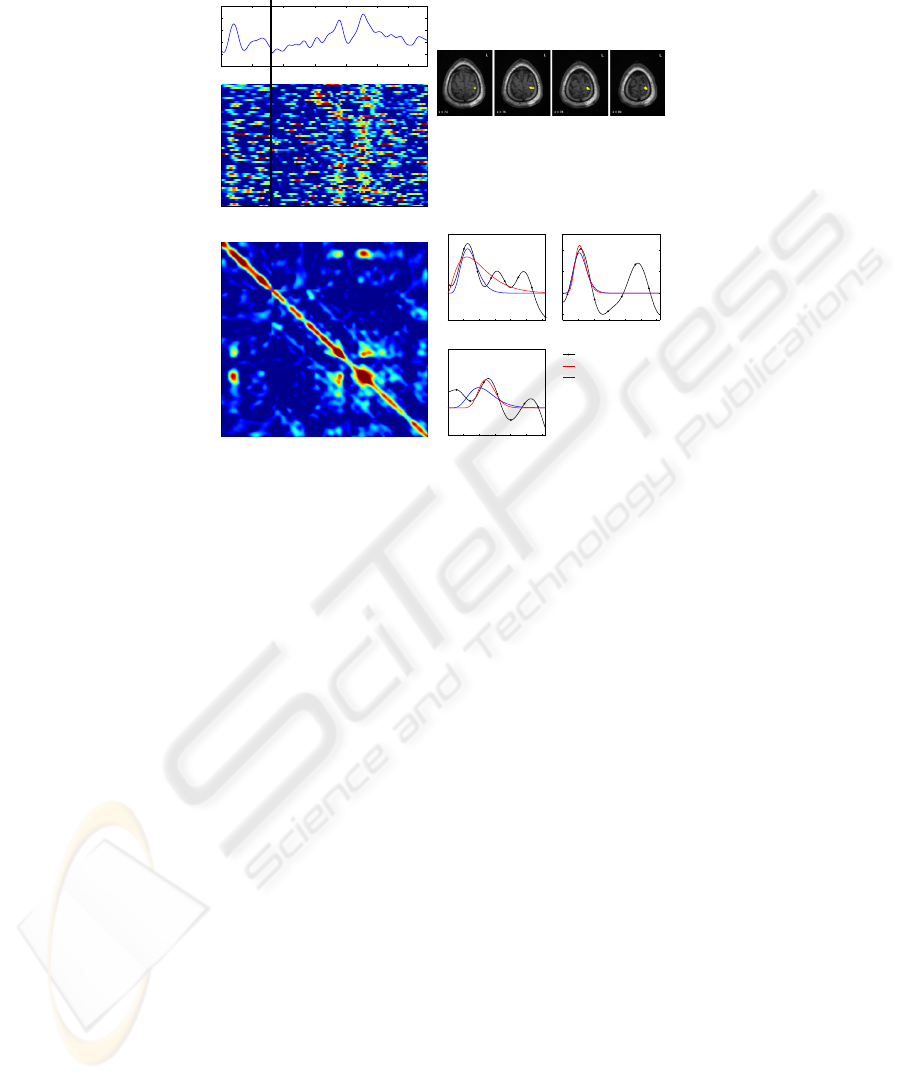
Example 2: Single-trial Estimation of Multimodal Brain Responses. In simultane-
ous fMRI/EEG studies, the necessity of single-trial approaches is recognized. Single-
trial EEG estimates are usually used as predictors for the voxel-wise activity. However,
most of the approaches do not take into account variation in the latency or shape of the
BOLD response. In Fig. 4, an example of single trial fMRI/EEG analysis is illustrated.
A set of simultaneous fMRI and ERP measurements was acquired, and in the approach
a joint model is defined and parameter estimates are obtained through subspace regu-
larization [16].
79
0 50 100 150 200 250 300
−1
−0.5
0
0.5
1
1.5
0 50 100 150 200 250 300
0
10
20
30
40
50
60
0 50 100 150 200 250 300
0
50
100
150
200
250
300
(a)
(b)
BOLD ERP
Measured BOLD
LS estimate
Regularized LS estimate
0 3 6 9 12 15 18
−1
0
1
2
Time (s)
0 3 6 9 12 15 18
−1
0
1
2
Time (s)
0 3 6 9 12 15 18
−1
0
1
2
Time (s)
Fig.4. Typical BOLD response estimates when reaction time locked ERP responses are used in
the regularization. (a) Concatenated data of the 62 BOLD responses and ERPs from channel Cz
(bottom) and mean of the data (top). The amplitudes of the data are arbitrary and x-scale is in
points. (b) Correlation matrix of the concatenated data.
Example 3: Dynamic Estimation of Heart Rate Variability (HRV). HRV is a re-
liable quantitative marker of ANS activity. HRV is typically assessed with a group of
time and frequency-domainmethods. By using these methods, the activities of the sym-
pathetic and parasympathetic branches of ANS can be evaluated, and thus, useful in-
formation of the (neuro)physiological state of the subject can be extracted. In Fig. 5,
dynamic HRV analysis corresponding to a sudden change in physiology caused by an
orthostatic test is shown. This example demonstrates how evident the changes in heart
rate and also in HRV characteristics can be in case of a change in physiology.
3 Virtual Rehabilitation Environment
Three-dimensional motion analysis techniques can be a powerful and objective tool
for the assessment of human movements and it can be used to monitor rehabilitation
progress. With an adaptive task setting customized to individual patient’s needs and
performances, motion analysis can give valuable quantitative information. Combining
3D motion analysis techniques with neurophysiological signals could provide feedback
for adaptive rehabilitation tasks, thus further improving the effectiveness of the whole
process. In order to be practically applicable, such asystem has to be highly automatized
80
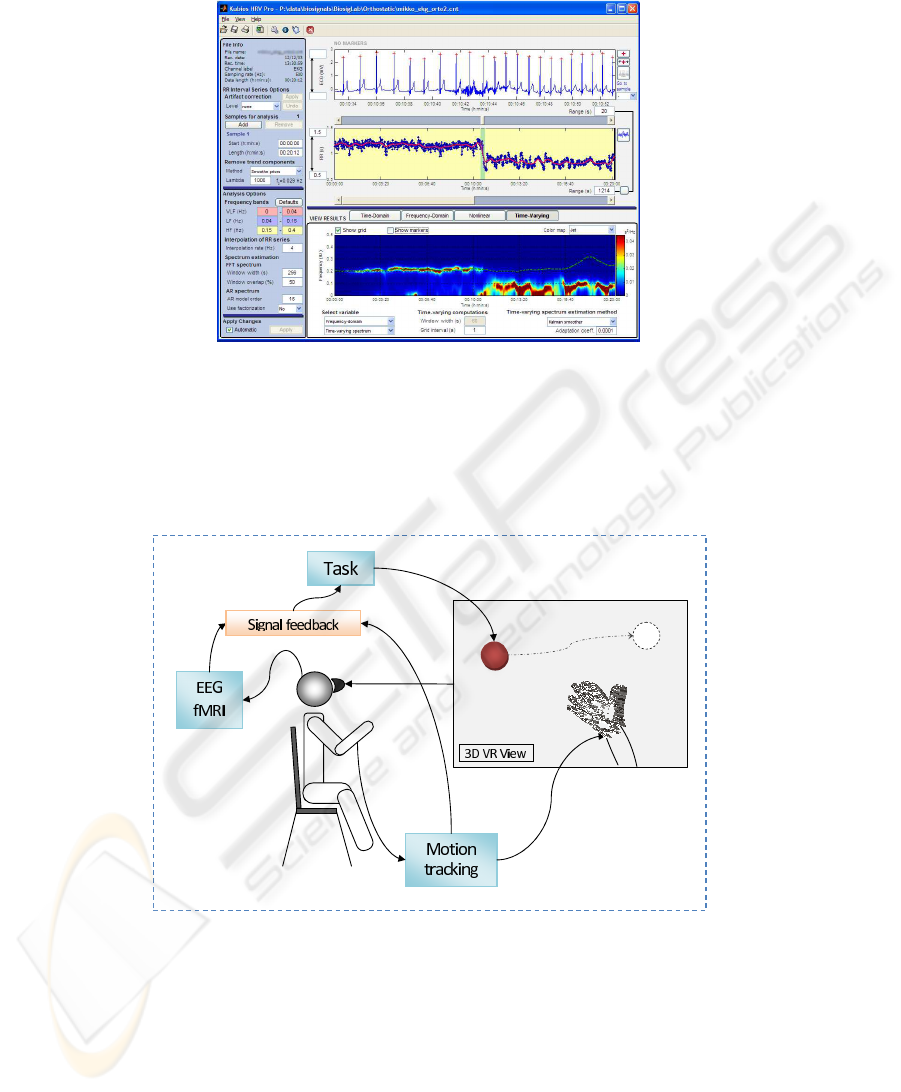
Fig.5. Tracking changes in HRV spectrum during an orthostatic test (standup test). Screen-shot
from Kubios HRV software [http://kubios.uku.fi].
and robust. Furthermore, a virtual reality environment (VRE) which can be applied to
various rehabilitation tasks will extend the applicability and performance of the system.
Fig.6. Schematic diagram of virtual rehabilitation environment.
The main components of VRE are real time motion tracker, three-dimensional VR
goggles and visualization engine, EEG and other biosignal measurement system and
adaptive signal feedback driven task control system. An example of such a VRE is
illustrated in Fig. 6. Such approaches, when utilized for rehabilitation or clinical appli-
81

cations, will enable more realistic and motivating tasks for patients. Finally, VR envi-
ronments are easily controlled and patient safe, e.g. crosswalk simulation.
References
1. H. Krebs, N. Hogan, M. Aisen, and B. Volpe, “Robot-aided neurorehabilitation.” IEEE Trans
Rehabil Eng, vol. 6, pp. 75–87, 1998.
2. B. Rohrer, S. Fasoli, H. Krebs, R. Hughes, B. Volpe, W. Frontera, J. Stein, and N. Hogan,
“Movement smoothness changes during stroke recovery,” The Journal of Neuroscience,
vol. 22, no. 18, pp. 8297–8304, 2002.
3. B. M. Nigg and W. Herzog, Biomechanics of the Musculo-skeletal System, 2nd ed. John
Wiley and Sons, 1999.
4. D. H. Sutherland, “The evolution of clinical gait analysis part II kinematics,” Gait & Posture,
vol. 16, pp. 159–179, 2002.
5. D. H. Sutherland, “The evolution of clinical gait analysis part III – kinetics and energy as-
sessment,” Gait & Posture, vol. 21, pp. 447–461, 2005.
6. R. Hartley and A. Zisserman, Multiple View Geometry in Computer Vision, 2nd ed. Cam-
bridge University Press, ISBN: 0521540518, 2004.
7. T. Bragge and M. Hakkarainen and M. P. Tarvainen and I. M. Tarkka and P. A. Karjalainen,
“A transportable camera based motion analysis system with application to monitoring of
rehabilitation of hand”, 11th International Congress For Medical Physics and Biomedical
Engineering, Munich, September 2009.
8. S. Debener, M. Ullsperger, M. Siegel, and A. K. Engel, “ Single-trial EEG/fMRI reveals the
dynamics of cognitive function,” Trends Cognit Sci, vol. 10, pp. 558–563, 2006.
9. P. A. Karjalainen, J. P. Kaipio, A. S. Koistinen, and M. Vauhkonen, “Subspace regularization
method for the single trial estimation of evoked potentials,” IEEE Trans Biomed Eng, vol. 46,
pp. 849–860, 1999.
10. P. O. Ranta-aho, A. S. Koistinen, J. O. Ollikainen, J. P. Kaipio, J. Partanen, and P. A. Kar-
jalainen, “Subspace Regularization method for the Single Trial Estimation of Multi Channel
Evoked Potential Measurements,” IEEE Trans Biomed Eng, vol. 50, 2, pp. 189–196, 2003.
11. M. P. Tarvainen, J. K. Hiltunen, P. O. Ranta-aho, and P. A. Karjalainen, “Estimation of Non-
stationary EEG with Kalman Smoother Approach: an Application to Event-Related Synchro-
nization (ERS),” IEEE Trans Biomed Eng, vol. 51, no. 3, pp. 516-524, 2004.
12. S. D. Georgiadis, P. O. Ranta-aho, M. P. Tarvainen, and P. A. Karjalainen, “Single-trial dy-
namical estimation of event related potentials: a Kalman filter based approach,” IEEE Trans
Biomed Eng, vol. 52, pp. 1397–1406, 2005.
13. B. Blankertz, R. Tomioka, S. Lamm, M. Kawanable, and K.-L. M¨uller, “Optimizing spatial
filters for robust EEG single-trial analysis”, IEEE Sig Proc Mag, vol. 25, pp. 41–56, 2008.
14. R. Sitaram, N. Weiskopf, A. Caria, R. Veit, M. Erb, and N. Birbaumer, “ fMRI Brain-
Computer Interfaces”, IEEE Sig Proc Mag, vol. 25, pp. 95-106, 2008.
15. C. S. Herrmann and S. Debener, “Simultaneous recording of EEG and BOLD responses: A
historical perspective,” Int. J. Psychophys, vol. 67, 3, pp. 161–168, 2008.
16. P. O. Ranta-aho and E. I. Niskanen and S. D. Georgiadis and M. Knnen and M. P. Tarvainen
and P. A. Karjalainen “Estimation of single-trial fMRI BOLD responses using combined
EEG and fMRI measurements”, Proc 30th Annu Int Conf IEEE EMBS, Vancouver, August,
2008.
82
