
A NEW IMAGE RE-COLORING METHOD
Hye-Yoon Woo and Hang-Bong Kang
Dept. of Digital Media, Catholic Univ. of Korea, 431- Yokkok 2-dong, Wonmi-gu, Bucheon Gyonggi-Do, Korea
Keywords: Color Transformation, Affection, Interactive Genetic Algorithm.
Abstract: In this paper, we propose a new method to transform colors in the image according to the user’s emotion.
First, we labeled the images into four basic emotions such as happy, sad, fear and anger from the users’
evaluation. After that, we compute color histograms using 36 quantized HSV scheme. After that, we
intersect color histograms and finally construct color templates for basic emotions. To reflect the user’s
preferences in color perception for specific emotion, we designed interactive genetic algorithm. First, we
generate first stage individuals using color templates from the input image. From them, we extract
chromosomes for HSV color space and then generate next stage individuals using crossover and mutation
operations. After a few number of iterations, we stop the process and extract personalized color templates
from the finalized image. Using personalized color templates, the user can generate an affection-based color
transformed image according to his own preference. Survey results show that desirable results are obtained
from our proposed personalized color templates.
1 INTRODUCTION
Colors are deeply related to our emotions and
feelings. For example, the color blue is associated
with comfort and yellow is perceived as cheerful
(Mahnke, 1996). In particular, if we can transform
colors in the contents interactively with the user’s
affection, it provides various tools for the intelligent
human computer interaction. So, it is desirable to
analyze color-emotion associations and implement
an effective method to reflect the user’s own
affection in the colors of the contents or media arts.
There have been several attempts to examine
color-emotion associations. Boyatzis and Varghese
found that light colors are associated with positive
emotions and dark colors reveal negative emotions
(Boyatzis and Varghese, 1994). Saito found that
black elicited both negative and positive responses
among Japanese subjects and that black was often a
preferred color among young people (Saito, 1996).
In this paper, we propose a new method to
transform colors in the image according to the user’s
affection. In particular, we construct affection-based
color templates to transform colors in the image
based on the user’s preferences using interactive
genetic algorithm. Section 2 discusses affection
analysis in color information. Section 3 presents
color transformation method according to user’s
affection and Section 4 discusses personalized color
templates using interactive genetic algorithm.
Section 5 shows our experimental results.
2 AFFECTION ANALYSIS IN
IMAGES USING COLOR
INFORMATION
To represent affective content, we use a two-
dimensional model used by Lang (Lang, 1995),
where the horizontal axis represents valence and the
vertical axis represents arousal. Valence refers to the
affective responses ranging from positive state to
negative state. Arousal refers to the responses
ranging from excited to the calm. Figure 1 shows
two-dimensional expression of four basic common
emotions such as fear, anger, sadness, and happiness
(Picard, 1997). Color information can also be
represented roughly in two dimensional emotion
space (Valdez and Mehrabian, 1994, Shreier and
Picard, 1999).
To analyze the relationship between basic
emotions and colors, we have performed the
empirical study on images. First, we showed 150
color images to 42 students and asked the students to
choose the appropriate color images for each
emotion. We labeled the images into four basic emo-
35
Woo H. and Kang H. (2010).
A NEW IMAGE RE-COLORING METHOD.
In Proceedings of the International Conference on Imaging Theory and Applications and International Conference on Information Visualization Theory
and Applications, pages 35-39
DOI: 10.5220/0002845100350039
Copyright
c
SciTePress
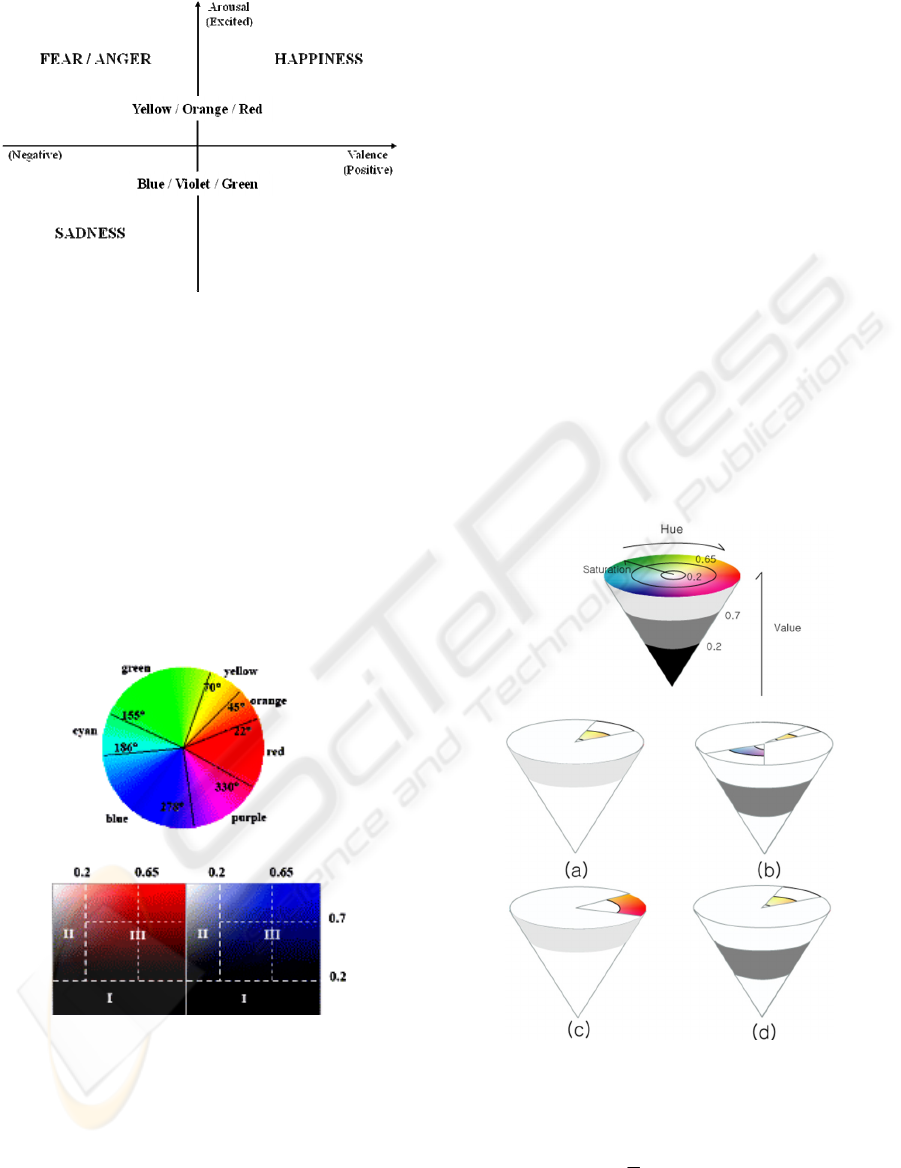
Figure 1: Two Dimensional Emotion Space.
tions such as happiness, sadness, fear and anger
(Picard, 1997). Secondly, we select most favorable
10 images for each emotion based on the survey
results we conducted in the first stage. From selected
color images, we compute histograms in HSV color
space. We used 36 quantization scheme as in Lei
(Lei et al., 1999) because this scheme shows good
performance in representing color based on human
perception. Figure 2 shows Hue and VS panel
quantization scheme. Hue is non- uniformly
quantized into the colors of red, orange, yellow,
green cyan, blue and purple from 0 to 360. In Figure
2, SV panels of two primary colors are shown.
Figure 2: Hue panel quantization (Top) and SV panel
quantization (Bottom).
For example, if V<= 0.2, region-I can be
perceived as a black area regardless of H and S. If
S<0.2, region-II is perceived as a gray area. It can
be quantized into 7 indices. Only region –III can be
perceived as a colored area. 4x7 indices are
obtained from region-III. Using 36 color
quantization scheme, we extract color histograms
from the given images for each emotion. Then, we
execute histogram intersection. Finally, we construct
HSV templates like Figure 3. These color templates
are similar to the color representation in Figure 1.
3 COLOR TRANSFORMATION
USING AFFECTION-BASED
COLOR TEMPLATES
Using affection-based color templates, we generate a
new color transformed image. Because we
constructed HSV color templates, the colors in the
image are transformed according to Hue, Saturation
and Value.
The re-coloring method of hue in images using
templates is similar to the one in Cohen-Or et
al.(Cohen-Or et al., 2006). We re-color the image by
shifting the hues according to the affection-based
hue templates so that transformed hues reside inside
the hue template.
Figure 3: HSV templates (HSV space (top), happiness,
sadness, fear, anger template (clockwise)).
The new hue value is computed by
||)))()((||1()()('
2
pCpHGpCpH
w
(1)
where C(p) is the central value of the sector
associated with the pixel, and w is the arc width of
IMAGAPP 2010 - International Conference on Imaging Theory and Applications
36

the template sector, and
G
is the normalized
Gaussian function with standard deviation σ.
According to the σ, the concentration of hues is
determined. In our implementation, we use
2w
for the best color balance.
To transform the saturation value in the image,
we shift the whole saturation histogram of the
image instead of shifting each pixel to generate
smoothed transformed image. From the saturation
histogram, we select the pixel value which has the
highest count as the representative saturation value.
The transform saturation value S’ is as follows.
1'0
)(*
max
S
and
SSwSS
tarcur
(2)
where
max
S
is the representative value,
tar
S
denotes
center value of the sector,
cur
S
is the current
saturation value and
w
is the weight ranging from 0
to 1.
To transform the brightness value, we implement
a non-linear characteristic function like Weber’s law.
The brightness value at pixel p is transformed by
255)
255
()(
1
p
pTp (3)
where in our implementation
is 2.0 for happiness,
0.4 for sadness, 0.5 for anger, and 0.3 for fear,
respectively.
4 PERSONALIZED COLOR
TEMPLATE USING
INTERACTIVE GENETIC
ALGORITHM
Usually, every person has different color preferences
for each emotion. So, it is desirable to modify the
color templates according to the user’s preference.
In this Section, we will discuss the personalized
color template using interactive genetic algorithm.
The interactive genetic algorithm is a Genetic
Algorithm where the evaluation part of it is
subjectively handled by a user (Sugahara et al.,
1998). Actually, the user’s preference cannot be
numerically quantified because it depends on the
perception of the user. So, optimization is performed
by human evaluation.
The chromosome representation of the color
image can be done by histograms of color space. For
example, each color image consists of three
chromosomes such as H, S and V which are shown
in Figure 4. For example, the chromosome of H
consists of 12 genes. Each gene carries numeral
information concerning the Hues at every 30 degrees
because Hue is represented by hue circle. The value
of each gene is computed from normalized
histograms. Saturation and Value chromosomes
consist of 10 genes whose values are computed from
histograms similarly to Hue.
The procedure of the constructing personalized
color templates with interactive genetic algorithm is
shown in Figure 5. The process of each stage is as
follows.
Generation of the first individual: From the
original image, we generate 7 individuals (or
color transformed images) from H, S and V
templates by using H, S, V, HS, HV, SV and
HSV transforms.
Evaluation: In response to each presented
individual, the user is asked to use buttons to
give evaluation based on his own subjective view.
The evaluation scores are used as fitness values
within the interactive genetic algorithm. In
addition, if the user select keep button, the
selected individual is transferred to the next
generation.
Termination: The procedure is terminated by the
user’s decision when the user finds a desirable
individual.
Selection: The tournament selection is used
where 2 individuals from the population are
randomly selected, leaving only those with the
highest fitness level.
Crossover: The crossover operation is executed
from mother and father and the crossover point is
determined by the mother and father’s fitness
value. For example, in Figure 6, the crossover
point is 8 because mother’s fitness value is two
times larger than father’s fitness value. From the
generated individuals, we construct Hue,
Saturation and Value templates like Figure 6 by
choosing large genes and converting them to the
H, S and V values.
Mutation: The gene values in H, S and V are
altered with 1 % rate. The altered values are
randomly decided by the system.
With the termination of the interactive genetic
algorithm, we obtain the desirable image. From this
image, we can extract chromosome information for
H, S and V. Finally, we can construct color
templates which reflected the user’s color preference
for each emotion. Using these templates, we can
generate personalized affection-based color
transformed images.
A NEW IMAGE RE-COLORING METHOD
37
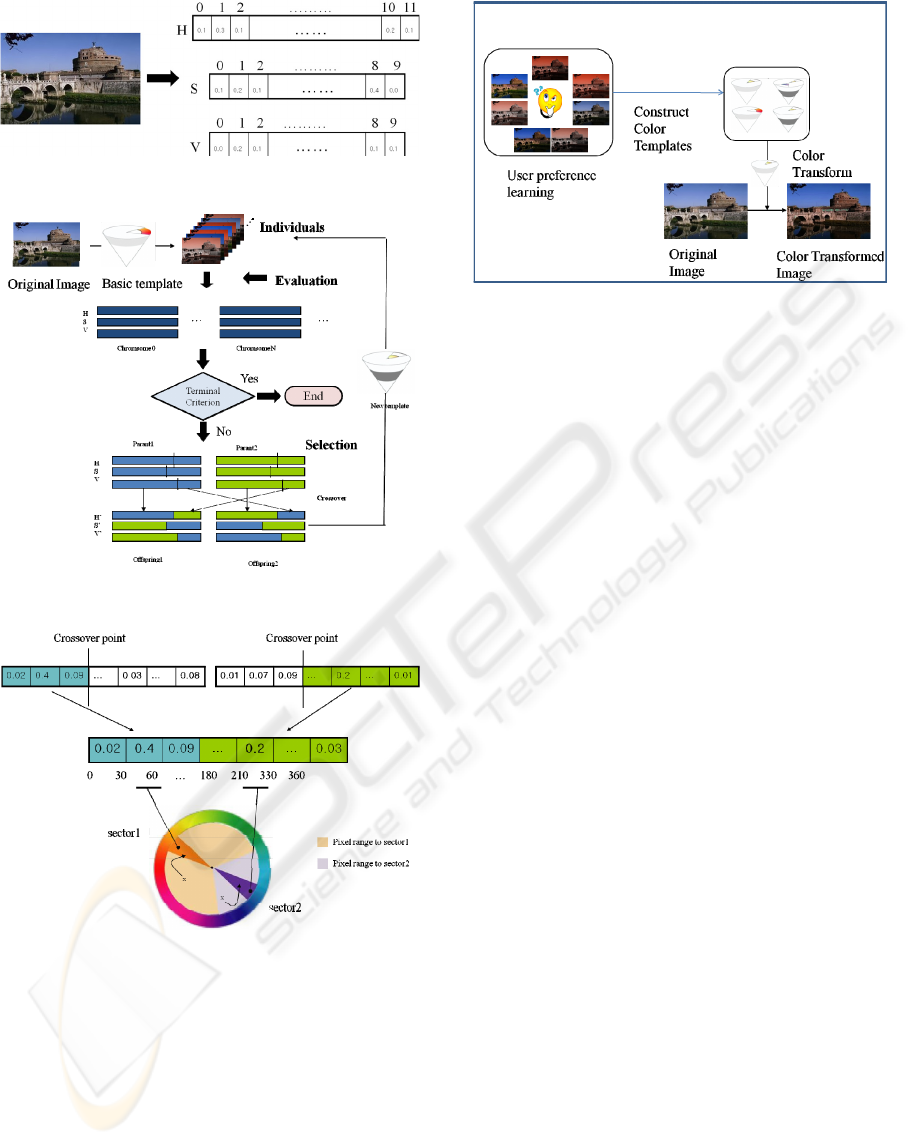
Figure 4: Three chromosomes of the image.
Figure 5: Interactive genetic algorithm procedure.
Figure 6: Crossover operation.
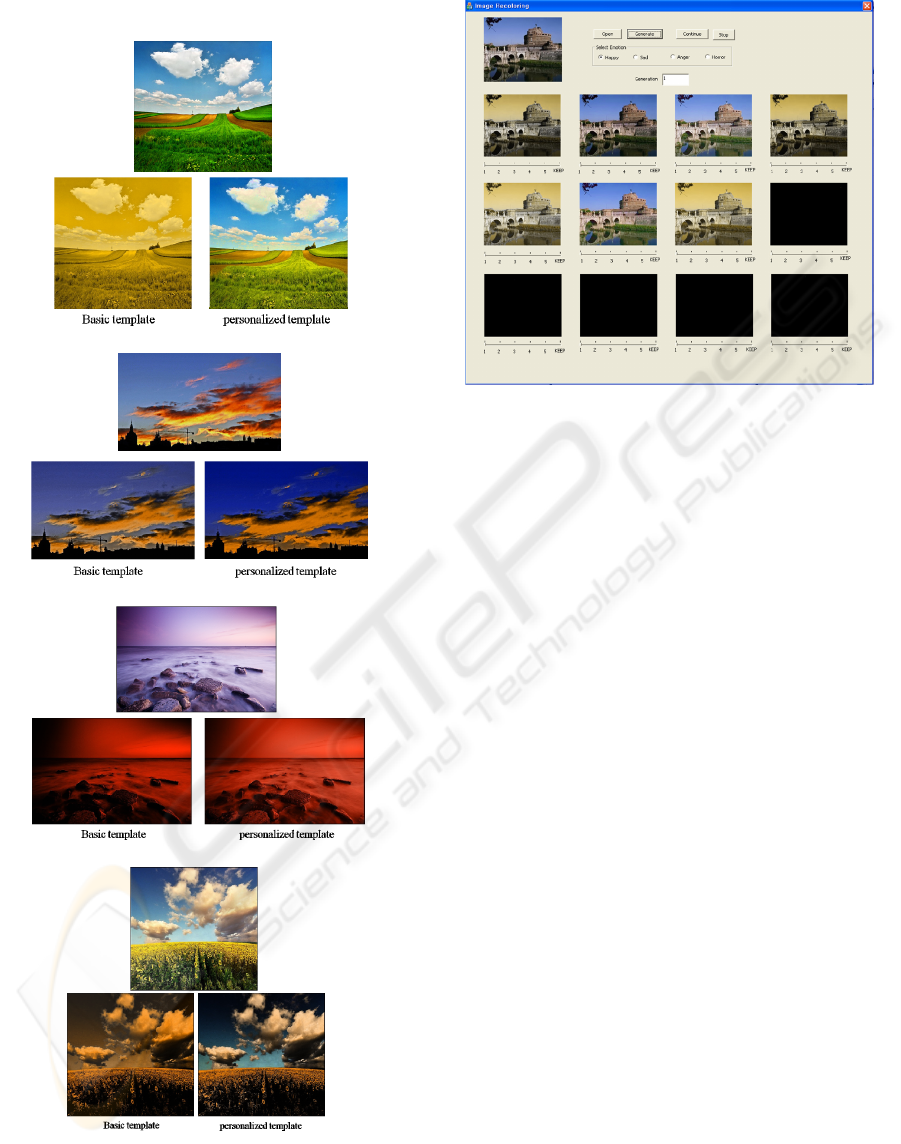
5 EXPERIMENTAL RESULTS
We implemented our method as shown in Figure 7.
First, we construct color templates of H, S and V for
basic emotions such as happiness, sadness, fear and
anger Figure 8 shows the results using color
templates. The results are checked with 32 students
and 25 students among them are satisfied with the
color transformed images. The satisfaction percenta
ge is 78% approximately.
Figure 7: Overview of the proposed method.
With these images, we experimented user’s
preferences using interactive genetic algorithm.
Figure 9 shows the user interface. The user inputted
his evaluation score from 0 to 5. If the user pressed
the keep button, the image is transferred to the next
stage. After a few number of iterations, the user
stopped and selected the most favorable image.
From that image, the modified color templates are
constructed. Using these templates, the color
transform is executed. Figure 8 shows the results
using personalized color templates. We also measure
the satisfaction for the generated image. After
testing 32 students, the satisfaction percentage is
rated as 84%. So, the satisfaction rate is increased
compared to the basic color templates. Desirable
results are obtained from our proposed personalized
color templates.
6 CONCLUSIONS
In this paper, we proposed new personalized color
templates to transform colors according to the user’s
affection. Based on the survey results from many
subjects, we construct basic color templates for each
emotion. After that, the user evaluates the generated
images from basic color templates. Based on the
fitness score, the images are selected using
tournament method and the offsprings are generated.
After iterating this process, the user stopped the
process if he finds his favorable image. From that
image, we construct color templates.
These modified templates reflect the user’s
preferences for color. Our experiments show
desirable results.
In the future, it is desirable to examine the
relations between color preferences according to
gender and age. In addition, cross-cultural research
could shed the light on the issues about how cultural
IMAGAPP 2010 - International Conference on Imaging Theory and Applications
38
differences vary in color-emotion associations.
(a) Happiness
(b) Sadness
(c) Anger
(d) Fear
Figure 8: Experimental Results.
Figure 9: User Interface.
ACKNOWLEDGEMENTS
This research is supported by Ministry of Culture,
Sports and Tourism(MCST) and Korea Culture
Content Agency(KOCCA) in the Culture
Technology(CT) Research & Development Program
2009.
REFERENCES
Boyatzis C. and Varghese R., 1994, Children’s emotional
associations with colors, Journal of Genetic
Psychology 155:77-85.
Cohen-Or, D., Sorkine, O., Cal, R., Leyvand, T. and Xu,
Y., 2006, Color Harmonization, ACM Transactions
on Graphics, Vol 25, no.3, 624-630.
Lang, P., 1995, The emotion probe: Studies of motivation
and attention, American Psychologist, 50(5), 372-385.
Lei, Z., Fuzong, L., and Bo Zhang, 1999, A CBIR method
based on color-spatial feature", TENCON 99, 166-169.
Mahnke, F., 1996, Color, environment, human response.
New York: Von Nostrand Reinhold.
Picard, R., 1997, Affective Computing, MIT Press.
Saito M., 1996, Comparative studies on color preference
in Japan and other Asian regions, with special
emphasis on the preference for white, Color Research
and Application 21 (1): 35-49.
Scheirer, J., and Picard, R., 1999, Affective Objects, MIT
Media lab Technical Rep. No 524.
Sugahara, M., Miki, M. and Hiroyasu, T., 2008, Design of
Japanese Kimono using Interactive Genetic
Algorithm, Proc. IEEE Conf. Sys. Man and Cyber.
Valdez, P. and Mehrabian, A., 1994, Effects of color on
emotions, Journal of Experimental Psychology:
General, 394-409.
A NEW IMAGE RE-COLORING METHOD
39
