
A GENDER RECOGNITION EXPERIMENT ON THE CASIA GAIT
DATABASE DEALING WITH ITS IMBALANCED NATURE
Ra
´
ul Mart
´
ın-F
´
elez, Ram
´
on A. Mollineda and J. Salvador S
´
anchez
Institute of New Imaging Technologies (INIT) and Dept. Llenguatges i Sistemes Inform
`
atics
Universitat Jaume I. Av. Sos Baynat s/n, 12071, Castell
´
o de la Plana, Spain
Keywords:
Gender recognition, Gait analysis, Class imbalance problem, Human silhouette, Appearance-based method.
Abstract:
The CASIA Gait Database is one of the most used benchmarks for gait analysis among the few non-small-
size datasets available. It is composed of gait sequences of 124 subjects, which are unequally distributed,
comprising 31 women and 93 men. This imbalanced situation could correspond to some real contexts where
men are in the majority, for example, a sports stadium or a factory. Learning from imbalanced scenarios
usually requires suitable methodologies and performance metrics capable of managing and explaining biased
results. Nevertheless, most of the reported experiments using the CASIA Gait Database in gender recognition
tasks limit their analysis to global results obtained from reduced subsets, thus avoiding having to deal with
the original setting. This paper uses a methodology to gain an insight into the discriminative capacity of the
whole CASIA Gait Database for gender recognition under its imbalanced condition. The classification results
are expected to be more reliable than those reported in previous papers.
1 INTRODUCTION
The perception of gender determines social interac-
tions. Humans are very accurate at recognizing gen-
der from a face, a voice or the manner in which an in-
dividual walks (gait). Nevertheless, in comparison to
a voice or a face, gait can be perceived at a greater dis-
tance. This particular issue has stirred up the interest
of the computer vision community in creating gait-
based gender recognition systems. In recent years,
this matter has become a hot research area in the com-
puter vision field (Yu et al., 2009; Li et al., 2008;
Huang and Wang, 2007). A number of applications
can benefit from the development of such systems,
for example, demographic analysis of a population,
access control, biometric systems, etc.
Apart from being successfully captured at a dis-
tance, gait has additional advantages with regard
to other biometric features: it is non-contact, non-
invasive and, in general, does not require subjects’
willingness. Nevertheless, there are important draw-
backs that make the implementation of a gait-based
gender classification system a hard challenge. For in-
stance, gait analysis is very sensitive to deficient or
incomplete segmentation of the subject silhouette, to
variations in clothing and/or footwear, to distortions
in the gait pattern produced by carrying objects or by
changes of mood, to walking speed, and so forth.
These sources of complexity have contributed to
the lack of public databases with a moderate or large
number of gait samples with enough diversity, and
also to the limited usefulness of the research done up
until now. Some of the few non-small-size datasets
available for benchmark purposes are listed in Ta-
ble 1. All of them are unequally distributed in terms of
the number of men and women, and they take into ac-
count some covariates that affect the manner of walk
(viewpoint changes, footwear and clothing changes,
walking surface changes, carrying conditions,etc).
In this work, the CASIA Gait Database (CASIA,
2005) is studied due to its availability and complete-
ness. Some works (Yu et al., 2009; Huang and
Wang, 2007; Lee and Grimson, 2002) have used this
database for gender recognition tasks. However, their
experiments have been formulated on the basis of
small subsets with an equal number of subjects per
class, giving results greatly dependent on singularities
of the subsets. In addition, they measured the classifi-
cation performance in terms of global accuracy, ignor-
ing individual class error rates and possible biased be-
haviours of the classifiers. Such practices make it im-
possible to evaluate the potential of the CASIA Gait
Database for gender recognition purposes considering
its true distribution and number of samples. This pa-
439
Martín Félez R., A. Mollineda R. and Salvador Sánchez J. (2010).
A GENDER RECOGNITION EXPERIMENT ON THE CASIA GAIT DATABASE DEALING WITH ITS IMBALANCED NATURE.
In Proceedings of the International Conference on Computer Vision Theory and Applications, pages 439-444
DOI: 10.5220/0002849204390444
Copyright
c
SciTePress
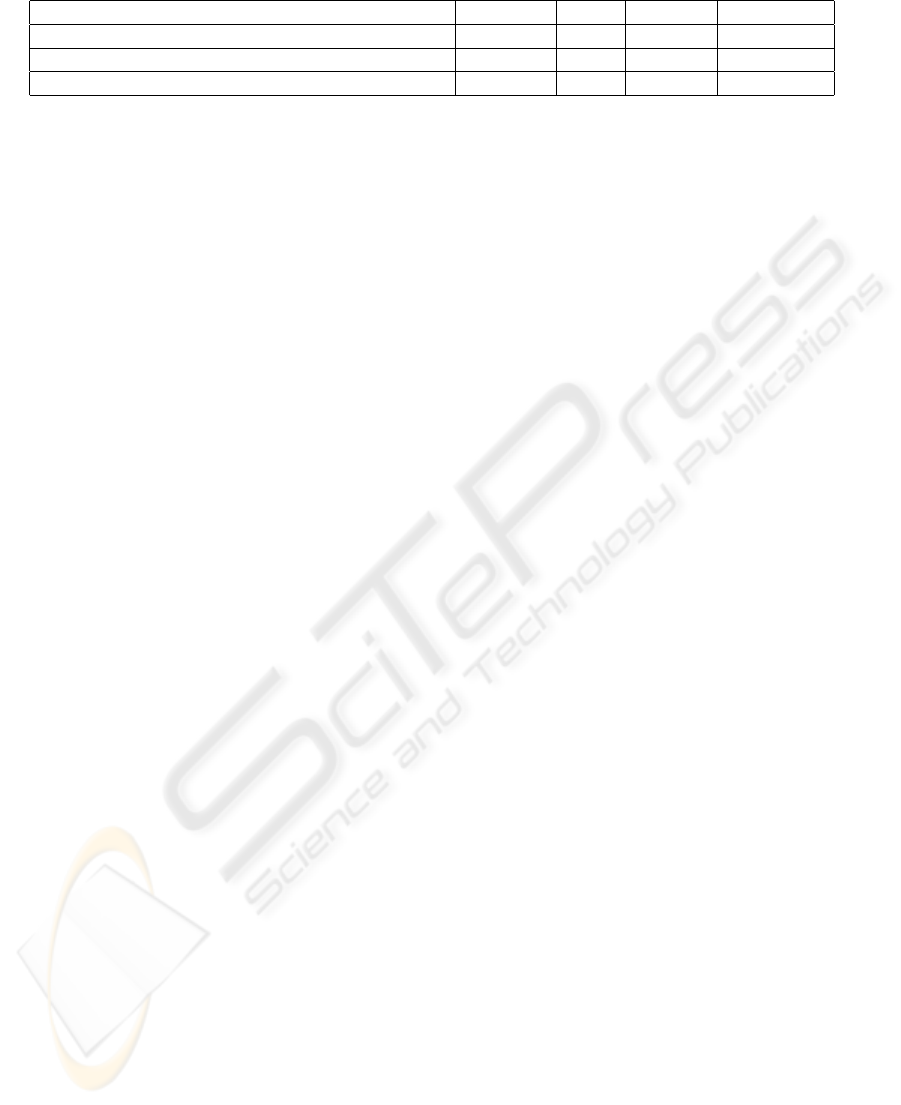
Table 1: Non-small-size gait databases.
Name #Subjects #Men #Women #Sequences
USF HumanID Gait Database (Sarkar et al., 2005) 122 85 37 1870
Soton Gait Large Database (Shutler et al., 2002) 100 84 16 2128
CASIA Gait Database (CASIA, 2005) - Dataset B 124 93 31 13640
per proposes a methodology to gain an insight into
the discriminative capacity of the whole CASIA Gait
Database for gender recognition. The classification
model consists of an ensemble of classifiers that suit-
ably deal with the imbalance of the training data. The
classification results, in terms of suitable performance
measures, are expected to be more reliable than those
reported in previous papers.
2 PREVIOUS WORK
There is a lot of research related to gait-based identifi-
cation, but only a few recent works use gait for gender
recognition.There are two different approaches to de-
scribe gait: i) dynamic features from subjects’ move-
ments (Davis and Gao, 2004; Yoo et al., 2005), and
ii) static attributes from the subject’s appearance (Lee
and Grimson, 2002; Huang and Wang, 2007; Yu et al.,
2009), which implicitly contain information about
his/her movements. The closer related works to this
paper lie in the last approach and are described below.
In (Lee and Grimson, 2002), static features that
describe the silhouette appearance of a human walk-
ing are used for person identification and gender
recognition. A segmentation process was applied to
video frames in order to extract human silhouettes,
which were then normalized regarding size and lo-
cation. To represent appearance, human silhouettes
were divided into seven regions that were fitted with
ellipses. To represent movement (changes in silhou-
ette poses across the frames), some parameters of
the ellipses that model the same region are averaged
across all the frames of a sequence, resulting in a set
of 57 attributes per sequence. Classification experi-
ments on the MIT Gait Database (MIT, 2001) lead to
an accuracy close to 80%.
A closely related work was presented in (Huang
and Wang, 2007), where the same research methodol-
ogy of (Lee and Grimson, 2002) was applied to a part
of the CASIA Database. A classification accuracy of
85% was obtained from averaging 200 runs with dif-
ferent pairs of training and test sets. From the 124
subjects (93 men and 31 women) available, 25 women
and 25 men were randomly selected for each training
set, while another 5 women and 5 men were chosen
for the corresponding test set. Apart from the previ-
ous result, this work proposes an information fusion
experiment in which decisions were based on three
different points of view: front, back and side view.
The gender recognition rate of the fusion scheme was
89.5%, which was higher than those results obtained
from the individual views.
Another recent study (Yu et al., 2009) proposed
a different appearance-based method for gait-based
gender recognition that was tested on the CASIA
Gait Database. Given a sequence of gait silhou-
ettes, a Gait Energy Image (GEI) is created by com-
bining them. The GEI is divided into 5 regions,
head/hairstyle, chest, back, waist/buttocks and legs,
which are weighted as regards a previous psychologi-
cal study. Experiments involved a single subset com-
posed of 31 women and 31 randomly selected men
that fed a Support Vector Machine with a linear ker-
nel. The best classification result was an accuracy
of 95.97%. Nevertheless, the use of only one sub-
set raises doubts about the reliability of the result, be-
cause of its dependence on the subset singularities.
3 METHODOLOGY
This paper proposes a methodology to gain an insight
into the discriminative capacity of the CASIA Gait
Database for gender recognition, considering all of its
samples (31 women and 93 men). The experimental
design involves all the samples in contrast to some
previous works (Huang and Wang, 2007; Yu et al.,
2009), where only reduced subsets composed of an
equal number of samples per gender were used.
The methodology has four main supports:
• Feature extraction: as in (Lee and Grimson,
2002), the average values across all frames of a
gait sequence of some parameters of seven el-
lipses that fit silhouette regions are used.
• Performance measures: this work uses well-
known unbiased measures to evaluate the classi-
fication effectiveness in imbalanced contexts.
• Classification model: an ensemble of classifiers is
proposed to manage the data imbalance.
• Evaluation of the classifier error: It is estimated
by a 10-fold cross validation repeated 10 times.
VISAPP 2010 - International Conference on Computer Vision Theory and Applications
440

The next subsections provide details of each of the
four items introduced above.
3.1 Feature Extraction
For feature extraction, the ellipse-fitting method pre-
sented in (Lee and Grimson, 2002) was used due to
the preliminary nature of this paper and the simplicity
of this method. In addition, it is also referenced in the
other two works (Huang and Wang, 2007; Yu et al.,
2009) that are the main works in which this paper is
based on. The process proposed in (Lee and Grimson,
2002) includes the following steps, as was introduced
in the previous section:
Foreground Segmentation. Each gait sample of the
CASIA Gait Database includes the gait video se-
quence and the corresponding set of frames with
the foreground segmented from the background.
These frames, where the silhouettes are high-
lighted, are used directly in order to make this
proposal more appropriate to be a benchmark for
future comparisons.
Silhouette Extraction. The bounding box that en-
closes all the silhouette pixels is located, and the
resulting reduced image is extracted.
Silhouette Regionalization. The silhouette is di-
vided into seven regions with fixed proportions:
head, chest, back, front thigh, rear thigh, front
calf/foot and rear calf/foot.
Ellipse Fitting. The shape of the foreground pixels
of each region is fitted with an ellipse. For details,
see Figure 1.
Feature Extraction. Four features per ellipse are ex-
tracted: the x and y-coordinates of the centroid,
the orientation of the major axis (α) and the as-
pect ratio (axis
1
/axis
2
). An extra global feature,
which consists of the quotient of the y-coordinate
of the silhouette centroid to the silhouette height,
is also considered.
Gait Representation. To represent the gait video
sample (changes in silhouette poses across the
frames), the mean and the standard deviation of
the four parameters of each ellipse are computed
across all the frames of the sequence. The eight
resulting features of each of the seven ellipses are
concatenated, along with the mean of the extra
global feature, to built a 57-dimensional vector.
3.2 Performance Measures for
Imbalanced Data Sets
A typical metric for measuring the effectiveness of
a learning process is the accuracy of the resulting
classifier over a test or validation set. For a two-
class problem, this index can be easily computed from
a 2 ×2 confusion matrix defined by the True Posi-
tive (TP) and True Negative (TN) cases, which are
the numbers of positive and negative samples cor-
rectly classified, respectively, and the False Positive
(FP) and False Negative (FN) cases, which are the
numbers of negative and positive samples incorrectly
classified, respectively. Accuracy is formulated as
Acc = (T P + T N)/(T P + FN + T N + FP).
However, empirical evidence shows that this mea-
sure can be strongly biased with respect to class im-
balance (Provost and Fawcett, 1997). This shortcom-
ing has motivated the search for new measures suit-
able for imbalanced contexts, for example, (i) True
Positive rate T Pr = T P/(T P + FN); (ii) True Neg-
ative rate T Nr = T N/(TN + FP); (iii) Geometric
mean Gmean =
√
T Pr ∗T Nr, that chooses models in
which both accuracies are high and balanced; and (iv)
Area Under the ROC Curve (AUC), which can be
computed as AUC = (T Pr +T Nr)/2 for a single clas-
sification result.
In this paper, TPr, TNr, Gmean and AUC are com-
puted along with Accuracy to provide enough per-
class knowledge of the classifier performance.
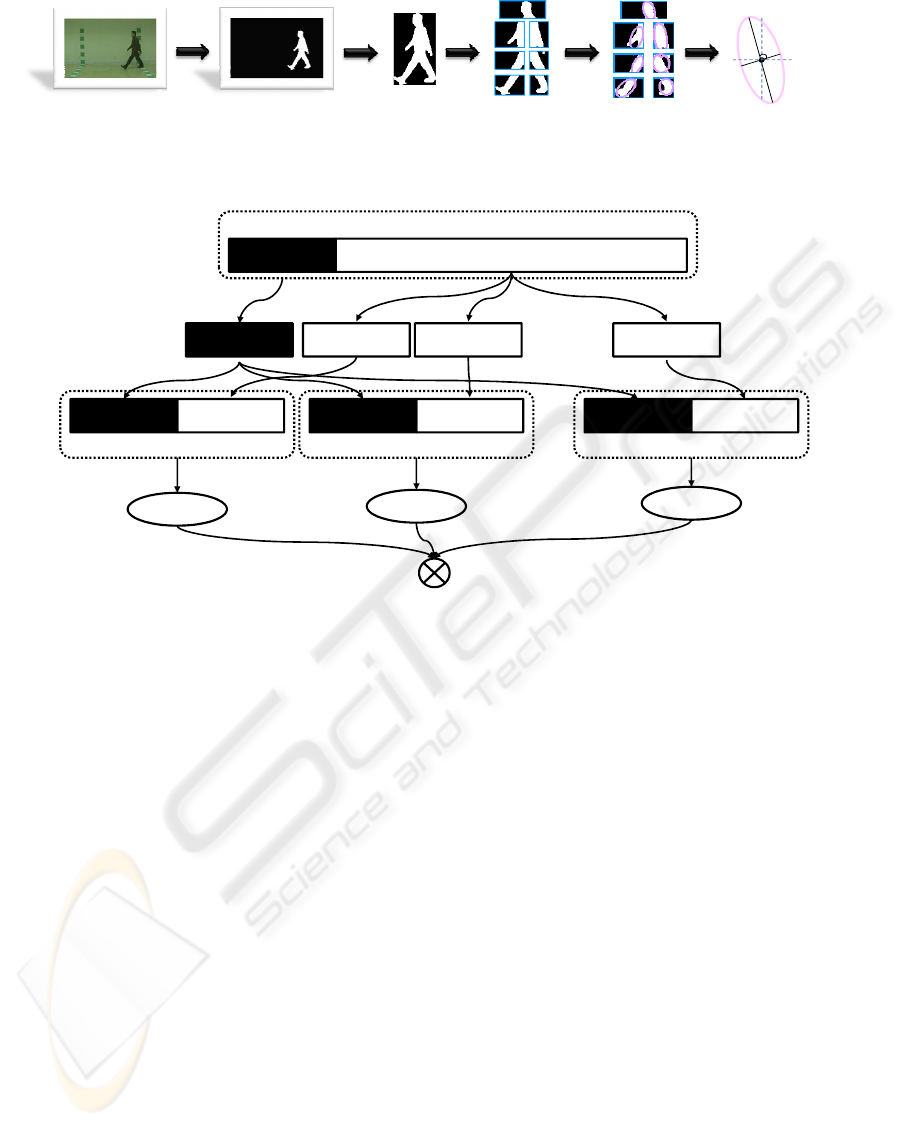
3.3 Classification Model
The classification model consists of an ensemble of
classifiers that can suitably deal with the imbalance
of the training data (Kang and Cho, 2006).
Given an imbalanced two-class training set, a
number of balanced subsets equal to the number of
base classifiers of the ensemble are generated. Each
subset contains all samples of the minority class and
as many randomly selected samples of the majority
class as were needed to obtain a balanced subset. The
ensemble combines, by majority voting, the individ-
ual decisions of base classifiers trained with the corre-
sponding balanced subsets. For details, see Figure 2.
In a gait-based gender recognition task, where
each person is usually represented by several se-
quences of gait frames, the previous process of subset
generation can be performed in two ways. The first
way is to balance the subset at person level, which
means that the same number of women and men are
randomly selected, and all their sequences joined to
form a new subset. It is worth noting that this subset
may not be exactly balanced with respect to the num-
ber of sequences of each gender. The alternative is to
balance at sequence level, which refers to the arbitrary
selection of an equal number of sequences from each
gender. Under this approach, the number of differ-
ent subjects represented in the subset by at least one
A GENDER RECOGNITION EXPERIMENT ON THE CASIA GAIT DATABASE DEALING WITH ITS
IMBALANCED NATURE
441
axis
1
α
axis
2
(
x,y
)
Video Frame
Foreground
segmentation
Silhouette
extraction
(
x,y
)
centroid
Feature
extraction
Ellipse fitting
Silhouette
Regionalization
Figure 1: Feature extraction process.
Women
gait sequences
Subset
1
Men
gait sequences
Subset
2
Men
gait sequences
Subset
j
Men
gait sequences
…
Men
gait sequences
Women
gait sequences
Imbalanced Training set
i
Women
Subset
1
Men
Women
Subset
2
Men
Women
Subset
j
Men
…
Ensemble of classifiers
SVM Classifier
i2
Balanced Training set
i1
Women
gait sequences
Subset
1
Men
gait sequences
Balanced Training set
i2
Women
gait sequences
Subset
2
Men
gait sequences
Balanced Training set
ij
Women
gait sequences
Subset
j
Men
gait sequences
…
…
SVM Classifier
i1
SVM Classifier
ij
Figure 2: Generation of an ensemble of SVM classifiers.
sequence is, in general, much greater than that num-
ber in the strategy at person level. In this paper, both
means of balance are implemented.
3.4 Error Evaluation Scheme
A 10-fold cross validation scheme that was repeated
10 times was used to estimate the recognition rates.
The application of a stratified division method re-
sulted in pairs of training and test partitions with dis-
tributions of samples per class similar to those of the
original dataset. Each imbalanced training subset was
used to feed an ensemble of classifiers described in
Section 3.3, which later performed a classification
session on the corresponding test subset. Algorithm 1
provides details of this process.
4 EXPERIMENTAL RESULTS
The aim of the experiments is to find out the actual ca-
pacity of the CASIA Gait Database for gender recog-
nition from side-view gait sequences. From the 124
people available, distributed into 31 women and 93
men, the gait sequences corresponding to the sub-
ject identified as 005 (a man) were discarded due to
their low number of frames with foreground informa-
tion and their intractable noise. From the remaining
123 subjects, and the 6 side-view sequences per in-
dividual, a collection of 738 sequences was created
with 186 and 552 samples from women and men, re-
spectively. Each sample was represented by a 57-
dimensional vector, as explained in Section 3.1.
Classification results are estimated by repeating
(10 times) a 10-fold cross validation scheme, which
involves an ensemble of 25 Support Vector Machines
(SVM) for managing the imbalance of the training
data. The number of classifiers chosen was 25 for
two reasons: i) 25 is an odd number, which avoids
ties, and ii) there is empirical evidence that more than
about 25 base classifiers does not provide, in gen-
eral, significant improvements to the ensemble accu-
racy (Bauer and Kohavi, 1999).
Three different experiments were designed.
Baseline. The imbalance is ignored and, thus, not
treated. The 10-fold cross validation uses a single
SVM (not an ensemble) fed by the imbalanced
training partitions (see Sections 3.3 and 3.4).
VISAPP 2010 - International Conference on Computer Vision Theory and Applications
442

Algorithm 1. Training/Classification algorithm.
for all training fold Tra
i
( i ∈ 1,10 ) do
for all classifier C
i j
in ensemble ( j ∈1,25) do
womenSubset
i j
← all sequences of all women
from Tra
i
if balancing at person level then
menSubset
i j
← all sequences of a number
of randomly selected men equal to the num-
ber of women from Tra
i
else if balancing at sequence level then
menSubset
i j
← a number of randomly se-
lected men sequences equal to the number
of women sequences from Tra
i
end if
Balanced
i j
← womenSubset
i j
∪ menSubset
i j
Train C
i j
with Balanced
i j
end for
for all sample
ik
in Test
i
( k ∈ 1,| Test
i
| ) do
for all trained classifier C
i j
in ensemble do
predLabel
ik j
← Classify sample
ik
on C
i j
end for
predLabel
ik
← Combine all predLabel
ik j
by
majority voting
Compare predLabel
ik
with actualLabel
ik
for
perfomance measures
end for
end for
Balanced Classes at Sequence Level. The imbal-
ance is managed. The 10-fold cross validation
performs with an ensemble of 25 SVM that
learn from balanced subsets at sequence level,
randomly drawn from the imbalanced training
partitions (see Sections 3.3 and 3.4).
Balanced Classes at Person Level. The imbalance
is managed. The 10-fold cross validation per-
forms with an ensemble of 25 SVM that learn
from balanced subsets at person level, randomly
drawn from the imbalanced training partitions
(see Sections 3.3 and 3.4).
The main difference between the second and third
experiment is that the number of men represented in
the balanced subsets by at least one sequence is, in
general, quite a lot higher in the second than in the
third, although the number of men sequences remains
the same. Therefore, the second experiment has more
diversity in the men class than the third one.
Averaged results of the 10 times 10-fold cross val-
idations are shown in Table 2. When focusing on clas-
sification accuracy, although the three results are very
similar, the baseline approach achieved better results
than the two other methods. However, this higher ac-
curacy hides a strong imbalance between the recog-
nition rates of the two classes, which are 78.4% and
98% for the women (TPr) and men (TNr) classes, re-
spectively. In the case of the two imbalance-sensitive
methods, the difference between both rates is much
more moderate due to a significant improvement in
the TPr, and a slight degradation of the TNr.
A joint view of these two rates is given by the
Gmean and AUC metrics, which compute unbiased
measures of the classifier performance. As regards
these metrics, the approach based on balanced classes
at person level produces results that are quite a lot bet-
ter than those of the baseline experiment. When the
two imbalance-sensitive methods are compared, the
one which balances at person level seems to be able
to better generalize because of the greater number of
sequences for each man represented.
A direct comparison between these results and
those from previous related works is not appropriate
because all of them are defined in terms of differ-
ent feature extraction strategies, classification models,
error evaluation schemes and training and test parti-
tions. Nevertheless, their main gender recognition re-
sults on the CASIA Gait Database are shown here to
allow for a broader analysis of results. These works
presented their classifier performance only in terms
of accuracy, and these results are very close to those
introduced in this paper: 85% from (Lee and Grim-
son, 2002), 89,5% from (Huang and Wang, 2007)
and 95.97% from (Yu et al., 2009). However, as was
demonstrated above, accuracy is not a reliable mea-
sure in imbalanced scenarios.
5 CONCLUSIONS
An exhaustive study designed to evaluate the capacity
of the CASIA Gait Database for gender recognition
tasks was carried out. This dataset contains gait sam-
ples from 124 subjects, distributed in an unbalanced
way with 31 women and 93 men. To our knowledge,
the papers that have previously worked on this collec-
tion have avoided dealing with its imbalanced nature
by using reduced balanced subsets. Therefore, there
seems to be no previous results considering the whole
dataset for benchmark purposes.
This paper proposes a methodology to learn from
the CASIA Gait Database while dealing with its im-
balanced complexity, and to suitably evaluate the ef-
fectiveness of the resulting classifier. In particular, a
distributed learning approach within a classifier en-
semble, and some metrics to appropriately measure
the classification performance in an imbalanced con-
text, like AUC and the geometric mean of per-class
A GENDER RECOGNITION EXPERIMENT ON THE CASIA GAIT DATABASE DEALING WITH ITS
IMBALANCED NATURE
443

Table 2: Experimental results.
Measure/Experiment Baseline Balancing At Sequence Level Balancing At Person Level
Accuracy 93.1% ±0.77% 92.1% ±0.61% 91.8% ±0.56%
TPr 78.4% ±1.92% 84.5% ±1.2% 87% ±1.55%
TNr 98% ±0.59% 94.6% ±0.53% 93.4% ±0.5%
Gmean 87.6% ±1.17% 89.4% ±0.79% 90.1% ±0.86%
AUC 88.2% ±1.07% 89.6% ±0.77% 90.2% ±0.84%
success rates were considered.
The imbalance-sensitive approach was compared
with a plain method based on a single classifier. When
the global classification accuracy was used, the results
of both strategies were very similar but, when AUC
and Gmean were considered, the proposed strategy
was significantly better. This result can be explained
by scrutinizing the recognition rates per class since
the proposed approach improved this rate quite a lot
for the women/minority class, while the rate for the
men/majority class was only slightly reduced.
Regarding the use of the whole CASIA Gait
Database through its own silhouette frames and the
application of standard methods of learning and error
estimation, the strategy proposed here could become a
good benchmark for future comparisons of gait-based
gender recognition. This preliminary work could be
improved by using that strategy on more databases,
with other classifiers and taking into account other
feature extraction methods.
ACKNOWLEDGEMENTS
Partially funded by projects CSD2007-00018 and CI-
CYT TIN2009-14205-C04-04 from the Spanish Min-
istry of Innovation and Science, P1-1B2009-04 from
Fundaci
´
o Caixa Castell
´
o-Bancaixa and grant PRE-
DOC/2008/04 from Universitat Jaume I. Portions
of the research in this paper use the CASIA Gait
Database collected by Institute of Automation, Chi-
nese Academy of Sciences.
REFERENCES
Bauer, E. and Kohavi, R. (1999). An empirical comparison
of voting classification algorithms: Bagging, boost-
ing, and variants. Mach. Learning, 36(1-2):105–139.
CASIA (2005). CASIA Gait Database.
http://www.sinobiometrics.com.
Davis, J. and Gao, H. (2004). Gender recognition from
walking movements using adaptive three-mode PCA.
In IEEE CVPR, Workshop on Articulated and Non-
rigid Motion, volume 1.
Huang, G. and Wang, Y. (2007). Gender classification based
on fusion of multi-view gait sequences. In Proc. 8th
Asian Conference Computer Vision, pages 462–471.
Kang, P. and Cho, S. (2006). EUS SVMs: Ensemble of
under-sampled SVMs for data imbalance problems. In
ICONIP, pages 837–846.
Lee, L. and Grimson, W. (2002). Gait analysis for recogni-
tion and classification. Proc. 5th IEEE Int’l. Conf. on
Automatic Face and Gesture Recogn., pages 155–162.
Li, X., Maybank, S., Yan, S., Tao, D., and Xu, D.
(2008). Gait components and their application to gen-
der recognition. IEEE Trans. SMC-C, 38(2):145–155.
MIT (2001). Human Gait Recognition Database.
MIT Artificial Intelligence Lab (Cambridge).
http://www.ai.mit.edu/projects/gait/.
Provost, F. and Fawcett, T. (1997). Analysis and visual-
ization of classifier performance: Comparison under
imprecise class and cost distributions. In Proc. of the
3rd ACM SIGKDD, pages 43–48.
Sarkar, S., Phillips, P., Liu, Z., Vega, I., Grother, P., and
Bowyer, K. (2005). The HumanID gait challenge
problem: data sets, performance, and analysis. IEEE
Trans. on PAMI, 27(2):162–177.
Shutler, J., Grant, M., Nixon, M. S., and Carter, J. N. (2002).
On a large sequence-based human gait database. In
Proc. 4th Int’l Conf. on RASC, pages 66–71.
Yoo, J., Hwang, D., and Nixon, M. (2005). Gender classifi-
cation in human gait using support vector machine. In
Proc. ACIVS, pages 138–145.
Yu, S., Tan, T., Huang, K., Jia, K., and Wu, X. (2009). A
study on gait-based gender classification. IEEE Trans-
actions on Image Processing, 18(8):1905–1910.
VISAPP 2010 - International Conference on Computer Vision Theory and Applications
444
