
A HYBRID BOUNDARY–REGION LEFT VENTRICLE
SEGMENTATION IN COMPUTED TOMOGRAPHY
Antonio Bravo, Jos´e Clemente
Grupo de Bioingenier´ıa, Decanato de Investigaci´on, Universidad Nacional Experimental del T´achira
San Crist´obal 5001, Venezuela
Miguel Vera, Jos´e Avila, Rub´en Medina
Grupo de Ingenier´ıa Biom´edica, Facultad de Ingenier´ıa, Universidad de Los Andes, M´erida 5101, Venezuela
Keywords:
Segmentation, Generalized Hough transform, Mathematical morphology, Unsupervised clustering, Cardiac
images, Left ventricle.
Abstract:
An automatic approach based on the generalized Hough transform (GHT) and unsupervised clustering tech-
nique to obtain the endocardial surface is proposed. The approach is applied to multi slice computerized
tomography (MSCT) images of the heart. The first step is the initialization, where a GHT–based segmentation
algorithm is used to detect the edocardial contour in one MSCT slice. The centroid of this contour is used
as a seed point for initializing a clustering algorithm. A two stage segmentation algorithm is used for seg-
menting the three–dimensional MSCT database. First, the complete database is filtered using mathematical
morphology operators in order to improve the left ventricle cavity information in these images. The second
stage is based on a region growing method. A seed point located inside the cardiac cavity is used as input for
the clustering algorithm. This seed point is propagated along the image sequence to obtain the left ventricle
surfaces for all instants of the cardiac cycle. The method is validated by comparing the estimated surfaces
with respect to left ventricle shapes drawn by a cardiologist. The average error obtained was 1.52 mm.
1 INTRODUCTION
In medical image processing, segmentation is an im-
portant tool to analyze anatomic tissue features types,
and spatial distribution of functional regions (active
and pathological) (Bankman, 2000). Additionally,
this technique is useful to extract information for di-
agnosis or quantification (Angelini et al., 2001), visu-
alization (Nelson and Elvins, 1993), and finally com-
pression, storage and transmission (Field, 1996; DI-
COM, 1999).
Image segmentation techniques are based on the
organization and grouping of a set of shapes, being
the proximity, similarity and continuity the main or-
ganization characteristics. The segmentation process
partitions an image into homogeneous regions, also
called classes or subsets, considering one or more
similar characteristics (Fu and Mui, 1981; Duda et al.,
2000). Most of segmentation methods for medical im-
ages, are based on delineation of a curve that defines
the anatomical structures, which allows to discrimi-
nate the structure of interest from other structures that
appear in the image (Kervrann and Heitz, 1999). An-
other kind of techniques are based on application of
classification methods, where the image is processed
until represented as a non–overlapped set of two (2)
regions (subject of interest and background) (Mitchell
et al., 2001).
Images studies in cardiology are used to obtain
both qualitative and quantitative information of the
heart and vessels morphology and function. Several
clinical parameters can be extracted from dynamics
images of cardiovascular structures with the objective
of reproducing the heart space–time behavior (Rabit,
2000). Assessment of cardiovascular function is im-
portant since Cardio–Vascular Disease (CVD) is con-
sidered the most important cause of mortality. Ap-
proximately 17 million people die each year, repre-
senting one third of the deaths in the world (WHO,
2002a). About 85% of overall mortality of middle-
and low-income countries is due to CVD and it is es-
timated that CVD will be the leading cause of death
107
Bravo A., Clemente J., Vera M., Avila J. and Medina R. (2010).
A HYBRID BOUNDARY–REGION LEFT VENTRICLE SEGMENTATION IN COMPUTED TOMOGRAPHY.
In Proceedings of the International Conference on Computer Vision Theory and Applications, pages 107-114
DOI: 10.5220/0002849301070114
Copyright
c
SciTePress

in developed countries in two years (WHO, 2002b).
Multi Slice Computerized Tomography is prob-
ably the term most commonly used to describe the
latest developments in Spiral computed tomography
(CT) which is based on simultaneous acquisition of
more than one tomography plane, and it is closely re-
lated to acquisition systems with multiple detectors
(Fuchs et al., 2000).
Left ventricle (LV) is considered the main cav-
ity of the heart. In this sense, the assessment of the
LV function allows to assess the cardiovascular func-
tion. The LV function analysis requires the accurate
description of ventricular shape.
1.1 Related Work
There are several research studies on cardiac segmen-
tation especially focused on left ventricle segmenta-
tion. Lynch et al. (Lynch et al., 2008) developed a LV
segmentation method from magnetic resonance imag-
ing. The method uses prior knowledge about ventric-
ular motion to guide a parametric model of the car-
diac cavity. The model deformation was initially con-
trolled by a level–set formulation. The state of the
model attained by the level–set evolution was refined
using the expectation maximization (EM) algorithm.
The objective was to fit the model to MRI data. The
method was tested using a set of six clinical databases.
The correlation coefficientobtained by a linear regres-
sion analysis of segmentation results with respect to
manual segmentation was 0.76.
Fleureau et al. (Fleureau et al., 2006), re-
ported a semi–automatic and multi–structure three–
dimensional (3–D) segmentation method. The
method was applied to extract the heart cavities from
MSCT sequences. The method associated basic
agents to the objects of interest. Each agent learnt the
image region characteristics through a Support Vector
Machine formulation. The cardiac cavities were ob-
tained by maximizing the region associated to each
basic agent. The approach allowed to discriminate
structures such as, left ventricle, left atrium, right ven-
tricle and right atrium. However, the clinical valida-
tion was not performed at the time of publication.
Chen et al.(Chen et al., 2004) developed a hybrid
model for LV CT segmentation. The model couples
a segmenter, based on a Gibbs prior models and de-
formable models with a marching cubes procedure. A
external force based on a scalar gradient was consid-
ered in order to achieve convergence. The approach
was tested using 8 CT studies. Results obtained re-
veals the good behavior of the method.
Recently, a semi–automatic segmentation method
based on a 3–D active shape model has been pro-
posed by Van Assen et al. (Assen et al., 2008). The
method has the advantage of being independent with
respect to the imaging modality. The LV shape was
obtained for the whole cardiac cycle in 3D MRI and
CT sequences. A point–to–point distance was one of
the metrics used to evaluate the method performance.
The average value of the distances obtained for the
CT sequences was 1.85 mm.
1.2 Purpose
In this research, an automatic image segmentation ap-
proach useful to extract the left ventricle cavity from
multi–slice computerized tomography 4–D (3–D +
time) images is proposed. Morphological filters are
used to improve the LV information in the images,
and thus to facilitate the process of segmentation. The
approach uses a region growing algorithm for the seg-
mentation. A pixel called initial seed is located in the
cavity of interest using the generalized Hough trans-
form. This seed is established in the first volume of
the MSCT dataset, and then compared with certain
neighborhood pixels characteristics such as intensity
and topological relationship according to a region–
growing algorithm. The segmentation algorithm al-
lows to obtain a binary image with the LV information
and the background. From this initial binary image a
new seed is automatically generated for segmenting
the next MSCT volume. The first seed is then propa-
gated along the 3–D image sequence to obtain the LV
surfaces for all instants of the cardiac cycle.
2 METHOD
2.1 Dataset
A human MSCT database is used. The dataset con-
tains 20 volumes to describe the heart anatomical
information for a cardiac cycle. Each volume has
262 CT slices where the spacing between pixels is
0.488281 mm and the slice thickness is 0.625 mm.
The data acquisition was triggered by the R wave of
the ECG signal. Each image is quantized with 12 bits
per pixel and the size is 512× 512 pixels.
2.2 Hough Transform Seed Localization
In this work, the Generalized Hough Transform
(GHT) is applied to obtain the left ventricle border
in one MSCT slice. From this contour, the seed point
required to initialize an unsupervised clustering algo-
rithm is computed.
VISAPP 2010 - International Conference on Computer Vision Theory and Applications
108
The GHT proposed by Ballard (Ballard, 1981)
has been used to detect objects, with specific shapes,
from images. The proposed algorithm consists of two
stages: 1) training and 2) detection. During the train-
ing stage, the objective is to describe a pattern of the
shape to detect. This pattern is parameterized using
the gradient direction (θ) at each pattern point, the dis-
tance (r) between the reference point (x
c
, y
c
) and each
pattern point, and the angle (α) with respect to x–axis
of the line formed by the reference point and each pat-
tern point. The parameters describing the shape are
stored in an array known as the R–Table.
The second stage is implemented to detect a sim-
ilar shape in an image not used during the training
step. The parameter θ is calculated for each point in a
pre–processed image to segment. The θ value is used
as an entry to the R–table. The corresponding r and
α values found in the table are used to compute the
candidates to reference points (x
c
, y
c
) according to 1.
x
c
= x+ rcos(α)
y
c
= y+ rsin(α)
, (1)
where (x, y) are object boundaries points. An accumu-
lator is used to count the occurrences of each refer-
ence point calculated. The reference point with more
occurrence is selected.
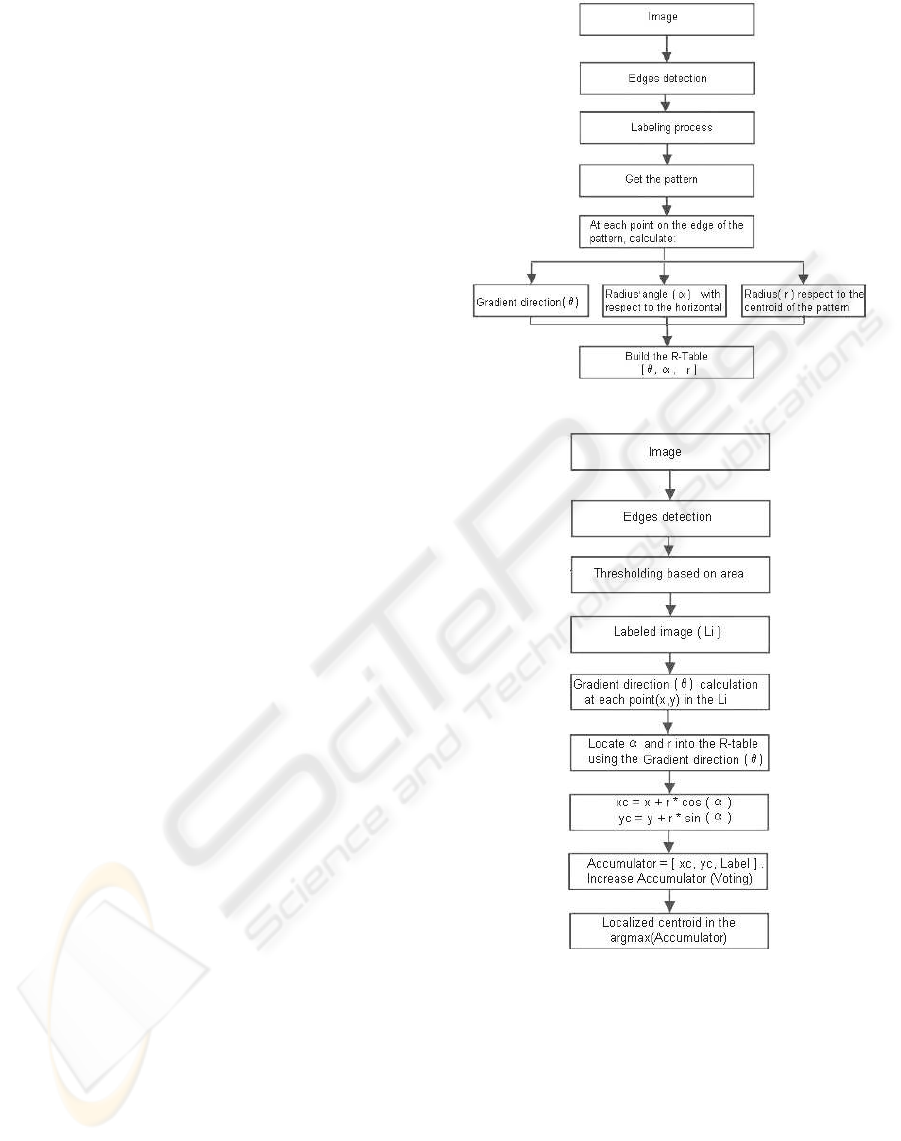
The overviews of the training and detection stages
for the LV segmentation are shown on the flowcharts
in Figures 1 and 2. In the training stage, the heart
structures boundaries are initially estimated using the
Canny edge detection algorithm (Canny, 1986). The
LV contour is manually labeled in the Canny’s con-
tours map. The centroid of the LV contour is used
as the reference point (x
c
, y
c
). The R–table is con-
structed when the values of the (θ, r, α) are computed.
During the detection step (Figure 2), the applica-
tion of the Canny edge detection algorithm is also re-
quired. A thresholding technique is applied in order
to discriminate the size of the regions delimitated by
the borders labeled in the Canny image. The thresh-
olds used correspond to areas measured in pixels. The
regions obtained after the thresholding are considered
as candidates for the left ventricle shape. The border
points of the LV candidates are used to calculate the
gradient direction (θ). For the θ values found in the
R–table, the corresponding r and α values are used
to calculate the reference points using 1. The final
contour correspond to the candidate whose reference
point has the best match with respect to the reference
point of the pattern.
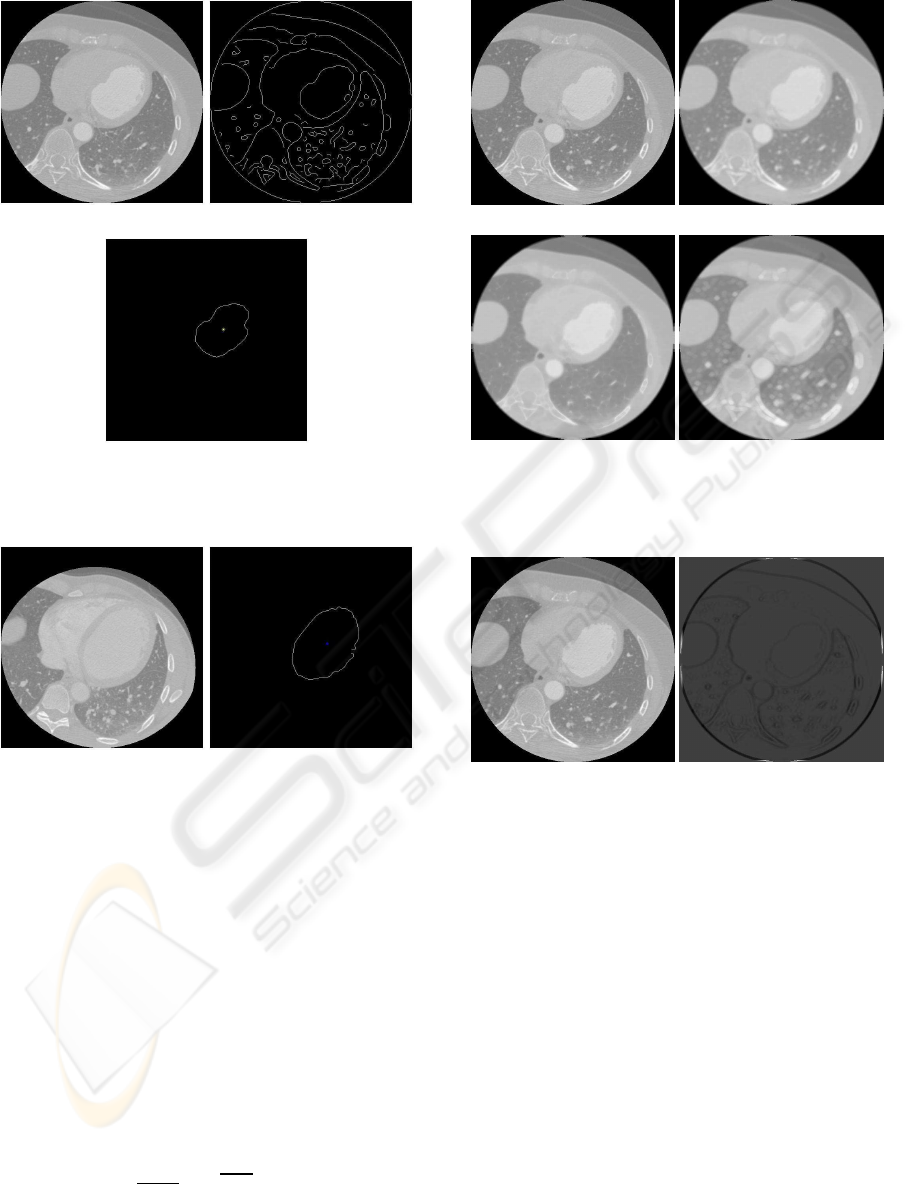
Figure 3 illustrates the training process applied to
one MSCT slice while Figure 4 shows the results of
the segmentation for other MSCT slice.
Figure 1: GHT training stage.
Figure 2: GHT detection stage.
2.3 Unsupervised Segmentation
2.3.1 Pre-processing
Mathematical morphological operators are used for
implementing the filters aimed at enhancing the LV
information. These morphological operators are
based on non–linear operations between the original
image (I) and a set of additional points known as
structuring element (B) (Serra, 1982). The applied
filters are based on the top–hat transform. This trans-
A HYBRID BOUNDARY-REGION LEFT VENTRICLE SEGMENTATION IN COMPUTED TOMOGRAPHY
109
(a) (b)
(c)
Figure 3: Results of GHT training stage. (a) Original image.
(b) Canny image. (c) Pattern obtained.
(a) (b)
Figure 4: Results of GHT segmentation stage. (a) Original
image. (b) LV segmented.
form is a composite operation defined by the set dif-
ference between the image processed by a closing op-
erator and the original image. The closing (•) oper-
ator is also a composite operation that combines the
basic operations of erosion (⊖) and dilation (⊕). The
top–hat transform is expressed according to (2).
I• B− I = (I⊕ B) ⊖ B− I . (2)
A modification of the basic top–hat transform def-
inition is introduced. A Gaussian filter is applied to
the original image. The discrete Gaussian operator
with standard deviation σ is used as a filter mask (3).
K(i, j) =
1
2πσ
2
e
−
i
2
+ j
2
2σ
2
;0 ≤ i, j ≤ n , (3)
where n denotes the mask size and σ is set as the stan-
dard deviation of the original image. The processed
(a) (b)
(c) (d)
Figure 5: Pre–processing stage. (a) Original image. (b)
Gaussian smoothed image. (c) Eroded image. (d) Dilated
image.
(a) (b)
Figure 6: The top–hat transform. (a) Original image. (b)
Processed image.
image (I
Gauss
) is a blurred version of the input.
The Gaussian smoothed image is used to calculate
the morphological closing. The structuring element
selected is an ellipsoid that varies in size depending
on the operator. The major axis of the structuring el-
ement used for the erosion is 3 and for the dilation is
5. Figure 5 shows part of the pre–processing stage.
Finally, the top–hat transform is calculated us-
ing (4), the result is an image with enhanced con-
tours. The original image and the processed image
are shown in Figure 6.
I
BTH
= (I
Gauss
⊕ B
5
) ⊖ B
3
− I
Gauss
. (4)
The intensity values of the top–hat image (I
BTH
)
and the Gaussian image (I
Gauss
) are used to create a
feature vector. This feature vector is used to construct
VISAPP 2010 - International Conference on Computer Vision Theory and Applications
110

(a) (b)
Figure 7: Final enhancement process. (a) Original image.
(b) Similarity image.
a similarity matrix based on a similarity criteria (Har-
alick and Shapiro, 1992). The criteria measures the
difference between the gray–level values of pixels in
I
BTH
and the smoothed image, I
Gauss
. According to
this criteria, pixels p
1
(x, y) (in I
BTH
) and p
2
(x, y) (in
I
Gauss
) have features vectors denoted as: pv
1
= [i
1
, a]
and pv
2
= [i
2
, b], where i
1
and i
2
denote the intensity
associated with the corresponding pixel of I
BTH
and,
a and b are the intensity of the smoothed image. The
pixel values in the similarity matrix are obtained by
using the following expression:
p
I
S
(x, y) = (i
1
− i
2
)
2
+ (i
1
− b)
2
+ (i
2
− a)
2
. (5)
Figure 7 shows the image enhanced using the sim-
ilarity criteria, where the information related to the
LV cavity is enhanced with respect to other anatomi-
cal structures that are present in the MSCT slice.
The process described previously, is applied to all
volumes of the human MSCT database. Since this
process requires large computing resources, multipro-
gramming based on threads is used to speed up the
enhancement. The performance and a speed test is
applied using 1Gb memory–Pentium IV machine. An
optimal reduction of 48% in processing time, without
saturating the equipment operation, is attained using
4 threads.
2.3.2 Segmentation Stage
A region growing technique is used to segment the
LV. The unsupervised clustering algorithm requires a
seed point located inside the region of interest to iden-
tify the cardiac cavity. The seed is established in one
slice at only one time instant of the MSCT 4–D image
sequence. The procedure used to establish the seed
point is based on the GHT (see section 2.2).
Seed Determination. A seed is used for starting the
region–growing segmentation process. This seed cor-
responds to the reference point of the shape obtained
using the GHT procedure. The seed point is located
in the bi–dimensional (2–D) image I
t
k
, where t rep-
resents the time instant of the MSCT dataset, and k is
the slice in the corresponding volumet. When the im-
age I
t
k
has been segmented (process described in sec-
tion 2.3.2) a binary image
b
I
t
k
is obtained. In this im-
age, pixels in white represent the segmented region.
From
b
I
t
k
the seed points necessary to segment the
entire volume t are estimated. The center of mass of
the segmented region in the image
b
I
t
k
is calculated
and denoted as r(x, y). The pixel r(x, y) is the new
seed to segment the images I
t
k+1
and I
t
k−1
. The seed
generation process is applied upward by diminishing
the value of k until reaching the LV base. In the same
way, the process is applied downward by increasing k
until reaching the apex.
The process for propagating the seed from one
volume to the next, is also based on the calculation
of the gravity center as previously explained. How-
ever, in this case the calculation is performed for the
3-D binary object.
The procedure based on calculation of the center
of mass, results in a point located very near of the LV
anatomical axis. In consequence, the seed is always
located inside the target region (inside the LV).
Region Growing Algorithm. The algorithm is devel-
oped using dynamic linked–lists. The algorithm in-
puts are the enhanced image and a binary image with
all pixels set to zero (0). The lists are implemented as
a First In First Out (FIFO) queue. The list is used to
store temporarily the pixels that fulfill the clustering
criterion. The objective is to develop an iterative algo-
rithm highly efficient with respect to memory require-
ments aiming at avoiding memory overflows. Each
node in the list contains the pixel information: loca-
tion and gray level intensity. The first node inserted
in the list is the seed pixel.
After introducing the seed pixel in the FIFO list,
the algorithm performsthe following steps: 1) the first
node of the list is dequeue, 2) the gray level informa-
tion associated to the analyzed node is compared with
pixel intensities in an 8 pixels neighborhood to deter-
mine if these neighbor pixels belong or not to the tar-
get region. Pixels of the neighborhood that fulfill the
clustering criterion are inserted at the end of the list
and their values in the binary image are modified to
one (1). The pixels that do not fulfill with the condi-
tion are rejected, and 3) the algorithm continues with
this process while there are nodes in the list. The al-
gorithm output is the binary image where pixels set
to one represent the segmented region. The unifor-
mity criterion for grouping pixels is as follows: pixels
are grouped if the difference between the pixel value
in the neighborhood and the intensity of the pixel ex-
tracted of the list is below
1
4
standard deviation of sim-
A HYBRID BOUNDARY-REGION LEFT VENTRICLE SEGMENTATION IN COMPUTED TOMOGRAPHY
111
ilarity image.
In this algorithm multiprogramming is also used,
considering two threads. The first thread segments the
slices from I
t
k
, I
t
k+1
,......, to I
t
apex
, and the second
thread segments the slices from the I
t
k−1
, I
t
k−2
,......,
to I
t
base
. The LV base and apex are detected auto-
matically by our algorithm. A comparison between
current segmented area and previous segmented area
is performed. If the areas are different in more than
80%, the current segmented area does not belong to
the interest region, and then the segmentation process
is stopped. Figure 8 shows the results of the segmen-
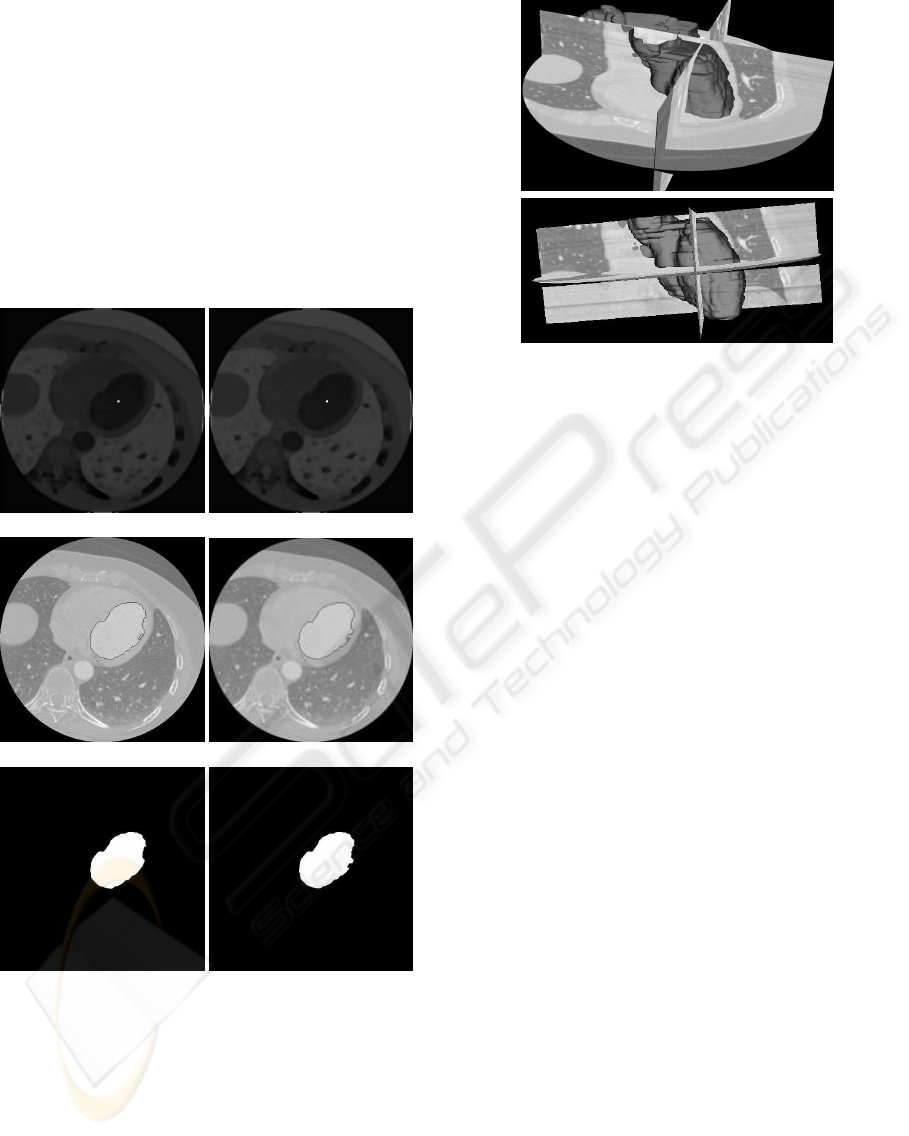
tation for two consecutive tomographic slices.
(a) (b)
(c) (d)
(e) (f)
Figure 8: (a) Seed in slice I
t
k
. (b) Seed in slice I
t
k+1
. (c) and
(d) LV contours. (e) and (f) LV areas.
After the segmentation process the reconstruction
of the LV surface is performed using the Visualiza-
tion Toolkit (VTK) (Schroeder et al., 2001). The en-
docardial LV wall is reconstructed using the marching
cubes algorithm (Salomon, 1999) (Figure 9).
Figure 9: Result of the segmentation process.
2.3.3 Validation
The proposed method is validated by calculating the
difference between the estimated LV shape with re-
spect to a ground truth shape, traced by an expert.
Two different methodologies for evaluating the per-
formance of the LV segmentation method are consid-
ered. First, the approach proposed by Suzuki et al.
(Suzuki et al., 2004) is incorporated. Suzuki’s quanti-
tative evaluation methodology is based on calculating
two metrics that represent the contour error (E
C
) and
the area error (E
A
). See (Suzuki et al., 2004, p. 335)
to show the contour and area errors expressions.
The validation methodology proposed by Chalana
and Kim (Chalana and Kim, 1997) is also used. A
metric based on a mean absolute distance (MAD) of
the distance to the closest point (DCP) is used for as-
sessing the position error (E
P
) between contours au-
tomatically extracted with respect to contour traced
by an experts. The metric expression can be found in
(Chalana and Kim, 1997, p. 643).
3 RESULTS
The proposed method is implanted using a multi–
platform object–oriented methodology along with
C++ multiprogramming and using dynamic memory
handling. Standard libraries such as the Visualization
Toolkit (VTK) are used. VTK consists of a complete
set of algorithms for 3–D images visualization. The
Fast Light Toolkit (FLTK) open source libraries are
also used to develop the graphic interface. The code is
executed in Microsoft Windows and Linux platforms.
In the application, threads are used to speed up the
process and then to optimize the response times.
The segmentation algorithms are tested with more
VISAPP 2010 - International Conference on Computer Vision Theory and Applications
112

Figure 10: Cardiac structures at 10%, 30%, 50%, 70% and 90% of the cardiac cycle.
Figure 11: Left ventricle surfaces in the new frame of reference.
Table 1: Errors obtained for a total of 262 images processed.
Error Types Result
E
A
3.38 % ± 3.09 %
E
C
6.23 % ± 3.77 %
E
P
1.52 mm ± 0.18 mm
than ten thousand 2–D images, obtaining good results
for all images with very satisfactory processing times.
For instance, for a database including 20 volumes and
262 images per volume, the filtering and segmentation
take approximately 15 minutes. Figure 9 shows the
segmented LV overlaid with three orthogonal slices
extracted from the original database (axial, coronal
and saggital), where it can be shown that for these
planes the structure matches with the LV contours.
Table 1 shows the comparison of extracted sur-
face with respect to the surface traced by the car-
diologist. The errors estimated are expressed as
mean± standard deviation. The position error varies
between 0.87 mm and 1.72 mm. The average po-
sition error obtained using our segmentation method
was 1.52 mm which is smaller than the average error
(1.85 mm) reported by Van Assen et al. (Assen et al.,
2008). Using the proposed segmentation method the
average contour error and the average area error are
6.23% and 3.38%, respectively.
Additionally, the application allows to establish
a particular frame of reference not dependent on the
original position of the heart. This frame is based on
an axis (z–axis) joining the apex to the joint between
the mitral and aortic valves as determined in the en-
docardial LV wall, and a plane perpendicular to this
axis that is the x–y plane. The frame of reference cor-
responds with the image acquisition geometry for the
MRI images. Figure 10 shows the segmentation re-
sults while Figure 11 shows the left ventricle in the
new frame of reference. The LV structures for in-
stants located at 10%, 30%, 50%, 70% and 90% of
the cardiac cycle are shown.
4 CONCLUSIONS
An automatic method for LV image segmentation
from 4–D MSCT datasets was proposed. The soft-
ware system is a platform independent tool devel-
oped using C++ and open–source libraries. The
pre–processing stage was based on gray level math-
ematical morphology filters aimed at performing the
smoothing and enhancement of image contours. A
region growing algorithm was controlled by a seed
point located in one volume using generalized Hough
transform, which was propagated to the rest of vol-
umes in order to segment the entire MSCT database.
A valuable contribution was the utilization of
threads since they improve the processing time for the
whole process. The segmentation method evaluation
was performed by comparing the estimated contours
with respect to contourstraced by a cardiologists. The
comparison was performed based on the methodolo-
gies proposed in (Chalana and Kim, 1997; Suzuki
et al., 2004) which are also used in (Oost et al., 2006)
and (Bravo and Medina, 2008). The validation stage
shows that errors are small. The method allowed to
detect LV important features as the papillary muscles.
As a future research we propose to use the method
for automatic segmentation of right ventricle, left and
right atrium in multi–slice computerized tomography
(MSCT) images. Additionally, we plan to develop the
approach in a 3–D domain in order to take into ac-
count three–dimensional topological features of the
left ventricle and for speeding up the segmentation
procedure. We also have considered to use the pro-
posed method for heart structures segmentation in
other cardiac imaging modalities.
A HYBRID BOUNDARY-REGION LEFT VENTRICLE SEGMENTATION IN COMPUTED TOMOGRAPHY
113

ACKNOWLEDGEMENTS
The authors would like to thank the Investigation
Dean’s Office of Universidad Nacional Experimental
del T´achira, LOCTI grant PR0100401, and CDCHT
from Universidad de Los Andes (projects I-1075-07-
02B and NUTA C–24–07–02–C) for their support to
this research. Authors would also like to thank H. Le
Breton and D. Boulmier from the Centre CardioPneu-
mologique and M. Garreau from Laboratoire Traite-
ment signal et de l’image (LTSI) in Rennes, France
for providing the human MSCT database.
REFERENCES
Angelini, E., Laine, A., Takuma, S., Holmes, J., and
Homma, S. (2001). LV volume quantification via spa-
tiotemporal analysis of real–time 3–D echocardiogra-
phy. IEEE Trans. Med. Imag., 20(2):457–469.
Assen, H. V., Danilouchkine, M., Dirksen, M., Reiber, J.,
and Lelieveldt, B. (2008). A 3D active shape model
driven by fuzzy inference: Application to cardiac CT
and MR. IEEE Trans. Inform. Technol. Biomed.,
12(5):595–605.
Ballard, D. (1981). Generalizing the hough transform to
detect arbitrary shapes. Pattern Recog., 13(2):111–
122.
Bankman, I. (2000). Handbook of Medical Imaging: Pro-
cessing and Analisys. Academic Press, San Diego.
Bravo, A. and Medina, R. (2008). An unsupervised clus-
tering framework for automatic segmentation of left
ventricle cavity in human heart angiograms. Comput
Med Imaging Graph., 32(5):396–408.
Canny, J. (1986). A computational approach to edge de-
tection. IEEE Trans. Pattern Anal. Machine Intell.,
PAMI–8:679–698.
Chalana, V. and Kim, Y. (1997). A methodology for eval-
uation of boundary detection algorithms on medical
images. IEEE Trans. Med. Imag., 16(5):642–652.
Chen, T., Metaxas, D., and Axel, L. (2004). 3–D cardiac
anatomy reconstruction using high resolution CT data.
In Proc. MICCAI (1), pages 411–418.
DICOM (1999). Digital imaging and communication in
medicine DICOM. NEMA Standards Publication.
Duda, R., Hart, P., and Stork, D. (2000). Pattern Classifica-
tion. Wiley–Interscience, New York.
Field, M. J. (1996). Telemedicine: A Guide to Assess-
ing Telecommunications in Health Care. Institute of
Medicine, National Academy Press, Washington.
Fleureau, J., Garreau, M., Hern´andez, A., Simon, A., and
Boulmier, D. (2006). Multi-object and N-D segmenta-
tion of cardiac MSCT data using SVM classifiers and
a connectivity algorithm. In Computers in Cardiology,
pages 817–820.
Fu, K. S. and Mui, J. K. (1981). A survey on image seg-
mentation. Pattern Recog., 13(1):3–16.
Fuchs, T., Kachelriess, M., and Kalender, W. (2000). Sys-
tems performance multislice spiral computed tomog-
raphy. IEEE Eng. Med. Biol. Mag., 19(5):63–70.
Haralick, R. A. and Shapiro, L. (1992). Computer and
Robot Vision, volume I. Addison–Wesley, USA.
Kervrann, C. and Heitz, F. (1999). Statistical deformable
model–based segmentation of image motion. IEEE
Trans. Image Processing, 8(4):583–588.
Lynch, M., Ghita, O., and Whelan, P. (2008). Segmentation
of the left ventricle of the heart in 3-D+t MRI data
using an optimized nonrigid temporal model. IEEE
Trans. Med. Imag., 27(2):195–203.
Mitchell, S., Lelieveldt, B., van der Geest, R., Bosch, H.,
Reiber, J., and Sonka, M. (2001). Multistage hybrid
active appearance model matching: Segmentation of
left and right ventricles in cardiac MR images. IEEE
Trans. Med. Imag., 20(5):415–423.
Nelson, T. R. and Elvins, T. T. (1993). Visualization of
3D ultrasound data. IEEE Comput. Graph. Appl.,
13(6):50–57.
Oost, E., Koning, G., Sonka, M., Oemrawsingh, P. V.,
Reiber, J. H. C., and Lelieveldt, B. P. F. (2006). Auto-
mated contour detection in X–ray left ventricular an-
giograms using multiview active appearance models
and dynamic programming. IEEE Trans. Med. Imag.,
25(9):1158–1171.
Rabit, O. (2000). Quantitative analysis of cardiac function.
In Bankman, I. N., editor, Handbook of Medical Imag-
ing: Processing and Analysis, pages 359–374. Aca-
demic Press, San Diego.
Salomon, D. (1999). Computer Graphics and Geometric
Modeling. Springer Verlag, New York.
Schroeder, W., Martin, K., and Lorensen, B. (2001). The
Visualization Toolkit, An Object-Oriented Approach
to 3D Graphics. Prentice Hall, New York.
Serra, J. (1982). Image Analysis and Mathematical Mor-
phology. A Press, London.
Suzuki, K., Horiba, I., Sugie, N., and Nanki, M. (2004). Ex-
traction of left ventricular contours from left ventricu-
lograms by means of a neural edge detector. IEEE
Trans. Med. Imag., 23(3):330–339.
WHO (2002a). Integrated management of cardiovascular
risk. The World Health Report 2002 Geneva, World
Health Organization.
WHO (2002b). Reducing risk and promoting healthy life.
The World Health Report 2002 Geneva, World Health
Organization.
VISAPP 2010 - International Conference on Computer Vision Theory and Applications
114
