
3D VISUALIZATION AND VIRTUAL REALITY FOR
VISUAL DATA MINING
A Survey
Zohra Ben Said, Fabrice Guillet
LINA, UMR 6241 CNRS, University of Nantes, Nantes, France
Paul Richard
LISA, EA 4094, University of Angers, Angers, France
Keywords:
Visualization techniques, Visual data mining, Virtual reality, Classification.
Abstract:
Visual Data Mining (VDM) aims at an easier interpretation of data mining algorithm results through the
use of visualization techniques. During the last decade, many techniques of information visualization have
been proposed, allowing visualization of multidimensional data. Previously, ((Chi, 2000), (Herman et al.,
2000)) attempted to classify VDM techniques . However, these taxonomies do not take into account some
innovative techniques based on 3D visualization and virtual environments (VEs). In this paper, we propose
an exhaustive survey of recent techniques for VDM. These different techniques are detailed, classified and
compared according to the following criteria : graphical encoding, interaction techniques and applications.
Moreover, they are presented in tables together with graphical illustrations.
1 INTRODUCTION
Since the emergence of databases in the 60s, the vol-
ume of stored information grows exponentially each
year. In the 90s, this accumulation of information
in databases has motivated the development of a new
field of research : Data Mining (DM) (Fayyad et al.,
1996). In many applications, such as network man-
agement (Tee et al., 2004), finance (Schreck et al.,
2007), seismic (Marroqun et al., 2008), users need
to explore relations in the data. These data sets are
often large and dynamic. In addition, understanding
data and tendencies is essential for users to make cor-
rect decisions. The extraction of useful tendencies
in data for the user (domain expert) constitutes the
main challenge of this research. The use of visualiza-
tion techniques proposed by VDM can improve the
readability of the results and offers significant poten-
tial for interaction and exploration of large databases.
Given the number and variety of available visualiza-
tion techniques, it is a challenging activity for infor-
mation designers to find out the methods, techniques
and corresponding tools available to visualize a par-
ticular type of information. The comparison of vi-
sualization techniques across different criteria is not
a trivial problem. Previously, ((Chi, 2000), (Herman
et al., 2000)) attempted to classify VDM techniques .
However, these taxonomies do not take into account
the latest approaches based on 3D and virtual real-
ity techniques. Visual Data Mining (VDM) is an ap-
proach to explorate data analysis and knowledge dis-
covery that is built on the extensive use of visual com-
puting. The basic goal is that large and incompre-
hensible amounts of data can be reduced to an easy
representation. This visual reprsentation can be eas-
ily understood and interpreted by a human. Accord-
ing to (Card et al., 1999), information visualization
allows the user to learn about data and relationships
among these data. The popularity of digital terrain
models (Simoff, 2001), based on the geographical
framework and CAD-based architectural models of
cities has demonstrated that multi-dimensional visu-
alization can provide a more efficient way of explor-
ing large data sets. Some recent developments are ex-
tending VDM with algorithmic animation techniques,
multimedia support and virtual reality (VR) immer-
sive representations, aiming at involving decision-
makers in the mining and discovery process (Visual
Analytics). Decision-makers should be able to exam-
ine this massive, multi-dimensional, multi-source and
140
Ben Said Z., Guillet F. and Richard P. (2010).
3D VISUALIZATION AND VIRTUAL REALITY FOR VISUAL DATA MINING - A Survey.
In Proceedings of the International Conference on Imaging Theory and Applications and International Conference on Information Visualization Theory
and Applications, pages 140-145
DOI: 10.5220/0002850801400145
Copyright
c
SciTePress
time-varying information stream to make effective de-
cisions in time-critical situations (Keim et al., 2008).
Therefore, the success of VDM methods depend on
the development of adequate interaction and visual-
ization techniques.
Main Contributions. In this paper we purpose
• A recent review of 18 visualization techniques ac-
companied with graphic illustrations.
• A classification of these techniques across 5
groups : Focus + context, 3D tree, virtual world,
3D scatterplot and dynamic graph.
• A comparaison of each group of techniques across
5 criteria : application, graphical encoding, inter-
action technique, advantages and drawbacks.
This paper is organized as follows. In section 2, we
describe focus + context visualization techniques. In
section 3 we present visualization techniques based
on 3D virtual worlds. The paper ends with a conclu-
sion.
2 FOCUS + CONTEXT
VISUALIZATION TECHNIQUES
Originally, the method of focus + context visualiza-
tion (F + C), aimed to wider detailds description of
cetain parts of data (the point of interest, focus, etc),
while the rest of the data is reduced in size in order to
provide a guidance to the users. The best techniques
F + C known, are the techniques of distortion: fisheye
proposed by (Furnas, 1986). In the technique bending
backwards, another variant of the F + C technique,
the overview of different objects is not readable, but,
miniature views of objects are index in order to help
the user to move directly to the information sought.
However, there are other methods that the distortion
of space. The viewing volume for example, proposes
to vary the opacity (Mroz and Hauser, 2001), (color
shades) and frequency to achieve F + C visualization
of 3D data. A detailed comparison of these techniques
is presented in Table 1.
3 VIRTUAL WORLDS
VISUALIZATION TECHNIQUES
The virtual worlds (sometimes called cyber-spaces)
are another important trend in 3D information vi-
sualization. Virtual worlds for VDM are gener-
ally based either on the information galaxy metaphor
(Krohn, 1996) or the information landscape metaphor
(Robertson et al., 1998). The difference between the
two metaphors is that in information landscape, ele-
vation of objects is not used to represent information
(objects are placed on a horizontal floor). The speci-
ficity of virtual worlds is that they provide to the user
some real-time 3D intuitive interaction and/or naviga-
tion techniques (control of the view point). A detailed
comparison of these approaches is presented in Table
2.
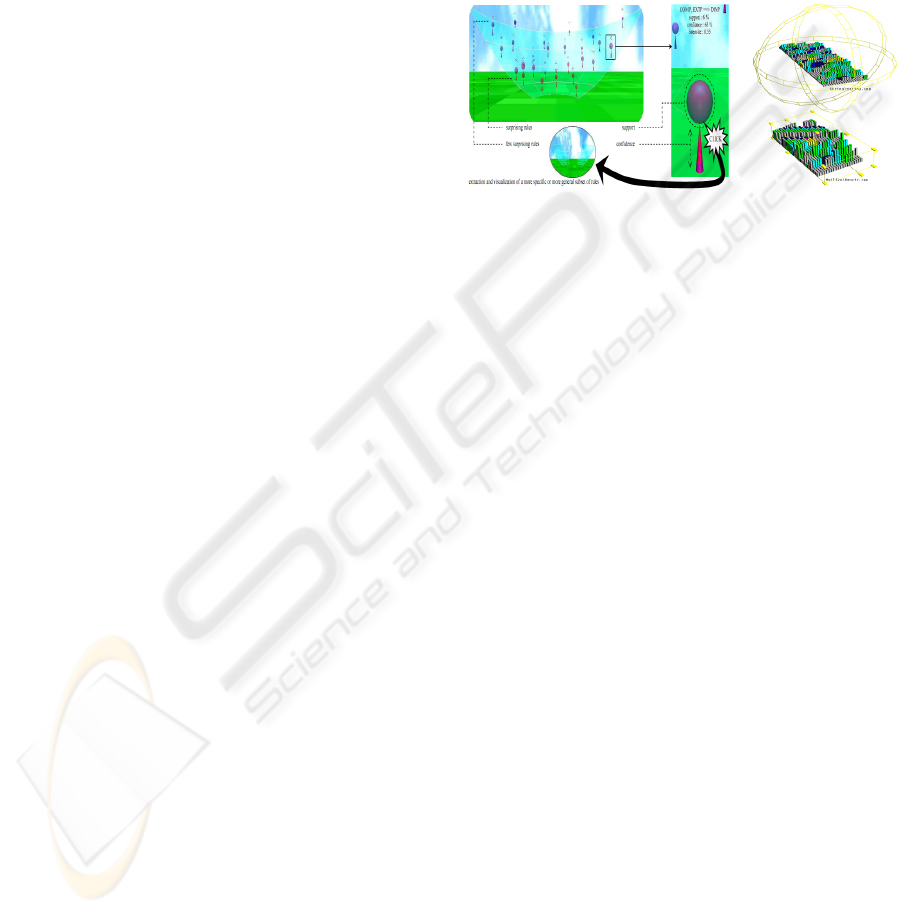
(a): ARVis (b): sv3d
Figure 1: Illustrations of virtual worlds visualization tech-
niques.
3.1 3D Trees Visualization Techniques
Trees are information visualization techniques based
on hierarchical organization of the data. This ap-
proach finds many applications in graph visualiza-
tion. Indeed, 3D tree was designed to display a larger
number of nodes than those in 2D representations
(TreeMap (Johnson and Shneiderman, 1991)). The
conical trees are one of the best examples of this ap-
proach. They were introduced by (Robertson et al.,
1991) for visualizing large hierarchical structures in a
more intuitive way. 3D trees may be displayed verti-
cally (ConeTrees) or horizontally (CamTrees). Some
botanical approaches were proposed by (Ham and
Wijk, 2003) and (van de Wetering Kleiberg and van
Wijk, 2001).
3.2 3D Scatterplots
The 3D scatterplot visualization technique is one of
the most common representations in 3D scientific in-
formation visualization. It is based on the informa-
tion galaxy metaphor. The main innovation compared
to 2D visualization techniques is the use of volume
rendering that is a conventional technique in scien-
tific visualization (especially medical imaging). The
3D rendering techniques use voxels (instead of pix-
els) to represent a certain density of the data. This
technique has been adapted by (Becker, 1997), mak-
ing the opacity of each voxel a function of the density
of points.
3D VISUALIZATION AND VIRTUAL REALITY FOR VISUAL DATA MINING - A Survey
141
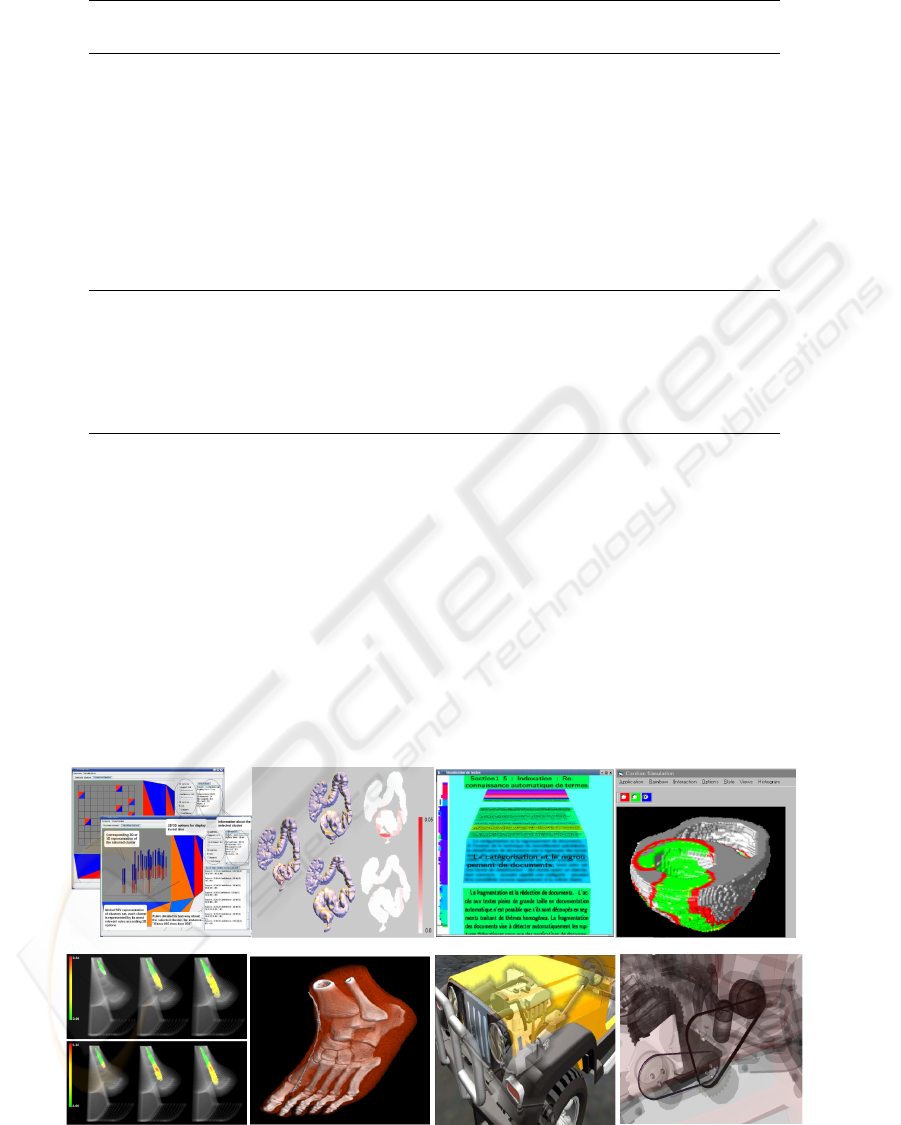
Table 1: Comparison of Focus + Context Techniques.
Visualization Applications Graphical Interaction Advantages Drawbacks
system encoding technique
Visualization Fish-eye
-CbVAR (Couturier
et al., 2007) Figure 2(a)
-Visualization
of association
rules
-2D :
context
-3D : focus
-Selection
-Zoom
-The display context help
orientation
-Displaying data in a
cluster
-Dynamic Tuning
-Few
parameters
displayed
- (Wang et al., 2008)
Figure 2(b)
-3D shape -Enlarge the
focal region
-Selection
-Zoom
-Deforming the non focal
region without
perceivable distortion
-Constraints in
the case where
there is not
enough space
Bending backwards
-3D-XV (Jacquemin
and Jardino, 2002)
Figure 2(c)
-Linear
structures
-Focus area
in the
center of
the screen
and near
data on the
sides
-Navigation
-Selection
-Different modes for
information accessibility
-Visualization
of sub-parts of
data at one
time
Linking and brushing
-Color
-WEAVE (Gresh et al.,
2000) Figure 2(d)
-SimVis (Doleisch
et al., 2005) Figure 2(e)
-Opacite
-RTVR (Mroz and
Hauser, 2001) Figure
2(f)
-The Magic Volume
Lens (Wang et al.,
2005) Figure 2(g)
-(Gtzelmann et al.,
2007)Figure 2(h)
-Frequence
(Elmqvist et al.,
2009)Figure 2(i)
-Medical
data,
scientific and
industrial
-Utilization
of colors
(SimVis,
WEAVE) ,
opacity
(RTVR)
and
frequency
to
emphasize
the
focussed
data parts
-Selection
-Feedback
(changing of
colors, etc.)
-Multiple linked views
-Immediate feedback
-Fast detection of
dependencies and
correlations
-No semantic
zoom
(a): cbVAR.
(b): (Wang et al., 2008).
(c): 3D-XV. (d) : WEAVE.
(e) : SimVis.
(g) : The magic volume lens.
(h) : (Gtzelmann et al., 2007).
(i) : (Elmqvist et al., 2009).
Figure 2: Illustrations of Focus + contexte Visualization Techniques.
IVAPP 2010 - International Conference on Information Visualization Theory and Applications
142
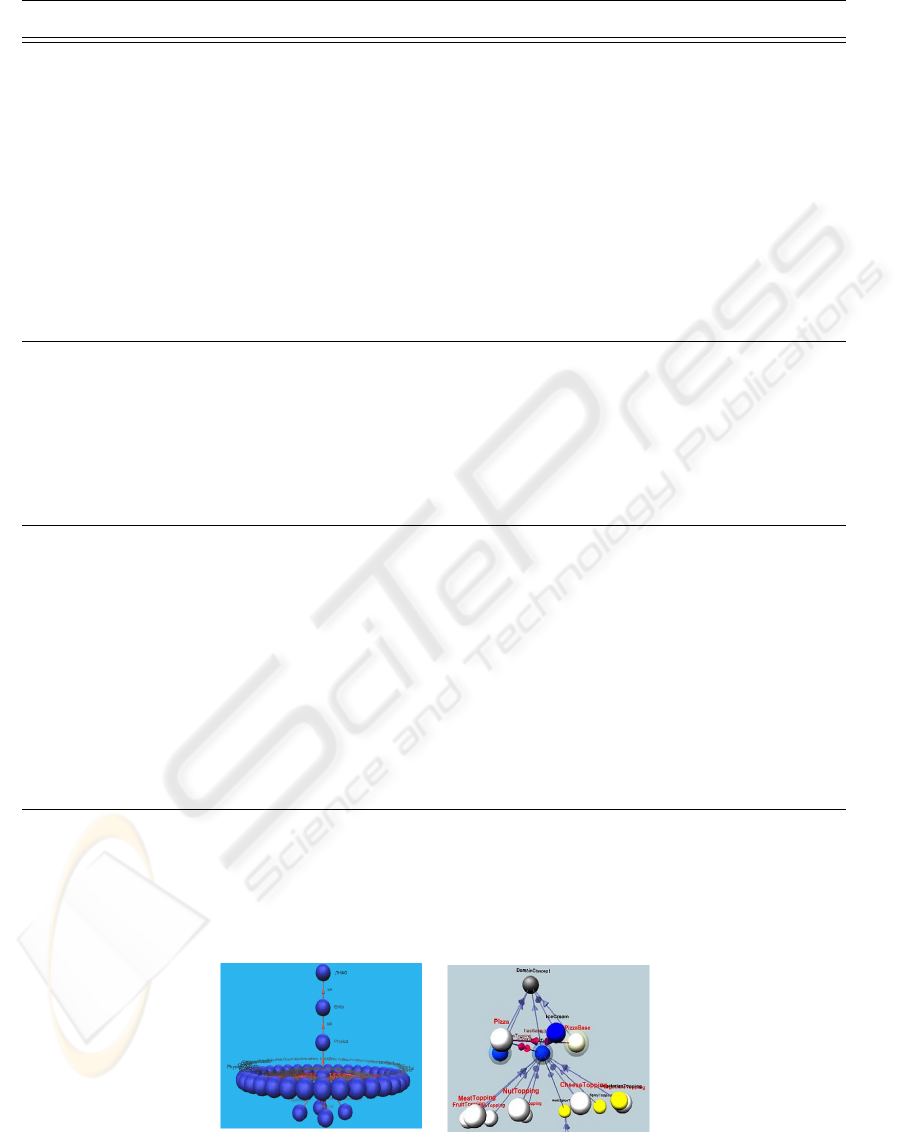
Table 2: Comparison of virtual worlds approaches.
Visualization Applications Graphical Interaction Advantages Drawbacks
system encoding techniques
Virtual worlds
-ARVis (Blanchard
et al., 2007) Figure
1(a)
-Visualization of
association rules
-Size of a cone, of a
sphere, their colors,
position of objects
on the arena
-Navigation
-Selection
-Zoom
-Order by set of
rules
-Navigation
according to
neighbor relation
-No hierarchical
representation
-Source Viewer 3D
(sv3D)(Maletic
et al., 2003) Figure
1(b)
-Visualization of
file structures
-Each code file is
represented by a
container.
-Color : type of the
control structure
-Navigation
-Zoom
-Selection
-Filtering
-History
-Screen shots
-Free
-The cylinder
position in the
container does not
represent any
variable
-No relations
between classes or
files
-No hierarchical
representation
3D trees
-SUMO (Buntain,
2008) Figure 3(a)
-OntoSphere3D
(Bosca et al., 2007)
Figure 3(b)
-Visualization of
ontologies
-Atom : concept
-Size of atom :
number of
documents
associated to the
concept
-A cluster :
concepts having
shared documents
-Zoom
-Navigation
-Easily interpretable -One hand
interaction
3D Scatterplots
-3D Scatter Plot
(VR) (Bovbjerg
et al., 2003) Figure
4(a)
-Visualization of
large data sets
-Different
colors/textures to
distinguish objects
and clusters
-The graphical
variables are :
position, shape,
size, color, sound
and texture
-Navigation
-Selection
-Zoom
-Use of sounds -Limited number of
graphical variables
-Not very efficient
-VRMiner(VR)
(Azzag et al., 2005)
Figure 4(b)
- Visualization of
multimedia data
-Color, texture,
position, shape and
sound
-Zoom
-Navigation
-Selection
-Synthetic audio
-Use of VR
techniques
-Visualzation of
large images
-Low cost
-Limited number of
graphical variables
Dynamical graphs
-PEx (Paulovich
et al., 2007) Figure
5
-Visualization of
multidimensional
data
-3D projection of
multidimensional
data
-Color coding of
apparition
frequency
-Research
-Selection
-Personalization
-Filtering
-Free
-Visualization of
both structured and
non structured data
-No detail on
demand
(a): SUMO. (b): OntoSphere3D.
Figure 3: 3D trees visualization techniques.
3D VISUALIZATION AND VIRTUAL REALITY FOR VISUAL DATA MINING - A Survey
143
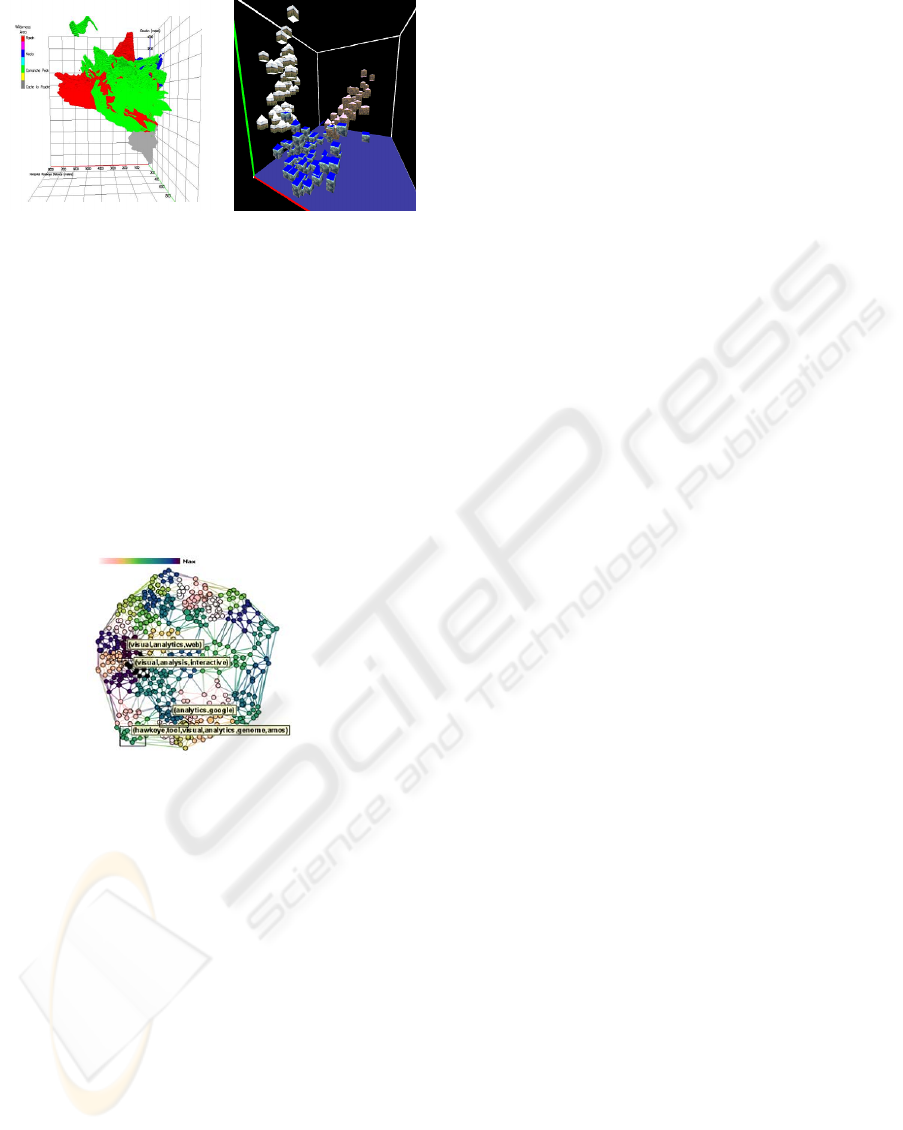
(a): 3DVDM. (b): VRMiner.
Figure 4: Examples of 3D Scatterplots.
3.3 Dynamic Graphs
Another technique based on the information galaxy
metaphor make use of dynamic graphs. Dynamic
graphs enable self organization data sets in the visu-
alization area. This approach is mainly used for the
visualization of hypertext or social networks. In this
context, a better approach is to apply a force system to
the nodes and links in order to find a minimum energy
state of the system (or steady state) and determine the
position of the nodes.
PEx :(Paulovich et al., 2007).
Figure 5: Example of Dynamic graphs.
4 CONCLUSIONS
VDM aims at an easier interpretation of data mining
algorithm results through the use of intuitive and in-
teractive visualization techniques. In this paper we
proposed a recent review of 18 visualization tech-
niques accompanied with graphical illustrations. This
techniques are compared across 5 critera : applica-
tion, graphical encoding, interaction techniques, ad-
vantages and drawbacks. Even if, the main result is
that information visualization is indeed in great part
of application fields , this study shows that there is a
lack of interaction techniques. The main techniques
proposed, by most visualization techniques, are ba-
sic techniques like : zoom, selection, navigation. The
only system that offer a navigation through neighbor-
hood relations between data is ARvis. For an efficient
data mining process, the user must be more involved
in the data mining process. Consequently, more so-
phisticated interaction techniques should be imple-
mented.
REFERENCES
Azzag, H., Picarougne, F., Guinot, C., and Venturini, G.
(2005). Vrminer: a tool for multimedia databases
mining with virtual reality. Processing and Managing
Complex Data for Decision Support, pages 318–339.
Becker, B. (1997). Volume rendering for relational data.
IEEE Symposium on Information Visualization.
Blanchard, J., Pinaud, B., Kuntz, P., and Guillet, F. (2007).
Visual analytics: A 2d-3d visualization support for
human-centered rule mining. Computers and Graph-
ics, 31(3):350–360.
Bosca, A., Bonino, D., Comerio, M., Grega, S., and Corno,
F. (2007). A reusable 3d visualization component for
the semantic web. In Web3D ’07: Proceedings of the
twelfth international conference on 3D web technol-
ogy, pages 89–96. ACM Press.
Bovbjerg, S., Granum, E., Nagel, H. R., and Vittrup,
M. (2003). Using dynamic soundscapes to sup-
port visual data mining in vr. In Simeon J. Simoff,
Monique Noirhomme-Fraiture, M. H. B. and Ankerst,
M. I., editors, Third International Workshop on Visual
Data Mining in conjunction with ICDM 2003 - The
Third IEEE International Conference on Data Min-
ing, pages 167–182.
Buntain, C. (2008). 3d ontology visualization in seman-
tic search. In Proceedings of the 46th Annual South-
east Regional Conference on ACM Southeast Regional
Conference, pages 204–208. ACM Press.
Card, S. K., Mackinlay, J. D., and Schneiderman, B. (1999).
Readings in information visualization : using vision to
think. Morgan Kaufmann publishers, San Francisco
CA, ETATS-UNIS (Monographie).
Chi, E. H. (2000). A taxonomy of visualization techniques
using the data state reference model. In INFOVIS ’00:
Proceedings of the IEEE Symposium on Information
Vizualization, pages 69–75. IEEE Computer Society
Press.
Couturier, O., Hamrouni, T., Yahia, S. B., and Nguifo, E. M.
(2007). A scalable association rule visualization to-
wards displaying large amounts of knowledge. In IV
’07: Proceedings of the 11th International Confer-
ence Information Visualization, pages 657–663. IEEE
Computer Society Press.
Doleisch, H., Mayer, M., Gasser, M., Priesching, P., and
Hauser, H. (2005). Interactive feature specification for
simulation data on time-varying grids. In Conference
on Simulation and Visualization, pages 291–304. SCS
Publishing House e.V.
Elmqvist, N., Assarsson, U., and Tsigas, P. (2009). Dy-
namic transparency for 3d visualization : Design and
evaluation. The International Journal of Virtual Real-
ity, 8(1):75–88.
IVAPP 2010 - International Conference on Information Visualization Theory and Applications
144

Fayyad, U. M., Piatetsky-Shapiro, G., Smyth, P., and Uthu-
rusamy, R. (1996). Advances in knowledge discovery
and data mining. American Association for Artificial
Intelligence.
Furnas, G. W. (1986). Generalized fisheye views. In
CHI ’86: Proceedings of the SIGCHI Conference on
Human Factors in Computing Systems, pages 16–23.
ACM Press.
Gresh, D. L., Rogowitz, B. E., Winslow, R. L., Scollan,
D. F., and Yung, C. K. (2000). Weave: a system for
visually linking 3-d and statistical visualizations, ap-
plied to cardiac simulation and measurement data. In
Proceedings of the conference on Visualization ’00,
pages 489–492. IEEE Computer Society Press.
Gtzelmann, T., Hartmann, K., Nrnberger, A., and Strothotte,
T. (2007). 3d spatial data mining on document sets for
the discovery of failure causes in complex technical
devices. In GRAPP’07 : Proceedings of the Second
International Conference on Computer Graphics The-
ory and Applications, pages 137–145. INSTICC - In-
stitute for Systems and Technologies of Information,
Control and Communication.
Ham, F. V. and Wijk, J. V. (2003). Beamtrees: compact
visualization of large hierarchies. Information Visual-
ization, 2(1):93–100.
Herman, I., Melancon, G., and Marshall, M. S. (2000).
Graph visualization and navigation in information vi-
sualization: A survey. IEEE Transactions on Visual-
ization and Computer Graphics, 6(1):24–43.
Jacquemin, C. and Jardino, M. (2002). Une interface
3d multi-
´
echelle pour la visualisation et la naviga-
tion dans de grands documents xml. In IHM ’02:
Proceedings of the 14th French-speaking conference
on Human-computer interaction (Conf
´
erence Fran-
cophone sur l’Interaction Homme-Machine), pages
263–266. ACM Press.
Johnson, B. and Shneiderman, B. (1991). Tree-maps: a
space-filling approach to the visualization of hierar-
chical information structures. In VIS ’91: Proceed-
ings of the 2nd conference on Visualization ’91, pages
284–291. IEEE Computer Society Press.
Keim, D. A., Mansmann, F., Schneidewind, J., Thomas, J.,
and Ziegler, H. (2008). Visual Analytics: Scope and
Challenges. Springer-Verlag, Berlin, Heidelberg.
Krohn, U. (1996). Vineta: navigation through virtual in-
formation spaces. In AVI’96 : Proceedings of the
workshop on Advanced visual interfaces, pages 49–
58. ACM Press.
Maletic, J. I., Marcus, A., and Feng, L. (2003). Source
viewer 3d (sv3d): a framework for software visualiza-
tion. In ICSE’03 : Proceedings of 25th ACM/IEEE
International Conference on Software Engineering,
pages 812–813. IEEE Computer Society Press.
Marroqun, V. D., Brault, J. J., and Hart, B. S. (2008). A vi-
sual data-mining methodology for seismic facies anal-
ysis: Part 2 - application to 3d seismic data. GEO-
PHYSICS, 74(1):13–23.
Mroz, L. and Hauser, H. (2001). Rtvr: a flexible java li-
brary for interactive volume rendering. In VISUAL-
IZATION’01 : Proceedings of the Conference on Vi-
sualization, pages 279–286. IEEE Computer Society
Press.
Paulovich, F. V., Oliveira, M. C. F., and Minghim, R.
(2007). The projection explorer: A flexible tool for
projection-based multidimensional visualization. In
SIBGRAPI’07 : Proceedings of the Brazilian Sympo-
sium on Computer Graphics and Image Processing,
pages 27–36. IEEE Computer Society Press.
Robertson, G., Czerwinski, M., Larson, K., Robbins, D. C.,
Thiel, D., and van Dantzich, M. (1998). Data moun-
tain: using spatial memory for document manage-
ment. In Proceedings of the 11th annual ACM sym-
posium on User interface software and technology,
pages 153–162. ACM Press.
Robertson, G. G., Mackinlay, J. D., and Card, S. K. (1991).
Cone trees: animated 3d visualizations of hierarchical
information. In CHI ’91 : Proceedings of the SIGCHI
conference on Human factors in computing systems:
Reaching through technology, pages 189–194. ACM
Press.
Schreck, T., Teku
ˇ
sov
´
a, T., Kohlhammer, J., and Fellner, D.
(2007). Trajectory-based visual analysis of large fi-
nancial time series data. ACM SIGKDD Explorations
Newsletter, 9(2):30–37.
Simoff, S. (2001). Towards the development of environ-
ments for designing visualisation support for visual
data mining. In Proceedings International Work-
shop on Visual Data Mining, pages 93–106. Simeon
J. Simoff, Monique Noirhomme-Fraiture, Michael H.
Bhlen and Mihael I. Ankerst.
Tee, S., J, T. T., kelly Kwan-liu Ma, J., and Wu, S. F.
(2004). Visual data analysis for detecting flaws and
intruders in computer network systems. IEEE Com-
puter Graphics and Applications, special issue on Vi-
sual Analytics, 24(5):27–25.
van de Wetering Kleiberg, E. and van Wijk, J. (2001).
Botanical visualization of huge hierarchies. In NFO-
VIS ’01: Proceedings of the IEEE Symposium on
Information Visualization 2001, pages 87–94. IEEE
Computer Society.
Wang, L., Zhao, Y., Mueller, K., and Kaufman, A. (2005).
The magic volume lens: An interactive focus+context
technique for volume rendering. In VIS 05 : Proced-
ing of 16th IEEE Visualization, pages 367–374. IEEE
Computer Society Press.
Wang, Y.-S., Lee, T.-Y., and Tai, C.-L. (2008). Fo-
cus+context visualization with distortion minimiza-
tion. IEEE Transactions on Visualization and Com-
puter Graphics, 14(6):1731–1738.
3D VISUALIZATION AND VIRTUAL REALITY FOR VISUAL DATA MINING - A Survey
145
