
GEO-SPADE
A Generic Google Earth-based Framework for Analyzing and Exploring
Spatio-temporal Data
Slava Kisilevich, Daniel Keim
Department of Computer and Information Science, University of Konstanz, Konstanz, Germany
Lior Rokach
Department of Information Systems Engineering and The Deutsche Telekom Laboratories
Ben-Gurion University of the Negev, Beer-Sheva, Israel
Keywords:
GIS, Data visualization, Google Earth, Geo-processing, Web services, OGC.
Abstract:
Various frameworks are being developed to support geospatial data processing and exploration. However,
these frameworks are insufficient due to their inability to support rapid development and reuse of existing
geospatial operations. To cope with the difficulties that arise, more and more Web-based solutions are being
implemented incorporating Web services and Open Geospatial Consortium (OGC)
a
standards for data inter-
change and distributed geo-processing. Although these solutions often target specific problems, they rarely
can be extended by a third party. As a result, analysts are frequently required to implement additional software
in order to complete their exploration process. In this paper, we present a unified, extensible framework that
can solve generic spatio-temporal analysis tasks. Specifically, we present the prototype of a new framework
that allows quick hypothesis definition and testing. The proposed framework, which we term GEO-SPADE,
uses Google Earth as a primary visualization platform and data interchange system. Pluggable components
can easily be integrated into the framework. We demonstrate the feasibility of the GEO-SPADE framework
by following the scenario of analysis of travel sequences near Funchal, Madeira Island.
a
http://www.opengeospatial.org
1 INTRODUCTION
Many GIS-related applications are available on the
market. Some are commercial products, like Ar-
cGIS
1
; others are open source like OpenJump
2
, Map-
Window GIS
3
, UDig
4
, GeoDa
5
, GeoVista
6
, GRASS
7
.
These applications, although written in different lan-
guages with various functionalities still share some
commonalities: extensibility through exposed APIs;
a range of geo-analytical functions; and support for
commonly used data formats. Some applications
1
http://www.esri.com/software/arcgis
2
http://www.openjump.org
3
http://www.mapwindowgis.co
4
http://udig.refractions.net
5
http://geodacenter.asu.edu
6
http://www.geovistastudio.psu.edu/jsp/index.jsp
7
http://grass.itc.it
clearly define which tasks they can perform; others
can be used as a general framework on which analyti-
cal capabilities can be built on top. The task of select-
ing the right tool for geo-analysis can be very time-
consuming since it requires time to learn the tool’s
capabilities. Learning the exposed API for extensi-
bility is another major issue, requiring a good knowl-
edge of the application’s specific programming lan-
guage as well as an understanding of often complex
sets of API functions. Dedicating development ef-
forts into understanding complex APIs usually slows
down progress in research, especially when rapid pro-
totyping of ideas and concepts is needed. Usually, the
analyst requires fast implementation of tasks and the
decision to extend the GIS application is rarely favor-
able. Consequently, to achieve the desired results, the
geo-processing task is split between multiple GIS ap-
plications. The issue of proprietary APIs and interop-
13
Kisilevich S., Keim D. and Rokach L. (2010).
GEO-SPADE - A Generic Google Earth-based Framework for Analyzing and Exploring Spatio-temporal Data.
In Proceedings of the 12th International Conference on Enterprise Information Systems - Human-Computer Interaction, pages 13-20
DOI: 10.5220/0002865000130020
Copyright
c
SciTePress

erability is addressed by OGC, which encourages de-
velopers to use standard interfaces and specifications
when implementing geo-processing.
Most GIS applications process the data locally on
the computer where the software is installed. This can
present an issue when the analyst has to run several in-
dependent, resource-consuming tasks while keeping
the system responsive. High demand for computer
resources is still another issue that requires changes
in the software architecture and the architecture of
the GIS application in particular. A need for dis-
tributed geo-processing systems was addressed in re-
cent publications (Friis-Christensen et al., 2007; Diaz
et al., 2008; Schaeffer and Foerster, 2008; Foerster
et al., 2009). Such systems split the workload be-
tween client and server, where clients are often Web
applications, accessible by multiple users while the
server performs all the required computations and de-
livers the results to the client using Web service tech-
nologies. Such architectures have several advantages
over old, closed solutions: (1) there is no need to in-
stall a Web application; (2) many users can access the
application using a Web browser; (3) the computa-
tion is performed on the server side, which relieves
the user’s computer from performing time consuming
operations; and (4) there is no need to locally store the
data (the data can be accessed directly by the service
and hosted by the service provider).
Scalable, distributed architecture, that conforms
to open standards, may solve the problem of inter-
operability and service reusability. However, the
client side still has to be developed according to spe-
cific tasks defined in advance. Since any changes
in the design or in extending the capabilities should
be performed by the body responsible for maintain-
ing the Web application, there is a need for a plat-
form, that supports easy extensibility with minimum
knowledge of the underlying API. Such a platform
should support many of the general visual data ex-
ploration approaches like brushing, focusing, multi-
ple views, linking. It should also be able to support
(geo)visualization approaches such as direct depic-
tion, visualization of abstract data summaries, and
extraction and visualization of computationally ex-
tracted patterns. It should also be capable of inte-
grating different geo-related tasks to allow the ana-
lyst to quickly generate and test her hypotheses (An-
drienko et al., 2008) Google Earth has gained in-
terest among researchers for visualizing and explor-
ing (geo)processing results. The results are com-
municated using KML (Keyhole Markup Language),
an XML-based language for geographic visualiza-
tion. Providing satellite images of the Earth’s sur-
face, Google Earth implements basic visualization
techniques like zooming and panning. With many
layers of information provided by Google and user
communities, Google Earth includes a built-in HTML
browser and allows dynamic content to be streamed
from a server in response to changes in a visible
frame. Recent publications demonstrated that Google
Earth can be effectively used for data exploration in
various areas such as: weather monitoring (Smith
and Lakshmanan, 2006), spatio-temporal data explo-
ration (Wood et al., 2007), data mining (Compieta
et al., 2007), insurance (Slingsby et al., 2008), cri-
sis management (Pezanowski et al., 2007), and spa-
tial OLAP (Martino et al., 2009). Despite these
capabilities, Google Earth is still used as a ”sec-
ondary” tool for data visualization because of its lack
of geo-analytical functionality. Google Earth usually
overcomes this geo-analytical deficiency by embed-
ding Google Earth into a Web application using its
JavaScript API. ”Missing” features can then be im-
plemented using Network Link element, which is part
of KML, to point to the URL of the underlying server
to request a specific operation. Although the Network
Link feature is used for creating dynamic content, it
allows data to flow in only one direction, from the
server to Google Earth in response to the changes in
the visual boundaries. Clearly, this feature does not
allow more complex operations like passing parame-
ters interactively, running the data mining algorithm
on the server, and returning the results for a particu-
lar setup of objects being visualized by Google Earth.
Other mechanisms for performing such operations are
required.
Recently, embedding the Google Earth in desktop
applications became possible
8
using the Google Earth
Web browser plugin
9
COM interface. This makes it
possible to write custom applications around Google
Earth in high level languages like c# and to com-
pletely control the logic of the application thus by-
passing the limitations of the stand-alone version of
Google Earth. This possibility and the constraints of
current GIS systems have encouraged us to develop a
prototype desktop system called GEO-SPADE (GEO
SPAtiotemporal Data Exploration). In GEO-SPADE,
Google Earth plays a primary role as geo-browser and
the missing geo-processing features can be added on
the server side using any available language. The re-
sults are delivered to the client in the form of KML
files using Web service technology.
The goals of the paper can be summarized as fol-
lows: (1) to enhance the capabilities of Google Earth
by making it a primary tool for geo-related analy-
8
http://code.google.com/p/winforms-geplugin-control-
library/
9
http://earth.google.com/plugin/
ICEIS 2010 - 12th International Conference on Enterprise Information Systems
14

sis; (2) to demonstrate that Google Earth is capa-
ble of assisting in geo-processing, visualization and
data exploration methods by embedding it into a cus-
tomizable desktop application; and (3) to present a
SOA-based architecture that allows for quick hypoth-
esis generation and testing by implementing extensi-
ble components.
We demonstrate the feasibility of our prototype
by following an analysis scenario of travel sequences
near Funchal, Madeira Island.
2 RELATED WORK
Issues in classical desktop GIS and the need to dele-
gate GIS functionality using SOA (Service-oriented
Architecture) are addressed in a series of recent
publications and summarized by (Brauner et al.,
2009). The main issues in geo-processing services
are: reusability of services; the ability to solve com-
plex geo-processing problems using orchestrated ser-
vice chains; building service descriptions for easy ser-
vice consumption; and the stateless nature of web ser-
vices (Friis-Christensen et al., 2007; Brauner et al.,
2009).
There have been various attempts in recent years
to deal with these issues. For example, geo-
processing functionality of GRASS, a desktop GIS
application, was wrapped by Web Services using
OGC WPS
10
(Web Processing Service) specifica-
tion (Cepick
`
y and Becchi, 2007; Brauner and Scha-
effer, 2008). The WPS specification, which defines
a standardized service interface to publish and per-
form geospatial processes over the network, consists
of three operations: GetCapabilities, DescribePro-
cess and Execute. All have to be implemented by the
service provider. Since the WPS defines only the stan-
dard interfaces, the responsibility of a service con-
sumer is to acquire complete information about the
specifications of a given Web service using GetCapa-
bilites and DescribeProcess interface functions or via
WSDL (Web Service Definition Language).
Integration, reusability and modularity of Web
services accessing SDI (Spatial Data Infrastructures)
were addressed by (Diaz et al., 2008). They wrapped
several FOSS (Free Open Source Software) libraries
as WPS-based services and implemented in a proto-
type system for creating hydrological models.
Integrating WPS-based services into Google Earth
is addressed by (Foerster et al., 2009). Their approach
has two parts to it. In the first part, the WPS client
built on top of the uDig (desktop, Java-based GIS sys-
10
http://www.opengeospatial.org/standards/wps
tem) exports configured processes into a KML file. In
the second part, the KML file is loaded into Google
Earth, which triggers WPS processes using Network
Link element. The advantage of the WPS approach
is that the exported processes can be consumed by
the vast community of people using applications that
handle KML formats such as Google Earth or Google
Maps. This advantage was addressed in recent pub-
lications (Smith and Lakshmanan, 2006; Slingsby
et al., 2008). However, the proposed approach has
several disadvantages: although the approach has two
parts, they are not autonomous and require manual
implementation (configuration of the processes using
WPS client, creation and export of KML and dissem-
ination of the results). Another aspect is lack of inter-
action and control over the geo-process exported into
KML. As soon as KML is loaded into the application
with Network Link, the process will be triggered and
the results returned.
The client side, which usually involves data visu-
alization and manipulation, still remains more hetero-
geneous than the server side, since the way the data
is presented cannot be enforced by standard specifi-
cations and interfaces. Here the choice of an appro-
priate software is driven by the needs of an expert.
As was already mentioned, dozens of GIS applica-
tions are available, capable of solving specific spatial
processing tasks and of supporting geo-visualization.
When this is not the case, custom solutions and archi-
tectures are proposed (Wachowicz et al., 2002; Lund-
blad et al., 2009). However, the current trend in data
visualization and exploration is to use mass-market
applications such as Google Earth for visualization,
combined with open source technologies for data pro-
cessing and storage (Wood et al., 2007; Pezanowski
et al., 2007; Martino et al., 2009).
Bringing geo-processing capabilities and Google
Earth together is addressed by (Pezanowski et al.,
2007) to support crisis management scenarios. For
this task, ”Google Earth Dashboard” was proposed.
It combines several technologies: Adobe Flex, WMS
(Web Map Service), WFS (Web Feature Service),
WPS services and Google Earth as the cornerstone.
The communication with services and the creation of
dynamic data were carried out using the Network Link
feature, whose disadvantages were discussed in Sec-
tion 1.
(Wood et al., 2007) demonstrated how visually ex-
ploring mobile directory service log files with spatial,
temporal and attribute components can be performed
using Google Earth in combination with other open
source technologies like MySQL, PHP and LandSerf.
(Wood et al., 2007) discusses several aspects, like vi-
sual encodings, color and overplotting and shows how
GEO-SPADE - A Generic Google Earth-based Framework for Analyzing and Exploring Spatio-temporal Data
15

Google Earth handles these features.
(Slingsby et al., 2008) presented the feasibility of
exploring of catastrophic events and potential loss of
information. The tasks that must be performed are
outlined. The methods, with which Google Earth can
handle such tasks, include: mapping, filtering by at-
tribute, space, time, spatial aggregation, creation of
new views.
The key differences between the existing architec-
tures and prototypes and the concept presented in this
paper can be summarized as follows: we demonstrate
a generic solution from the client and server side per-
spective and our approach eliminates the above men-
tioned disadvantages by integrating Google Earth into
a custom GIS client that invokes geo-processing Web
services, returns results as KML streams and loads the
results directly into Google Earth instance. The expert
has a complete control over geo-processing and every
visualized object. The generic framework we propose
can be used for solving many geo-related problems
without imposing a specific technology.
To our knowledge, the work described in this pa-
per is the first that tries to implement an extensible
geo-processing framework. This framework can be
used for implementing a variety of geo-related tasks
from visualization to complex geo-processing with
Google Earth integrated into a desktop application,
offering enhanced Google Earth capabilities, plug-
gable components and SOA-based architecture.
3 GEO-SPADE APPLICATION
AND ARCHITECTURE
In this section we present the main features of the sys-
tem and discuss the proposed architecture.
3.1 Overview
The client is an MDI (Multiple Document Interface)
desktop application that allows multiple windows to
reside under a single parent window. The client is
written in c# programming language. We tried to keep
the application as generic as possible by implement-
ing the core features shared by all tasks. However,
further extensibility is possible. The main user inter-
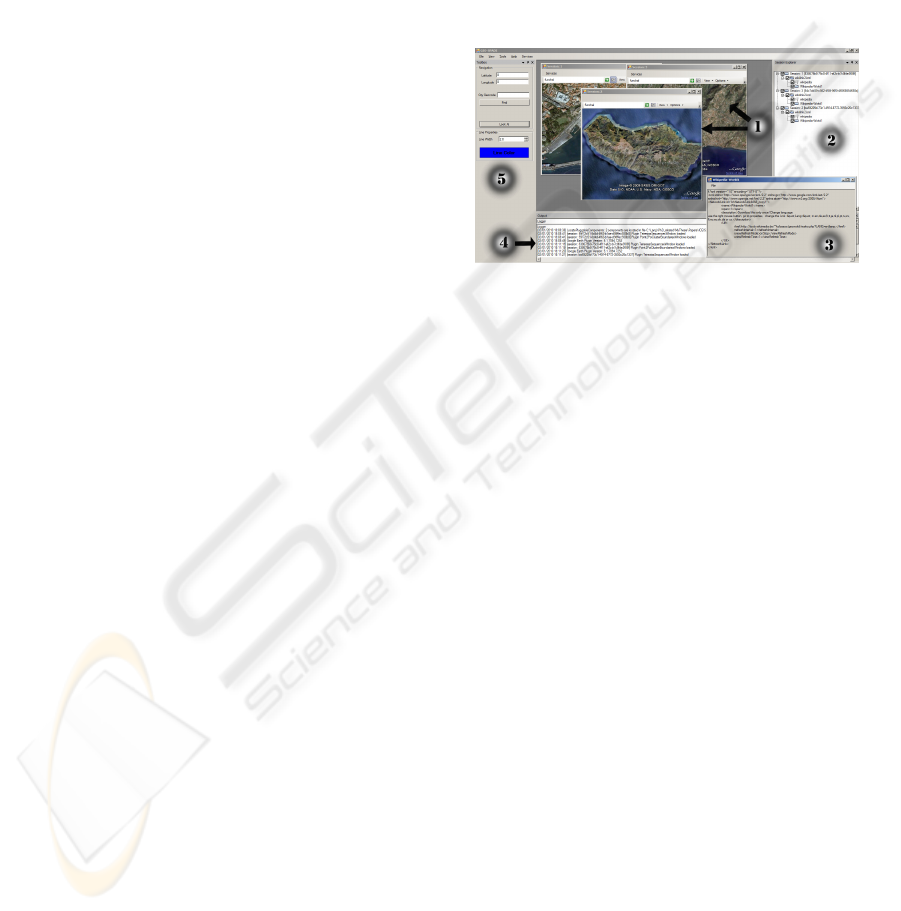
face is presented in Figure 1.
Views (labeled as 1 in Figure 1) are the main views
that encapsulate instances of Google Earth. The user
can open several windows and multiple instance of
Google Earth will be instantiated. The basic function-
ality of these views is the same as in the stand-alone
Google Earth application: navigation to a specific lo-
cation, panning, zooming, and KML layer loading.
We also added support for custom shape creation by
drawing on top of the map. This feature is described
in further detail in the Section 3.2.
The session tree window (labeled as 2 in Figure 1)
maintains a list of open Google Earth views (sessions)
and KML objects that belong to every session. This
window supports removing, renaming and hiding of
any KML object. Moreover, the textual representation
of a KML object (labeled as 3 in Figure 1) can be
obtained by selecting it using a session tree node.
The toolbox window (labeled as 4 in Figure 1) is
utilized for basic geo-coding and defining the width
and color of a line used for manual region selection
on top of the map of the current session.
The window labeled as 5 in Figure 1 records event
logs and exception messages.
3.2 Main Features
In this section we outline the main features of the pro-
posed framework:
Multiple Instances of the Google Earth. Every
view encapsulates a new Google Earth instance (la-
beled as 1 in Figure 1). This feature allows the ana-
lyst to work independently on different regions or to
separate the visualization of different objects applied
to the same area.
Synchronization between Views. When the exact
positioning of several views is required for compar-
ison, the view’s boundaries can be synchronized to
match the boundary of another view.
Session-based Views. We introduced a notion of
session when working with views. As was already
mentioned, the analyst may work simultaneously with
multiple views. If several time-consuming algorithms
are activated, the application should know in which
view the results of computation are directed. Since
Web services are usually stateless, that is to say each
individual request sent from the client should con-
tain all the information because the server does not
store the session state data (MicrosoftTeam, 2009),
the session id of the view is sent along with other ser-
vice specific information. When the service produces
the KML result, the original session id is attached in
the response. Therefore, when the client receives the
server response, the framework tries to match the ses-
sion id extracted from the KML to all existing ses-
sions. If one is found, the result is visualized in that
view, otherwise, the result is discarded. The discard-
ing of a resul can occur, for example, when the ana-
lyst closes the view that was active when the service
ICEIS 2010 - 12th International Conference on Enterprise Information Systems
16
request was performed. Sessions and objects that be-
long to the session are displayed in a session tree (la-
beled as 2 in Figure 1).
Shape Drawing on top of Google Earth. We an-
ticipated that some tasks may require manual region
selection on top of the Google Earth map. This selec-
tion can be used in different scenarios such as finding
objects that are located within the boundaries of the
selection. The region creation is described by coor-
dinates, line color and width, and stored as a regular
KML object that can later be saved and reused.
Pluggable Components. To keep the core system
as simple as possible, it includes only the compo-
nents necessary for storing and visualizing KML files,
maintaining views, logging and exception manage-
ment. The complexity of geo-related tasks is dele-
gated to the custom implementation using pluggable
components. The components follow specific require-
ments and conceptually do not differ from the plugins
used in other frameworks like MapWindow GIS or
OpenJUMP.
View Separability. This is not strictly the feature of
the framework, but the outcome of the MDI architec-
ture. If two or more displays are available, the views
and pluggable components can be positioned on dif-
ferent displays in order to isolate different tasks and
to free more visual space. For example, the analyst
may want to position two maps on separate displays
or separate between session views and the main UI.
Chaining of Analysis Steps. Results obtained from
the server are visualized using KML. However, the el-
ements of the KML are objects that hold some state
and relevant information (for example, cluster bound-
aries or area). The analyst can further refine the re-
sults by focusing on the subset of the obtained ob-
jects. Consequently, a new invocation of an algorithm
can be accomplished using the selected objects to pass
information.
Service Oriented Architecture. Allows service
reuse and interoperability across programming lan-
guages and platforms. Changes in the service im-
plementation remain transparent to the client as long
as the number and naming of parameters in a service
contract do not change.
3.3 Architecture
The proposed architecture is based on a thin-client
paradigm whose main purpose is to pass off geopro-
cessing to a remote server using Web services. The
core system visualizes the results, drawing upon any
of the Google Earth wrapped views as described in
Section 3.2. However, the provider of the plugin com-
ponent is responsible for the basic UI view and com-
plex interaction if needed (see Section 4 for illustra-
tion).
Figure 1: Basic GEO-SPADE components.
The selection of a communication protocol de-
pends on the service provider and different proto-
cols can be integrated as extension points. However,
the application proposes asynchronous REST (repre-
sentational state transfer) services (Fielding, 2000).
REST is an architectural style of networked systems
and relies on HTTP protocol and data exchange based
on XML. Since REST does not deal with implemen-
tation details, the Web services based on REST can be
created and consumed by different programming lan-
guages. The advantages of using REST-like architec-
ture in GIS are described in WPS standard specifica-
tions. The extension mechanism is performed by cre-
ating pluggable UI components whose basic purpose
is to obtain from the user the parameters for invok-
ing the Web service. The overall architecture of the
application can be seen in Figure 2. The geoprocess-
ing task can be provided as one pluggable component
and/or can be split into a chain of steps. The server
side is presented as a collection of geo-processing ser-
vices.
4 USE CASE
The purpose of this section is to demonstrate the ca-
pabilities of the presented prototype system. We se-
lected a scenario that analyzes travel sequences using
geo-tagged photos. The analysis of people’s move-
ment has become a major topic in different domains
GEO-SPADE - A Generic Google Earth-based Framework for Analyzing and Exploring Spatio-temporal Data
17
GEO-SPADE Application
Plugin
Component 1..M
Web Service
Gateway 1..K
Web service
Endpoint 1..P
Session 1
Google Earth
Session 2
Google Earth
Session N
Google Earth
Figure 2: GEO-SPADE architecture.
such as transportation management and tourism (Gi-
rardin et al., 2008; Andrienko et al., 2009). Recently,
the analysis of travel sequences and people’s move-
ment using geo-tagged photos has become possible
due to the availability of photo sharing sites like Flickr
or Panoramio that provide public APIs to collect in-
formation from millions of shared photos. In our re-
cent work (Kisilevich et al., 2010a; Kisilevich et al.,
2010b), we defined a number of tasks for analyz-
ing attractive areas, people’s behavior and movement.
GEO-SPADE performed the analysis.
Without going into much detail regarding algo-
rithms involved in a task processing, we show how
GEO-SPADE can facilitate the task of finding fre-
quent travel sequence patterns in an arbitrary region
of the World (Kisilevich et al., 2010a). We outlined
six possible steps for completing the task. These steps
actively involve the analyst in the process of finding
sequence patterns by reviewing the results of every
step in the process, changing the parameters and acti-
vating the new steps using results (a subset of) of the
previous step.
In the first step, presented in Figure 3, the analyst
selects the desired area. The visible frame constitutes
the boundaries of the region.
Figure 3: Step 1. Selection of the area of interest.
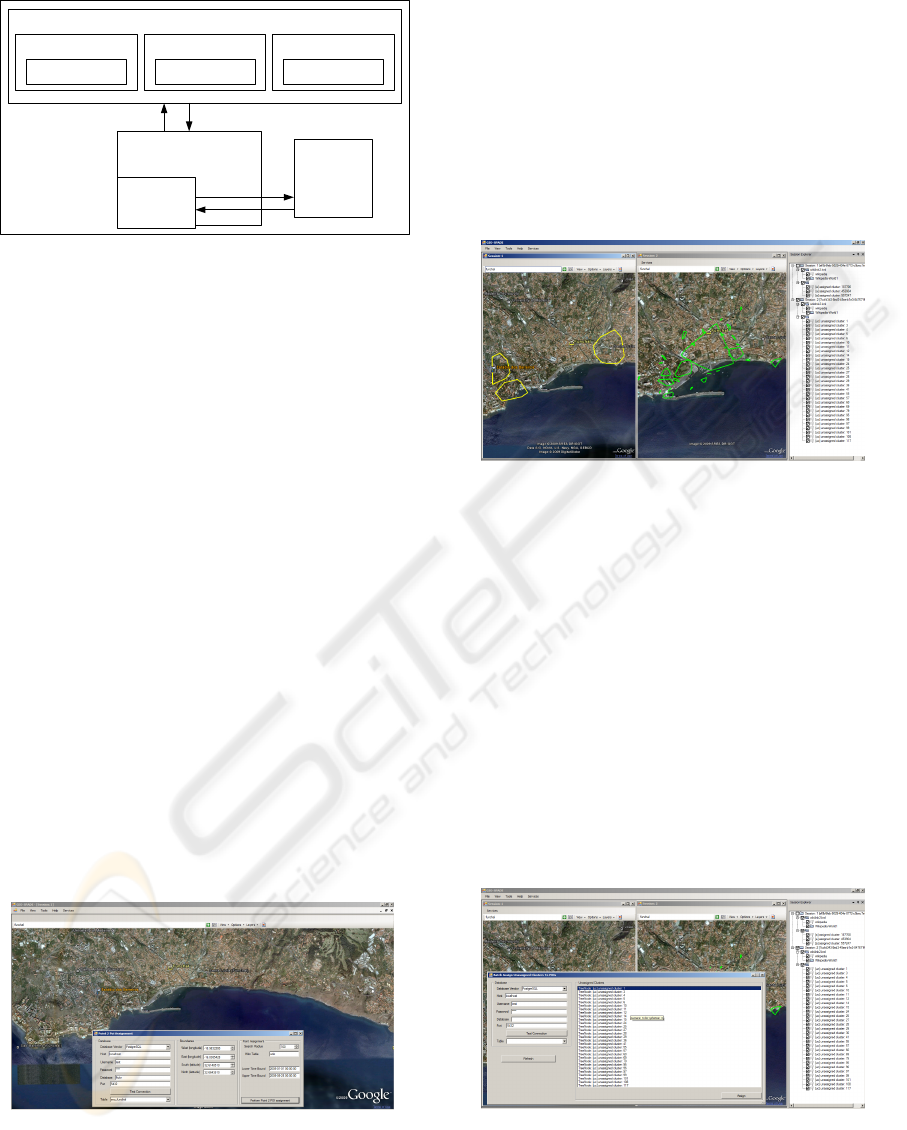
The process of finding travel sequences is divided
into two parts. In the first part, every photo location is
matched against a database of points of interest (in our
case we used the Wikipedia database) and the closest
POI is assigned to the photo. This creates clusters in
which every photo is assigned to existing POIs. In
the second part, the remaining unassigned photos are
clustered using a density-based clustering algorithm.
The results of the second step are presented in Fig-
ure 4. The left part of the figure shows clusters in
which photos were assigned to known POIs, while the
right part of the figure presents clusters of photos that
were not assigned to a POI.
Figure 4: Step 2. Multiple view of regions assigned to some
existing POI (left) and regions where no POI was found
(right).
In step 3, the analyst should inspect the created
clusters and perform the clustering again if needed. If
steps 1 and 2 are satisfactory, the analyst can inspect
the clusters of unassigned photos. She may remove
some clusters that are irrelevant or unimportant using
either the statistical information of the cluster (num-
ber of photos and owners in a cluster) or her back-
ground knowledge of the area. The session window
on the right lists all the unassigned clusters. Figure 5
summarizes this step by presenting a view in which
the analyst can select unassigned clusters and artifi-
cially create a new POI identification for every se-
lected cluster.
Figure 5: Step 3. Selection of unassigned regions and cre-
ation of artificial POIs.
After performing step 3, the analyst may want to
see the results of cluster to a POI assignment. This
ICEIS 2010 - 12th International Conference on Enterprise Information Systems
18
can be done in the same session window or by open-
ing another session such as presented in Figure 6.
Figure 6: Step 4. Combined view of all regions visited by
people.
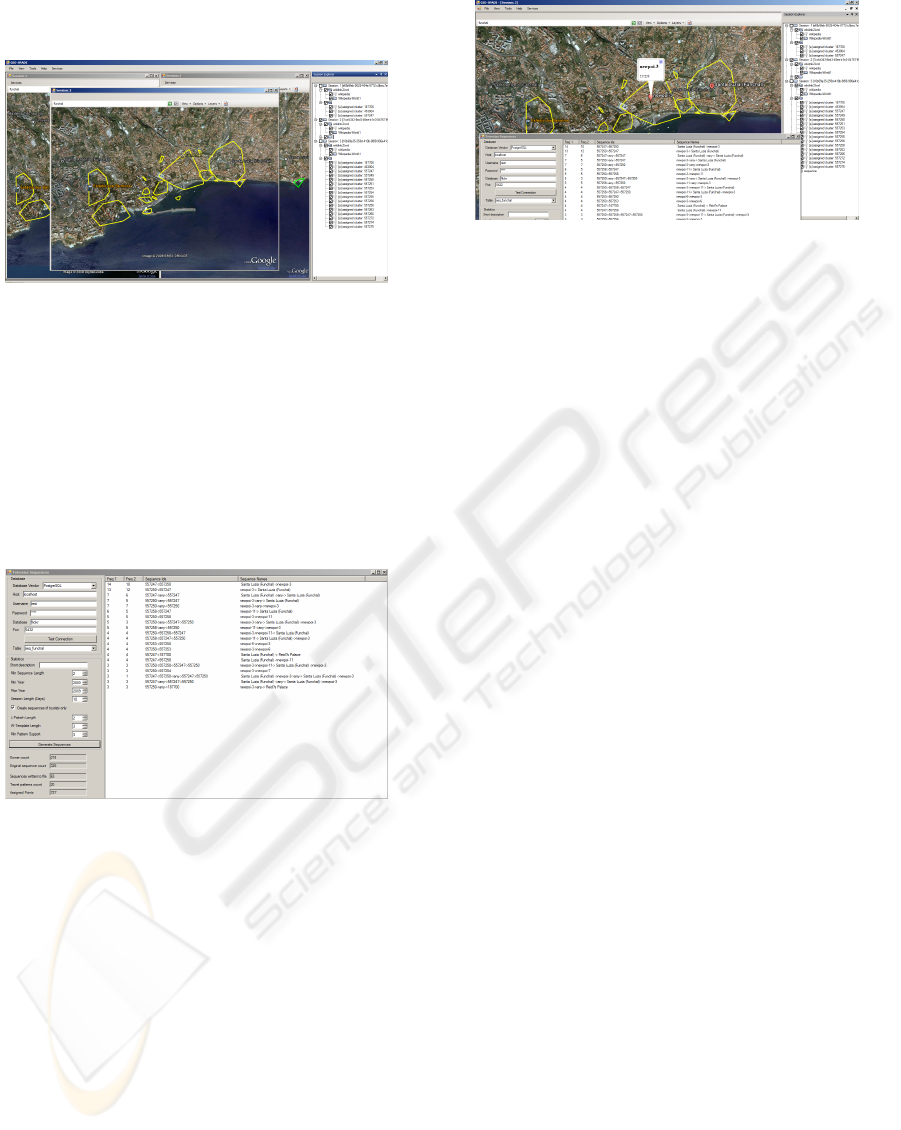
In this step, the analyst generates sequence pat-
terns from the clusters that were assigned to existing
and artificial POIs. Figure 7 shows a form in which
the analyst can select such parameters as: database
properties and the length of generated patterns. When
sequence patterns are generated, they are presented
by POI names in the main view along with additional
information (frequency and cluster id’s).
Figure 7: Step 5. Sequence pattern generation.
The most frequent pattern generated is Santa Lu-
cia ⇒ newpoi-3. While Santa Lucia is a parish in the
district of Funchal and may be known to the domain
expert, newpoi-3 is a name assigned by the system
to an area in which the Wikipedia database does not
contain a known POI. Clearly, this area should be vi-
sualized to give the analyst a hint about the sequence.
Sequences can be highlighted by clicking on the se-
quence pattern. Placemarks will be added to the cen-
ters of the areas that are part of the selected sequence
and the number assigned to them will highlight the
relative order of the area in the sequence. In the case
of Santa Lucia ⇒ newpoi-3, Santa Lucia will by high-
lighted with a number one, while newpoi-3 will get
number two, Figure 8.
Figure 8: Step 6. Combined view of obtained sequence
patterns and map. Highlighting of regions by clicking on
the sequences.
5 CONCLUSIONS AND FUTURE
WORK
In this paper we presented a framework called GEO-
SPADE based on service-oriented architecture. On
the client side, we demonstrated that Google Earth is
capable of performing data exploration and visualiza-
tion tasks by embedding it into a customizable appli-
cation using high level language. We enhanced those
capabilities of Google Earth that are not available in a
stand-alone version such as manual region selection,
multiple and synchronized views. We also built the
framework around pluggable components.
On the server side, the SOA-based architecture al-
lows for distributed processing of time and resource-
consuming tasks as well as reduced coupling between
the client and service implementation details. This
feature facilitates rapid development. The analyst
may generate a hypothesis and formulate the tasks
needed to test it. The developer’s task is to create
service implementation and pluggable UI components
that interface with the services. These services per-
form computations and return results in the form of
KML streams.
Since the KML holds the description of visualiza-
tion, it can be easily stored and reused in any system
that supports KML file format. Moreover, the service
oriented nature of the framework allows other experts
to reuse services.
We demonstrated the feasibility of our prototype
by following a scenario of finding frequent travel se-
quences.
In future research we will concentrate on enhanc-
ing the capabilities of the framework and extending
the use of the framework by working on various GEO-
related problems.
GEO-SPADE - A Generic Google Earth-based Framework for Analyzing and Exploring Spatio-temporal Data
19

ACKNOWLEDGEMENTS
This work was partially funded by the German Re-
search Society (DFG) under grant GK-1042 (Re-
search Training Group “Explorative Analysis and Vi-
sualization of Large Information Spaces”), and by
the Priority Program (SPP) 1335 (“Visual Spatio-
temporal Pattern Analysis of Movement and Event
Data”). The authors thank Fraser Chapman for pro-
viding Google Earth wrapper library.
REFERENCES
Andrienko, G., Andrienko, N., Bak, P., Kisilevich, S.,
and Keim, D. (2009). Analysis of community-
contributed space-and time-referenced data (example
of panoramio photos). In GIS ’09: Proceedings of the
17th ACM SIGSPATIAL International Conference on
Advances in Geographic Information Systems, pages
540–541.
Andrienko, G., Andrienko, N., Dykes, J., Fabrikant, S., and
Wachowicz, M. (2008). Geovisualization of dynam-
ics, movement and change: key issues and developing
approaches in visualization research. Information Vi-
sualization, 7(3):173–180.
Brauner, J., Foerster, T., Schaeffer, B., and Baranski, B.
(2009). Towards a research agenda for geoprocessing
services. In The 12th AGILE International Conference
on Geographic Information Science.
Brauner, J. and Schaeffer, B. (2008). Integration of grass
functionality in web based sdi service chains. In Aca-
demic paper on the FOSS4G Conference, Cape Town.
Cepick
`
y, J. and Becchi, L. (2007). Geospatial processing
via internet on remote servers–pywps. OSGeo Jour-
nal, 1(1).
Compieta, P., Di Martino, S., Bertolotto, M., Ferrucci, F.,
and Kechadi, T. (2007). Exploratory spatio-temporal
data mining and visualization. Journal of Visual Lan-
guages and Computing, 18(3):255–279.
Diaz, L., Granel, C., Gould, M., and Olaya, V. (2008). An
open service network for geospatial data processing.
In An Open Service Network for Geospatial Data Pro-
cessing: Free and Open Source Software for Geospa-
tial (FOSS4G) Conference.
Fielding, R. T. (2000). Architectural styles and the design
of network-based software architectures. PhD thesis,
University of California, Irvine. Chair-Taylor, Richard
N.
Foerster, T., Schaeffer, B., Brauner, J., Jirka, S., and Muen-
ster, G. (2009). Integrating ogc web processing ser-
vices into geospatial mass-market applications. IEEE
GeoWS.
Friis-Christensen, A., Ostlander, N., Lutz, M., and Bernard,
L. (2007). Designing service architectures for dis-
tributed geoprocessing: Challenges and future direc-
tions. Transactions in GIS, 11(6):799.
Girardin, F., Fiore, F. D., Ratti, C., and Blat, J. (2008).
Leveraging explicitly disclosed location information
to understand tourist dynamics: a case study. Jouranl
of Location Based Services, 2(1):41–56.
Kisilevich, S., Keim, D., and Rokach, L. (2010a). A novel
approach to mining travel sequences using collections
of geo-tagged photos. In The 13th AGILE Inter-
national Conference on Geographic Information Sci-
ence.
Kisilevich, S., Krstajic, M., Keim, D., Andrienko, N., and
Andrienko, G. (2010b). Event-based analysis of peo-
ples activities and behavior using flickr and panoramio
geo-tagged photo collections. (submitted).
Lundblad, P., Eurenius, O., and Heldring, T. (2009). In-
teractive visualization of weather and ship data. In
Proceedings of the 13th International Conference In-
formation Visualisation, pages 379–386, Washington,
DC, USA. IEEE Computer Society.
Martino, S. D., Bimonte, S., Bertolotto, M., and Ferrucci, F.
(2009). Integrating google earth within olap tools for
multidimensional exploration and analysis of spatial
data. In Proceedings of the 11th International Confer-
ence on Enterprise Information Systems, pages 940–
951.
MicrosoftTeam (2009). Microsoft Application Architecture
Guide. Microsoft Press.
Pezanowski, S., Tomaszewski, B., and MacEachren, A.
(2007). An open geospatial standards-enabled google
earth application to support crisis management. Ge-
omatics Solutions for Disaster Management, pages
225–238.
Schaeffer, B. and Foerster, T. (2008). A client for distributed
geo-processing and workflow design. Location Based
Services Journal, 2(3):194–210.
Slingsby, A., Dykes, J., Wood, J., Foote, M., and Blom,
M. (2008). The visual exploration of insurance data
in google earth. Proceedings of Geographical Infor-
mation Systems Research UK (GISRUK)(Manchester,
UK, 2007), pages 24–32.
Smith, T. and Lakshmanan, V. (2006). Utilizing
google earth as a gis platform for weather applica-
tions. In 22nd International Conference on Inter-
active Information Processing Systems for Meteorol-
ogy, Oceanography, and Hydrology, Atlanta, GA, 29
January-2 February 2006.
Wachowicz, M., Ying, X., Ligtenberg, A., and Ur, W.
(2002). Land use change explorer: A tool for geo-
graphic knowledge discovery. In In Anseling, L., Rey
S.J. (eds), New Tools for Spatial Data Analysis, Pro-
ceedings of the CSISS specialist meeting.
Wood, J., Dykes, J., Slingsby, A., and Clarke, K. (2007). In-
teractive visual exploration of a large spatio-temporal
dataset: Reflections on a geovisualization mashup.
IEEE Transactions on Visualization and Computer
Graphics, 13(6):1176.
ICEIS 2010 - 12th International Conference on Enterprise Information Systems
20
