
PERFORMANCE OVERHEAD OF PARAVIRTUALIZATION ON
AN EXEMPLARY ERP SYSTEM
André Bögelsack, Helmut Krcmar and Holger Wittges
Technische Universitaet Muenchen, Boltzmannstraße 3, Garching, Germany
Keywords: Performance, ERP System, Paravirtualization, Xen.
Abstract: This paper addresses aspects of performance overhead when using paravirtualization techniques. To
quantify the overhead the paper introduces and utilizes a new testing method, called the Zachmann test, to
determine the performance overhead in a paravirtualized environment. The Zachmann test is used to
perform CPU and memory intensive operations in a testing environment consisting of an exemplary
Enterprise Resource Planning (ERP) system and a Xen hypervisor derivate. We focus on two issues: first,
the performance overhead in general and second, the analysis of “overcommitment” situations. Our
measurements show that the ERP system’s performance suffers up to 44% loss in virtualized environments
compared to non-virtualized environments. Extreme overcommitment situations can lead to an overall
performance loss up to 10%. This work shows the first results from a quantitative analysis.
1 INTRODUCTION
ERP systems are the backbone of today’s business
process in large enterprises. A lot of ERP systems
are running inside virtual machines to save hardware
costs or to decrease administration costs. But beside
such positive effects of virtualization, there is a
negative effect: the performance decrease. A
common sense in the area of virtualization is the
performance decrease of any application running
inside a virtual machine. To our knowledge there is
no research available dealing with the performance
of an ERP system in a virtual machine. Due the
importance of ERP systems we focus on this
research area and present first quantitative results.
In the field of hardware virtualization two types
of virtualization are distinguished: full virtualization
and paravirtualization. For a detailed analysis of
these types see (Jehle, 2008). In this paper we focus
on paravirtualization as this is a popular research
field see e.g. (Barham 2003, Cherkasova 2005,
Matthews 2007, Mennon 2005, Ongaro 2008,
Whitaker 2002, Youseff 2006 and Zhang 2008).
According to (Huang, 2006), there are three main
performance overhead aspects of virtualization:
Impact on CPU
Impact on memory
Impact on I/O
We focus on (1) the performance aspects of CPU
and memory overhead and (2) the scalability of the
virtualization solution.
Regarding the first aspect several research was
done already. In (Barham 2003), (Matthews 2007) or
(Cherkasova 2005) standard benchmarks from SPEC
are used to determine the performance overhead.
Here we will present a new performance test, called
Zachmann test, which stresses the CPU and the
memory of the underlying machine by utilizing the
mechanisms of the ERP system. We use this test to
estimate the performance overhead.
The second aspect focuses on the scalability of
the virtualization solution and answers questions e.g.
what happens when the hardware is overstrained
with a lot of virtual machines.
The rest of the paper is organized as follows:
section 2 describes the architecture of the ERP
system and explains the Zachmann test and the
testing configuration. Section 3 presents the main
results whereas in section 4 we give an outlook on
further research.
2 ARCHITECTURE & TESTING
CONFIGURATION
This section describes the exemplary architecture of
347
Bögelsack A., Krcmar H. and Wittges H. (2010).
PERFORMANCE OVERHEAD OF PARAVIRTUALIZATION ON AN EXEMPLARY ERP SYSTEM.
In Proceedings of the 12th International Conference on Enterprise Information Systems - Databases and Information Systems Integration, pages
347-354
DOI: 10.5220/0002867803470354
Copyright
c
SciTePress

the used ERP system. Knowing the architecture is
important for understanding of the Zachmann test.
The test configuration (hardware and software) will
be explained in the last section.
2.1 Architecture of an Exemplary ERP
System
In order to understand the behavior of the ERP
system when running tests, it is essential to describe
the architecture of the ERP system. Here we choose
a SAP system as one exemplary ERP system. It
contains an application server and a database server.
The application server consists of the following
processes:
dispatcher process, which is responsible to
distribute request to other processes
work processes, which handle short time user
requests
update process, which writes data changes into
the database
enqueue process, which creates and deletes
data locks inside the SAP system itself
batch process, which is responsible for
handling time-consuming requests
message server, which coordinates the
communication inside the SAP system and the
communication coming from outside the SAP
system
graphic process, which is responsible for
graphical tasks
spool process, which coordinates printing
jobs.
In addition to the application server the SAP
system contains a database server. The architecture
of the database server depends on the database
managements system (DBMS) used. Here the
architecture of the DBMS is neglected as our
performance test stresses the application server in
particular.
Besides the database server, the SAP system uses
the network to communicate with the database as
well as with other SAP systems. As the tests take
place on one physical server only, the network can
be ignored.
2.2 Zachmann Test
This section describes the Zachmann test, which was
originally developed by Günther Zachmann from
SAP and is named after him. In this section we
describe the test and explain how the metric of the
test can be understood. Moreover we characterize
the test.
2.2.1 General Description
There are no ERP related SPEC benchmarks
available. We found SPEC benchmarks related to 10
categories, like CPU or Java applications (SPEC,
2008). But SPEC does not provide any standardized
ERP benchmark. Therefore the Zachmann test was
chosen to evaluate the performance overhead. The
test is a SAP developed test for testing CPU and
memory capabilities of a server running a SAP
system. Currently it is implemented into the SAP
Linux Certification Suite (SLCS) (see (Kühnemund,
2007)). The Zachmann test is based on a SAP
system and uses the special architecture and the
internal mechanisms of the SAP system: internal
communication between several processes, closely
interaction with the operating system and internal
data processing mechanisms of the SAP system e.g.
locks. In this it differs from synthetic SPEC or web
server benchmark tests.
The first action in the Zachmann test is the
creation of an internal table. Starting e.g. two work
processes will result in the creation of two internal
tables. These internal tables are about 300MB big
and contain random data, such as a lot of return
codes. An internal table is equivalent to a database
table (two-dimensional structure) but is held in the
internal buffer of the SAP system, which means in
the buffer of the work processes. The buffer of a
work process is realized as a shared memory section
in the operating systems. In the end the memory
consumption of one work process is about 1GB
RAM. After the creation of the internal table the
program randomly loops over the table content by
selecting one record, reading the selected record
before going on to the next record. The next record
is determined randomly again. This pattern is
repeated for 900 seconds (clock time of the
machine).
2.2.2 Calculating throughput
After 900 seconds each work process stops
executing the Zachmann test automatically and
reports the accessed data records into a file. These
files are then used to calculate the average
throughput per CPU. It is calculated as follows:
1
C
C
C
T
P
T
T
N
(1)
The average throughput T
T
is the result of
summing up the throughput of each configured work
ICEIS 2010 - 12th International Conference on Enterprise Information Systems
348

process T
C
and dividing it through the numbers of
CPU N
P
. This results in the throughput per CPU.
The number of work processes is expressed by C.
An example may illustrate this: Assume a 4 CPU
machine with 4 configured work processes per CPU.
Therefore we need to sum up 16 results from the
work processes and divide this result through 4 CPU
as we are interested in the result per CPU.
2.2.3 Test Characteristics
The characteristic of the Zachmann test is a high
CPU and memory load. The work processes access
the RAM of the machine very often as the internal
tables of the Zachmann test are held in the buffers of
the SAP system. Because of the random access onto
the internal tables, the CPU is utilized with a high
load. Configuring too much work processes without
having enough memory results in a high swapping
activity. We used the Zachmann test to measure the
CPU activity overhead of a virtualization solution
and the scalability of a SAP system.
It is important to avoid swapping activities
monitoring the relation between user time and
system time. Running the test with insufficient
memory will lead to a high system time as the
swapping activity is very time-consuming. A system
time less than 5% (own experiences) shows
sufficient memory. Too much swapping activity
falsifies the gained results and does not show the
correct performance.
2.3 Testing Configuration
2.3.1 Hardware and Software Configuration
The hardware test configuration consists of a Sun
Fire X4200 server from Sun Microsystems with two
2.4GHz AMD Dual core Opteron 280 CPU. It is
equipped with 16GB RAM (DDR2-667) and four
internal 73GB 10000 RPM SAS disks. Three disks
operated as a RAID-0 compound, containing the
databases of the SAP systems and one disk operated
as the root disk, containing the operating system and
the application servers of the SAP systems.
The operating system does not distinguish
between CPUs and cores. A dual core CPU is
counted as two CPUs in the operating system. For
simplicity we use the term CPU in the rest of the
paper.
As operating system Sun Solaris Express
Developer Edition 1/08 is used. In this version the
XEN hypervisor of Sun Microsystems is integrated.
The installed hypervisor has the version 3.0.4-1. The
Express Edition comes with two kernels: one
includes the hypervisor, the other one does not. This
makes it easy to switch between a virtualized and
non-virtualized operation.
We use SLCS version 2.3 operates on basis of a
7.0 SAP kernel (patch number 126). The underlying
DBMS is MaxDB version 7.6.03.07. The database
instance is configured with 3224.06MB Data Cache.
2.3.2 Overcommitment Situations
In the test scenarios several virtual machines were
configured. For each virtual machine it is possible to
configure vCPU. These are virtual CPUs, which are
assigned to the virtual machine. This assignment can
be fix or variable.
A fix assignment means that a physical CPU is
dedicated as a vCPU to a VM. As a result, the VM
can only use this physical CPU as a resource and no
other VM has access to the CPU. This is a typical
1:1 relationship between physical and virtual CPU.
A variable assignment is made upon a group of
physical CPUs, so that several physical CPUs are
assigned but not dedicated explicitly to several VMs.
As a result all VMs have access to all assigned
physical CPU and the physical resource must be
shared fairly. This is a n:m relationship between
physical CPU and vCPU. In the situations of
variable assignments the upper bound for the
number of assigned vCPU is the number of physical
CPU. You may assign up to 4 vCPU to a VM in a 4
CPU machine.
When assigning several vCPU as a variable
assignment it may come to a situation with more
vCPUs assigned to the VMs than physical CPUs are
existing. As an example: on a machine with 4
physical CPU you want to run 4 virtual machines.
You configure each of them with 4 vCPU. Summing
up the numbers of vCPU you will get 16 vCPUs
whereas the underlying machine only runs 4
physical CPUs. We call this situation an
“overcommitment” situation (or oversubscription
situation) as there are more physical resources
assigned to the virtual machines than actually exist.
The term overcommitment or oversubscription
situation is not established in any research work. It
was mentioned in (Apparao, 2008) for the first time.
When facing an overcommitment situation you
will have to quantify the overcommitment.
Therefore, we use the theoretical computing power
and set N
P
(as the number of physical CPU) as
100%.
Overcommitment O is calculated by using the
sum of all assigned vCPU N
V
from all VMs V and
PERFORMANCE OVERHEAD OF PARAVIRTUALIZATION ON AN EXEMPLARY ERP SYSTEM
349
dividing the result by the number of physical CPU
N
P
. This leads us to an overcommitment of 400%
when configuring 4 vCPUs (N
V
) in 4 VMs (V) on a
4 CPU machine (N
P
).
1
*100
V
V
V
P
N
O
N
(2)
Such overcommitment situations are not well
known so far although it seems to be a standard
scenario when using virtualization. But we are not
aware of any research paper focusing on these
situations. Questions for the fairly resource sharing
during these situations arise. We will focus on these
questions in our third test scenario.
2.3.3 Test Scenarios
We install three parallel SLCS instances and run
several Zachmann tests in three different scenarios
to gain several results. For each scenario, we ran one
test as a kind of “attack time”. After the run the
buffers of the ERP systems are filled with all
necessary data. We repeated the test runs three
times.
In the first test run, we installed three VMs on
the host. Each VM contained an instance of Sun
Solaris Developer Edition. Inside the VM we booted
the native Sun Solaris’s kernel. Then we installed
one instance of SLCS in each VM and run several
Zachmanntests in parallel. The gained performance
in this setting is referred as virtualized performance.
In the second test, run we booted the native Sun
Solaris’s kernel on the host directly and installed
three parallel SLCS instances in the native
environment. All virtual machines were deactivated.
We ran several Zachmanntests in this environment,
too. This is referred as our native performance. We
expected to see a little difference between
virtualized and native performance.
In the third test run, we booted the kernel with
integrated Xen again. We configured up to 4 vCPUs
per VM and ran several Zachmann tests. We varied
the number of vCPU per VM and tested several
different configurations to gain an overview about
the overcommitment situations.
3 RESULTS
3.1 Native Performance Compared to
Virtual Performance
We ran several different performance tests to esti-
mate the performance overhead of virtualization. We
used two different scenarios: in a first scenario we
compared only one SLCS instance, first running in a
native and later in a virtual environment. In a second
scenario we compared 3 parallel running SLCS
instances in a virtual environment and a native
environment.
3.1.1 One SLCS Instance
To estimate the performance overhead caused by
paravirtualization we used several test run results
from scenario 1 and scenario 2 (as described in
section 2.3.4.). We installed one SLCS instance in
each scenario (each configured with no limits to
RAM and CPU) and compared the results in Table
1. It shows the overall throughput of one native
SLCS instance compared to one virtual SLCS
instance, scaling the number of work processes from
1 to 12. Starting with a performance loss of 21%
when running 1 work process the tests show face a
performance loss of 38% when running 12 work
processes.
CPU Load
0
10000
20000
30000
40000
50000
60000
70000
80000
90000
136912
Number Work Processes
Overall Throughput per sec
1 native SLCS
1 virtual SLCS
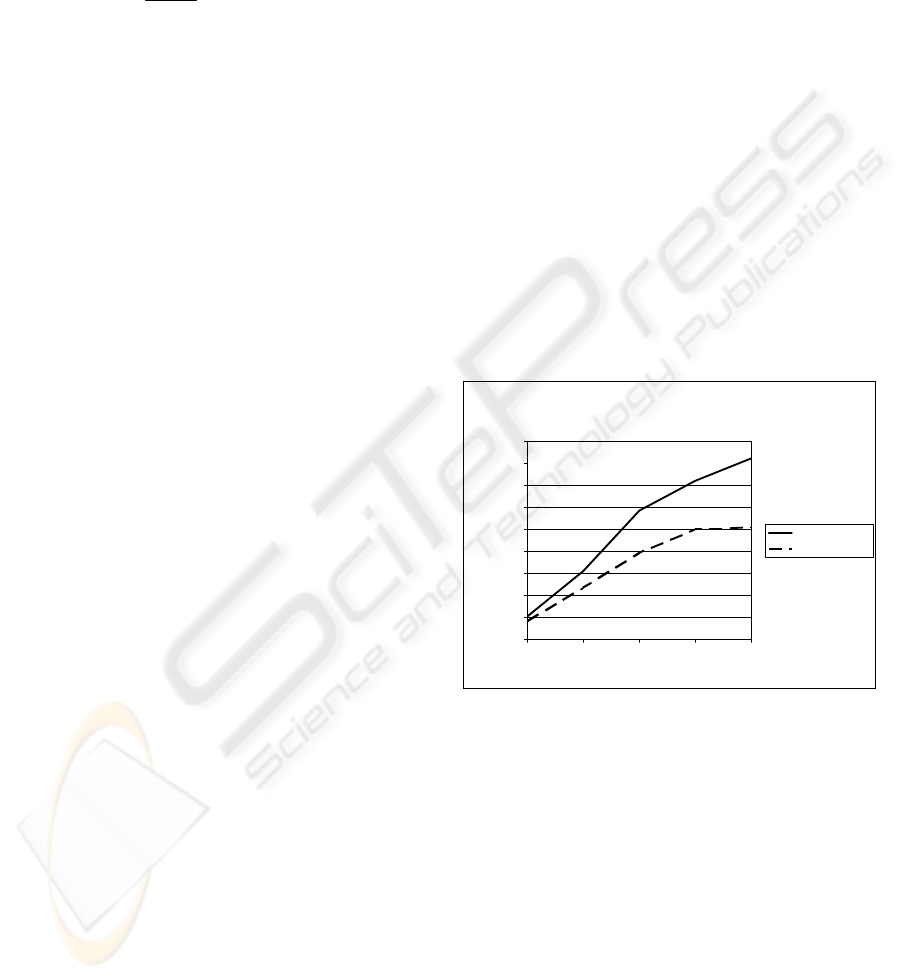
Figure 1: Overall throughput of 1 native SLCS and 1
virtual SLCS.
The visualization of the results can found in
Figure 1. Both lines show the overall throughput of
the SLCS instances. The gradients of both curves are
surprising. It seems that the native environment is
able to use the computing power more efficiently
than the virtual environment. While changing from 3
to 6 work processes the SLCS instance in the native
environment is able to change the overall throughput
by factor 1.89 whereas the virtual SLCS only gains
by factor 1.67. It seems that the virtualization
overhead prevents the virtual SLCS instance from
gaining a better performance gradient. After
increasing the number of work processes to 9 the
virtual SLCS did not show any performance
ICEIS 2010 - 12th International Conference on Enterprise Information Systems
350

improvement – we think this is because of a high
swapping activity which was monitored during the
test run.
What about the individual performance of a work
process in a native and a virtual environment? Is the
decreased overall throughput a result of a decreased
individual throughput of the work processes? Table
1 shows the individual throughput per work process
in the virtual and the native environment. It can be
seen that the individual throughput per work process
is decreased in the same way as the overall
throughput. We assume that the scalability of the
hypervisor is very good and that it treats every work
process equally and with the same amount of
computing resources.
Table 1: Individual throughput per work process (1 SLCS
instance).
Work
processes
Native
Performance
Virtual
Performance
Loss
native/virtual
1
10442.84 8199.26 21.48%
3
10313.55 7811.96 24.25%
6
9747.7 6517.44 33.13%
9
7995.15 5541.42 36.17%
12
6842.32 4216.01 38.39%
3.1.2 Three SLCS Instances
Given the results when running one SLCS instance,
we expected to see a higher overall loss when
running three parallel SLCS instances. Three parallel
VMs with the no limits of RAM were installed. Each
VM contained one SLCS instance and for each VM
4 vCPU were configured to gain the maximum
performance for every VM. To compare the results
from three native SLCS instances against three
virtual SLCS instances, the average result from the
native SLCS instances were used and compared to
the average virtual SLCS instance. Unfortunately,
the number of work processes had to be limited to 6
per SLCS instances as the machine ran into a
memory problem. As mentioned in section 2.2.3
configuring too much memory should be avoided.
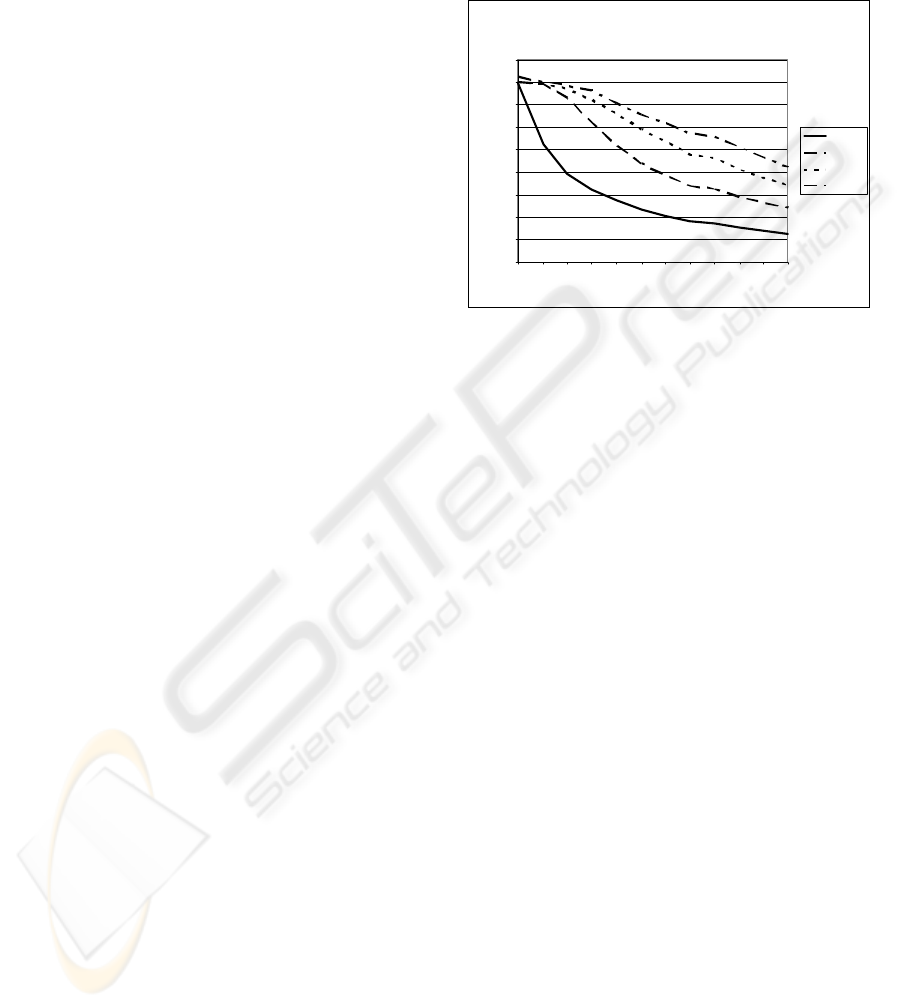
The test results are shown in Figure 2.
It is not surprising, that the overall throughput
differs. However, the loss between the virtual SLCS
instances and the native SLCS instances is bigger.
CPU Load
0
10000
20000
30000
40000
50000
60000
70000
80000
90000
123456
Number Work Processes
Overall Throughput per sec
3 native SLCS
3 virtual SLCS
Figure 2: Overall throughput of 3 native and 3 virtual
SLCS instances.
The most interesting part of the test run is a
saturation at the level of ~47,000 throughputs/sec for
the virtual SLCS instances. It does not matter if we
increase the number of work processes, the overall
throughput remains the same. We see a higher
gradient for the results of the native SLCS instances
compared to the virtual SLCS instances. The overall
throughput data is shown in Table 2:
Table 2: Overall throughput (3 SLCS instances).
Work
Processes
Native
Performance
Virtual
Performance
Loss
native/virtual
1 30973.47 23790.89 23.19%
2 58252.27 42072.89 27.77%
3 71343.41 47924.14 32.83%
4 81590.34 47244.79 42.10%
5 83850.9 47290.7 43.60%
6 85438.08 47731.08 44.13%
It is interesting to see that jumping from 3 to 4
configured work processes per virtual SLCS
instance results in an overall throughput decrease.
To identify the cause of the jump, the individual
work process throughput was analyzed again and it
was found that the individual throughput decreases
in the same way as the overall throughput.
3.1.3 Analysis and Implications
After the performance loss was discovered, the work
focused on the reason why the performance was
decreased. The performance loss is caused by a high
swapping activity of the server. As the test hardware
PERFORMANCE OVERHEAD OF PARAVIRTUALIZATION ON AN EXEMPLARY ERP SYSTEM
351
is equipped with 16 GB RAM and every work
process consumed approximately 1 GB RAM the
machine faced a total RAM consumption of 20 GB
RAM (3 virtual machines * 6 work processes * 1
GB RAM per work process + 2 GB RAM for Xen).
The high swapping activity explains the
performance degradation when using a high work
process number in the end of our scenario. But at the
beginning of our tests (with a smaller number of
work processes) there was no swapping activity at
all and therefore we assume that the hypervisor
causes the performance loss. The hypervisor is not
able to handle a lot of memory activity very well.
This assumption can be sustained by the current
development of new virtualization features for
CPU’s, like nested paging. We discovered a big
difference between virtual and native SLCS
instances. The performance of the virtual SLCS
instances decreased dramatically up to 44%. For the
individual ERP user in the real world there is one
assumption: virtualization may cost significant
performance. This should be kept in mind before
starting virtualization projects where complex
software systems e.g. ERP systems are to be
migrated to virtualized environments. In high load
situations this can lead to a massive performance
bottleneck.
3.2 Overcommitment Situations
In this scenario the focus lies on overcommitment
situations. Here the capability of the hypervisor to
fairly share computing power to all VMs is of
interest. The idea is to gain knowledge about these
situations and get a first impression on high overload
situations.
3.2.1 Single Load Situation
To investigate the overcommitment question, we ran
several tests. In these tests, the number of work
processes and the number of vCPU were varied. The
first test run was done to see how the hypervisor
scales the increasing load inside of one virtual
machine with a rising amount of computing power.
We configured one VM and increased the number of
work processes and the number of configured
vCPUs (see Figure 3).
The lines in the diagram describe the average
throughput for one SLCS instance with the changed
number of assigned vCPUs. The first line shows the
non-linear decreasing throughput when increasing
the number of work processes. As the number of
configured vCPUs is increased, a higher average
throughput can be seen. With 4 vCPU this is not an
overcommitment situation as the underlying
machine has 4 CPU. But this test shows the native
performance of one SLCS instances in a non-
overcommitment situation.
CPU Load
0
1000
2000
3000
4000
5000
6000
7000
8000
9000
12
3
4
5 6
7
8
9
10 1 1 12
Number Work Proc esses
Individual Throughput per sec
1 Core
2 Core
3 Core
4 Core
Figure 3: Individual Throughput one virtual SLCS
instance.
3.2.2 Multiple Load Situation
To establish a multiple load situation three parallel
virtual machines with three working SLCS instances
were ran. We changed the number of vCPUs in the
virtual machines from 1 vCPU to 4 vCPU. Once
again, the number of work processes per SLCS
instance had to be limited to 6 because of memory
limits. We focus on the hypervisors ability to share
the available physical CPUs equally when more than
one virtual machine try to get access to a physical
CPU.
Figure 4 shows the average throughput of three
VMs with a varying number of vCPUs. To estimate
the throughput of all VMs as one value, we use the
average of all three throughput values. The fist line
describes the average throughput of 3 VMs with 1
vCPU per VM. This is currently not an
overcommitment situation as the overcommitment
factor is at 75%. This first test run showed an
increasing average throughput for three VMs. It
seems the saturation lies at ~40,900 throughputs per
second.
After the first test the number of vCPU were
increased step-by-step. The highest average
throughput is gained when only configuring two
vCPUs per VM. The dotted line shows the average
throughput of the 3 VMs, each configured with 2
vCPUs. The overcommitment factor lies at 150%
and the overall throughput with 6 configured work
processes is ~52,500 throughputs per second. This
configuration leads to the highest average
ICEIS 2010 - 12th International Conference on Enterprise Information Systems
352
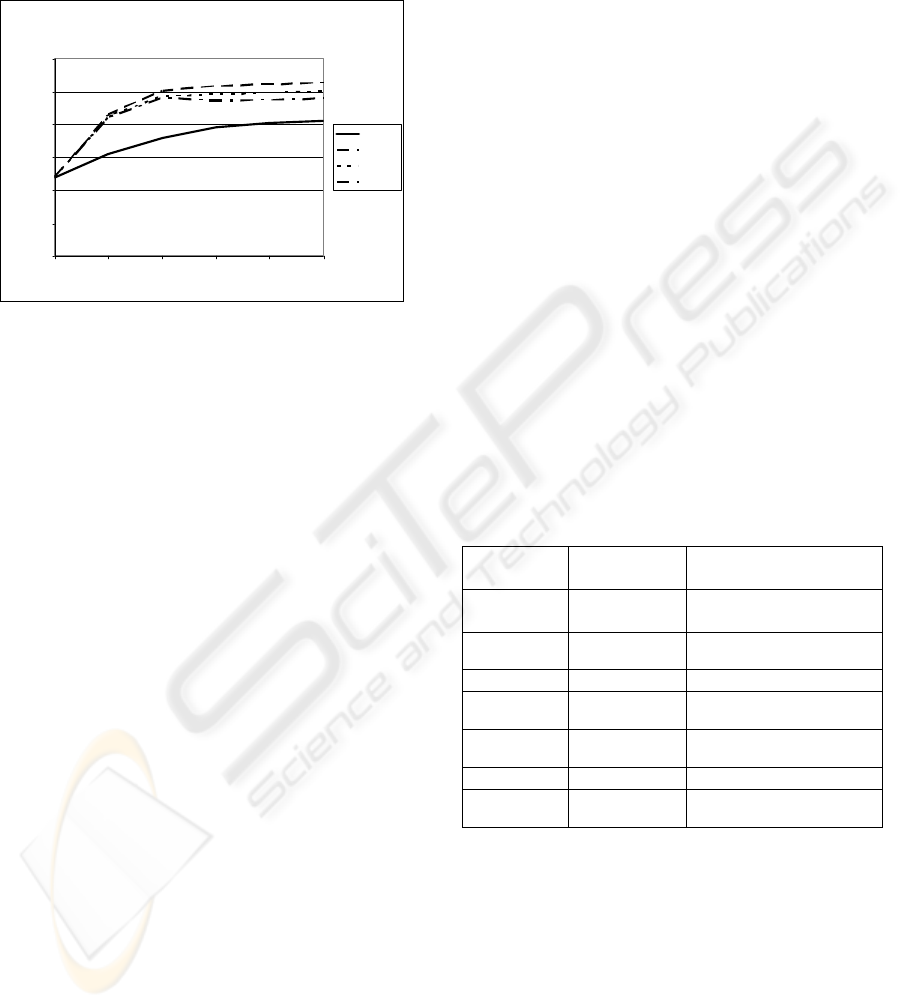
throughput for 3 VMs. The diagram also shows the
average throughput of 3 VMs, each configured with
4 vCPUs. The overcommitment factor lies at 300%
and the overall throughput with 6 configured work
processes is ~47,700 throughputs per second.
CPU Load for 3 VM
0
10000
20000
30000
40000
50000
60000
12 34 56
Number Work Processes
Overall Throughput per sec
1 Core
2 Core
3 Core
4 Core
Figure 4: 3 VM with increased vCPUs per VM.
3.2.3 Analysis and Implications
The hypervisor is able to fairly share the physical
CPU resource when only a limited number of
vCPUs are assigned to VMs. Configuring an
extreme overcommitment situation can lead to
massive performance losses (as shown with
4vCPU/VM). As the hypervisor is just an integrated
part of a Sun Solaris operating system, the internal
so called Fair Share Scheduler (FSS) of Solaris is
responsible for sharing CPU and memory resources.
As it is possible to configure the FSS we will focus
on this feature in future research.
Our assumption is that the hypervisor is not able
to handle “overcommitment” situations very well.
The more vCPUs we configured in the virtual
machines, the less overall throughput was achieved.
Especially when configuring an extreme situation, it
seems that the hypervisor has to handle a lot of
tasks/requests from the virtual machines and,
therefore, the overall throughput decreases.
Overcommitment is part of the reason why
virtualization is of interest and we showed that
extreme overcommitment can lead to massive
performance losses.
As overcommitment is one the most important
reasons for introducing virtualization the
virtualization should be aware of the extreme
overcommitment situations which may lead to
extreme performance degradations. Installing too
many virtual machines without configuring them
quite properly can lead to massive performance
losses. It is important to dedicate the computing
power to the virtual machines, which are under
heavy user load and need that computing power.
4 CONCLUSIONS AND
FURTHER RESEARCH
The performance overhead when using a
paravirtualization solution was investigated in a
testing environment. The test results showed a
performance loss between 23% and 44%. Beside we
showed that high swapping activity can become a
very big performance degradation factor. Compared
to other published performance tests e.g. Barham our
gained loss is higher (see table 4). Barham
determined up to 16.3% performance loss when
utilizing a SPEC WEB99 benchmark. Performance
tests from Cherkasova or Mennon using the httperf
benchmark showed a bigger loss of up to 50% and
33%.
A comparison of our results to the results of web
server benchmarks is not adequate because of the
differing subjects and methods. To our knowledge
there are no published research results regarding the
performance of an ERP system that may be used for
a comparison. since this is the case, we provide
Table 3 as a comparison of available results.
Table 3: Comparison of performance loss.
Source Loss Testing method
Zhang 2008 Up to 15% Kernel Build
Barham
2003
Up to 16.3% SPEC WEB99
Huang 2006 Up to 17% NAS Parallel Benchmarks
Youseff
2006
Up to 30% MPI microbenchmark
Mennon
2005
Up to 33% Httperf
This paper Up to 44% SLCS
Cherkasova
2005
Up to 50% Httperf
A performance loss of 44% in the ERP system
environment when stressing CPU and memory
requires effort to better understand the reasons and
improve the situation. We are aware of several
initiatives to improve hardware architectures, I/O
techniques and software architectures for a better
support of virtualization. Therefore we need to
investigate and evaluate new techniques for a better
understanding of virtualization and the performance
impact.
Beside CPU and memory there is also I/O
virtualization. Our research focuses on the
PERFORMANCE OVERHEAD OF PARAVIRTUALIZATION ON AN EXEMPLARY ERP SYSTEM
353

performance impact when using different method of
I/O binding. We want to focus on the underlying
storage of VMs (different file systems and different
types of storage) and different I/O binding types of
storage inside the VMs.
REFERENCES
Apparao, P., Iyer, R., Zhang, X., Newell, D., Adelmeyer,
T., Characterization & Analysis of a Server
Consolidation Benchmark. In: Proceedings of the
fourth ACM SIGPLAN/SIGOPS international
conference on Virtual execution environments, Pages
21-29 (2008)
Barham, P., Dragovic, B., Fraser, K., Hand, S., Harris, T.,
Ho, A., Neugebauer, R., Pratt, I., Warfield, A., Xen
and the Art of Virtualization. In: SOSP ’03 -
Proceeding of the nineteenth ACM symposium on
Operating systems principles, Pages 164-177, (2003)
Cherkasova, L., Gardner, R., Measuring CPU Overhead
for I/O Processing in the Xen Virtual Machine
Monitor. In: Proceeding of the annual conference on
USENIX Annual Technical Conference, Pages: 387-
390 (2005)
Huang, W., Jiuxing, L., Abali, B., Dhabaleswar, K. P., A
Case for High Performance Computing with Virtual
Machines. In: ICS ’06: Proceedings of the 20th annual
international conference on Supercomputting, Pages
125-134 (2006)
Jehle, H., Wittges, H., Bögelsack, A., Krcmar, H.:
Virtualisierungsarchitekturen für den Betrieb von Very
Large Business Applications. In: Proceedings of
Multikonferenz Wirtschaftsinformatik, Pages 1901-
1912 (2008)
Matthews, J. N., Hu, W., Hapuarachi, M., Deshane, T.,
Dimatos, D., Hamilton, G., McCabe, M., Quantifying
the performance isolation properties of virtualization
systems. In: ExpCS’07: Experimental computer
science on Experimental computer science (2007)
Kühnemund, H., Documentation for SLCS v2.3. SAP AG
Walldorf (2007)
Mennon, A., Santos, J. R., turner, Y., Janakiraman, G. J.,
Zwaenepoel, W, Diagnosing performance overheads
in the xen virtual machine environment. In:
Proceedings of the 1st ACM/USENIX international
conference on Virtual execution environments, Pages
13-23 (2005)
Ongaro, D., Cox, A. L., Rixner, S., Scheduling I/O in
virtual machine monitors. In: Proceedings of the
fourth ACM SIGPLAN/SIGOPS international
conference on Virtual execution environments, Pages
1-10 (2008)
SPEC – Standard Performance Evaluation Corporation.
http://spec.org/, accessed on 08/29/08
Whitaker, A., Shaw, M., Gribble, S. D., Scale and
performance in the Denali isolation kernel. In:
Proceedings of the 5th symposium on Operating
system design and implementation, Pages 195-209
(2002)
Youseff L., Wolski R., Gorda B., Krintz C., Evaluating the
Performance Impact of Xen on MPI and Process
Execution For HPC Systems. In: Proceedings of
Second International Workshop on Virtualization
Technology in Distributed Computing (2006)
Zhang, X., Dong, Y., Optimizing Xen VMM Based on
Intel® Virtualization Technology. In: Proceedings of
the 2008 International Conference on Internet
Computing in Science and Engineering, Pages 267-
274 (2008)
ICEIS 2010 - 12th International Conference on Enterprise Information Systems
354
