
ON THE IMPORTANCE OF VISUALIZING IN PROGRAMMING
EDUCATION
Peter Bellström and Claes Thorén
Department of Information Systems, Karlstad University, Universitetsgatan 2, Karlstad, Sweden
Keywords: Visualization, Programming, e-Learning, Bubble Sort Algorithm.
Abstract: In this paper we address the importance of visualizing in programming education. In doing so, we describe
three contributions to the research field. First we describe an initial study on visualizing the Bubble Sort
algorithm. The Bubble Sort algorithm has been chosen since it contains several parts that in the past have
been troublesome for several students taking introductory programming courses. Secondly, we describe a
design for how visualization can be inserted into programming education. In that design we again use the
Bubble Sort algorithm as an illustrating example. Thirdly, we present a classification of four visual
programming environments: Alice, BlueJ, Greenfoot and Scratch. In the classification we have positioned
each visual programming environment in a matrix comprised of the granularity dimension and the
visualization dimension. All three presented contributions to the research field of visualization should
contribute to an understanding of abstract programming concepts starting with problem or application
instead of syntax. Students lacking scientific mathematics and students taking an introductory programming
course based on e-Learning should benefit the most of the presented contributions.
1 INTRODUCTION
As has been previously shown, learning how to
program is indeed experienced as difficult by many
students, and the failure rate is high (Bennedsen and
Caspersen, 2007; Robins et al., 2003).
In Bellström and Thorén (2009) we showed that
there are four critical types of knowledge required
for programming: basic numerical knowledge,
knowledge about the programming environment,
knowledge about the programming language and
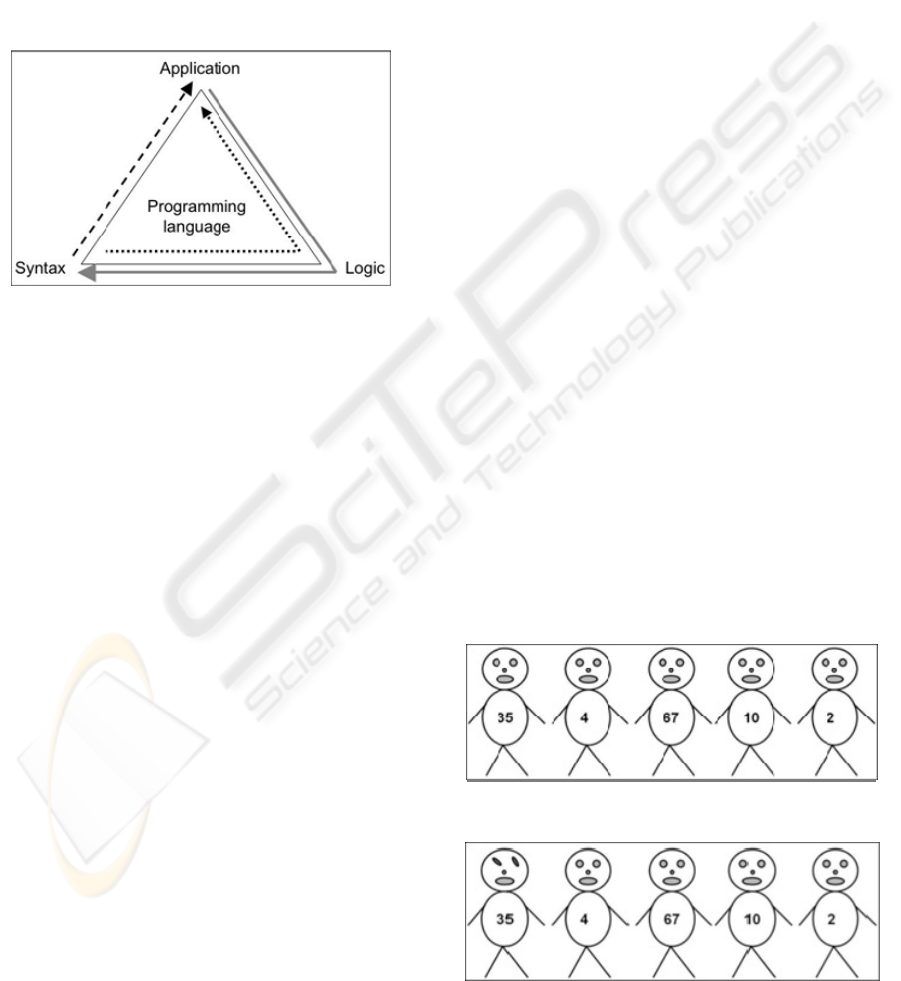
finally overall knowledge-transfer into logic. The
last type refers to the sequence of learning where
traditionally programming is taught starting with
syntax moving through logic ending with
application. We proposed an inversion to that
method, where the sequence starts with application,
moving on to logic and ending with syntax (se
Figure 1.). Logic therefore refers to the area where
several commands are combined to achieve a
specific effect, such as the sorting of an array. This
knowledge represents the logic of programming as a
fourth type of knowledge, linking application
(effect) with syntax.
Beginner’s computer programming is a course that
constitutes an important part of any IT-related
university program. For the majority of students this
particular course either comes across as an
unsurpassable mountain or as the moderately
difficult challenge it should be. Whereas some
students manage the course with relative ease, a
sizeable portion struggle and fail. A major reason for
this struggle is that different IT students come from
different academic backgrounds. Computer science
students, for instance, tend to have scientific math
backgrounds and are well prepared for problem
solving and abstract thinking. Information Systems
students on the other hand, reside closer to the social
science side of the spectrum with only basic
mathematical skills, and may therefore be less
proficient in problem solving and abstract thinking.
These two groups require two diametrically opposed
strategies of teaching, particularly when teaching
how to program.
Oftentimes, however, teaching is conducted the
same way with both groups, favouring those of a
mathematical background. We should also consider
the benefits for distance education students, a group
which does not have the luxury of frequent personal
contact with a teacher. In other words, the teaching
131
Bellström P. and Thorén C. (2010).
ON THE IMPORTANCE OF VISUALIZING IN PROGRAMMING EDUCATION.
In Proceedings of the 12th International Conference on Enterprise Information Systems - Human-Computer Interaction, pages 131-136
DOI: 10.5220/0002871601310136
Copyright
c
SciTePress
situation is much more diverse and challenging than
what the common teaching strategies suggest.
This paper is structured as follows: in section
two we address some other initiatives on
visualization and in section three the initial study on
visualizing the Bubble Sort algorithm. Section four
includes a design for insertion of visualization into
programming education and section five a study on
visual programming environments developed to
facilitate the process of learning programming.
Finally, in section six we present a summary along
with our conclusions.
Figure 1: The Sequence of Learning Programming.
2 PREVIOUS RESEARCH ON
VISUALIZATION
Several approaches to visualization have been
presented in the past. One such approach is visual
programming environments such as Alice (Cooper,
et al., 2003a; 2003b), BlueJ (Kölling, 2008; Kölling
et al., 2003), Greenfoot (Henriksen & Kölling, 2003;
Kölling & Henriksen, 2005) and Scratch (Maloney
et al., 2004; Resnick et al., 2009).
Alice is a 3D animation environment that
visualizes objects and their behaviours. The
programmer can use simple “drag-and-drop” to
make programs and therefore does not have to
struggle with syntax (Cooper et al., 2003b).
BlueJ is both an object-first approach and an
integrated development environment (Kölling,
2008). To visualize the program code BlueJ uses a
stripped-down UML class diagram. When the
developer has created a class it is also possible to
instantiate an object and to inspect its contents and
values.
Greenfoot is also an object-first approach and an
integrated development environment (Kölling &
Henriksen, 2005). The difference is that Greenfoot
uses a world metaphor focusing on games and
simulation.
Scratch is a programming environment that uses a
building-block metaphor (Maloney et al., 2004). The
programmer can simply “drag-and-drop” his or her
own programs. The building-block metaphor also
helps the programmers because the building blocks
visualize which blocks that fit together and which
ones that do not.
Other ways of visualizing, aside from the visual
development environments, are for instance games
construction (Bayliss and Strout, 2006; Chamillard,
2006; Tsai et al., 2006; Sung, 2009) as well as
playing games (Eagle and Barnes, 2008). A mixture
of constructing and playing games is the use of The
Turtle Machine a virtual drawing machine that gives
students immediate visual feedback (Caspersen and
Christensen, 2008).
Finally, for several of the described visual
programming environments course literature have
also been written. Examples are for instance
Learning to Program with Alice by Cooper et al.
(2009), Objects First with Java A Practical
Introduction using BlueJ By Barnes and Kölling
(2008) and Introduction to Programming with
Greenfoot Object-Oriented Programming in Java
with Games and Simulations By Kölling (2009).
3 AN INITIAL STUDY ON
VISUALIZATION
The pilot study presented in Bellström and Thorén
(2009) showed an increased understanding of
abstract programming concepts. Showing a
visualization of the Bubble Sort algorithm using
animated stick figures helped this understanding.
Fig. 2 – Fig. 7 show an improved version of the
visualized Bubble Sort algorithm focusing on how
“35” and “4” switch place.
Figure 2: The Visualized Bubble Sort Algorithm 1(6).
Figure 3: The Visualized Bubble Sort Algorithm 2(6).
ICEIS 2010 - 12th International Conference on Enterprise Information Systems
132
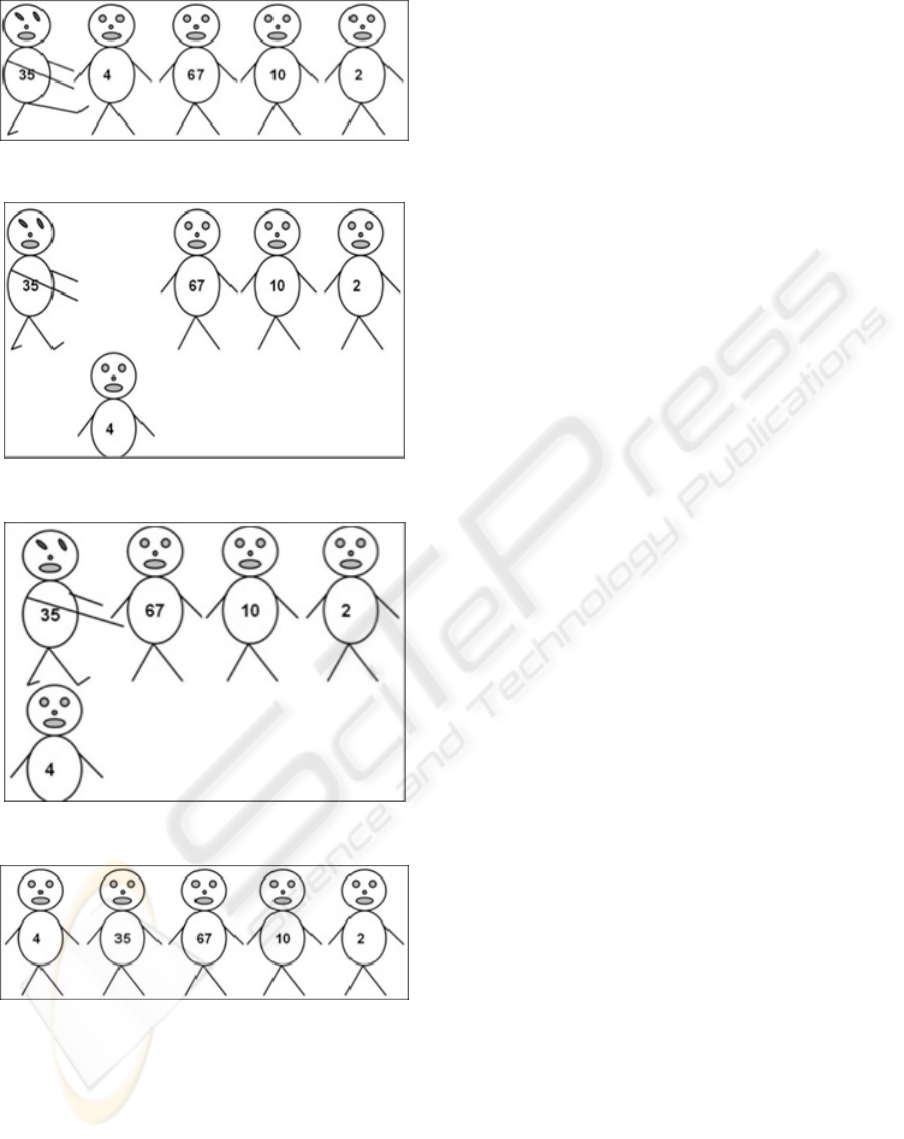
Figure 4: The Visualized Bubble Sort Algorithm 3(6).
Figure 5: The Visualized Bubble Sort Algorithm 4(6).
Figure 6: The Visualized Bubble Sort Algorithm 5(6).
Figure 7: The Visualized Bubble Sort Algorithm 6(6).
The animation was shown to five students taking an
intermediate programming course. Prior to showing
the visualization, the source code had been shown
and discussed briefly. After the students had
observed the animation, two open-ended questions
were asked: 1. Did the stick-figures with numbers
add to your understanding of programming? What?
How? Motivate! 2. Could you yourself explain
bubble sorting to someone with help from these
examples (source code and/or visualizations with
stick-figures)? Which one of the two, or both?
Motivate!
The results showed an increased understanding
of abstract programming concepts, and furthermore
showed that there is potential in reversing the
sequence of learning starting with application and
finishing with syntax.
4 A DESIGN FOR INSERTION OF
VISUALIZATION INTO
PROGRAMMING EDUCATION
Traditionally, programming is taught beginning with
simple syntax operations such as variable
declaration and corresponding value assignment.
These modest beginnings operate with a high
granularity, which means that the students are taught
very simple and small components that they can
later learn to combine into larger aggregates such as
functions. The visualization degree is very low in the
beginning, and understanding is mostly
mathematical in nature (comp. white box). In our
design we instead start with a problem and proceed
to visualize.
As an example on how to insert visualization into
programming education we have chosen the Bubble
Sort algorithm because it includes several parts that
students experience as difficult. For instance, Dale
(2006) mentions that first-year Computer Science
students perceive arrays as most difficult. In
addition, Eagle and Barnes (2008) conducted a
quantitative study on playing games that teaches
iteration and arrays. The results of that study showed
that students that had played the game were able to
better answer exam questions in the area of arrays
and loops compared to students that had not played
the game. The version of the Bubble Sort algorithm
illustrated in our animation is not optimized but
optimization it not our goal. Instead our
visualization of the Bubble Sort algorithm should
show how it works..
Finally, our animation of the Bubble Sort
algorithm can be interpreted and solved as either as
follows
for(){
for(){
if(){
}
}
}
ON THE IMPORTANCE OF VISUALIZING IN PROGRAMMING EDUCATION
133

Or as a solution with or without a flag:
while(){
for(){
if(){
}
}
}
In our design for how to insert a visual aspect into
programming education, we follow the sequence
shown in the knowledge triangle (see Fig. 1). Our
design starts with a short introduction to the
application or problem, in this case the Bubble Sort
algorithm that is addressed in the visualization (cf.
Application in Fig. 1). The visualization – the
solution to the problem – is then shown to the
students (cf. Logic in Figure 1). After having seen
the visualization, the students reflect upon what the
visualization actually showed. Making notes could
aid in the process of understanding how to actually
solve the application or problem and help contribute
to a deeper and more holistic understanding of the
application or problem and its solution. A
deep/holistic approach to learning has been
mentioned as particularly important when learning
programming still not all students have that
approach (Booth, 1992; Kilbrink, 2008; Segolsson,
2006). The visualization and writing is followed by a
technical reflection and by implementing a solution
to the problem. In the technical reflection students
should reflect on what instructions they need in
order to solve the problem and how the instructions
should be organized. A modelling language such as
UML could be helpful at this stage. However, it
should be noted that learning UML could be a
threshold on its own. Some type of pseudo code that
help in structuring the solution could also be useful.
Then, students implement their solution to the
application or problem (cf. Syntax in Figure 1).
Finally, students compare and reflect on their notes
and the actual implemented solution.
5 CLASSIFYING VISUAL
PROGRAMMING
ENVIRONMENTS
In this section we analyse four existing visual
programming environments according to our own
taxonomy (Fig. 8): Alice (Cooper et al., 2003),
BlueJ (Kölling, 2008), Greenfoot (Kölling &
Henriksen, 2005) and Scratch (Maloney et al., 2004)
along with our bubble sort animation. The purpose
of establishing a classification of programming aids
is to find a way to measure the design metaphor and
map that metaphor to a particular student category.
If we assume we have two types of student
categories: the mathematically inclined, and the
mathematically challenged, we can create a
taxonomy that shows whether the programming aid
actually aids or if it makes comprehension more
difficult.
Visualizing by attaching to a known metaphor to
facilitate learning is not new. The programming aids
all use various degrees of visual aids and GUI
functions to make programming more intuitive.
These applications all have their individual strengths
and weaknesses, as we will show. If visualization
and practical application is a good beginning, the
tools achieve that end with varied degrees of
success. To show this, we positioned the tools along
two dimensions: The “granularity” dimension
represents the size of the programming components
needed, from the smallest (individual command
syntax) to the largest (chunks of code that are visual
representations). Thus, tools that require detailed
programming syntax knowledge gravitate towards
high granularity, and aids that use metaphorical,
larger “building blocks” exhibit low granularity. The
second dimension represents the degree of
visualization. In this case visualization refers to a
metaphoric visual representation that attaches to
some element in a real (or imagined) world. Whether
it is parts of a jigsaw puzzle or Lego building blocks,
or controlling the movements of a figure skater does
not matter, the important thing is that it is relatable
to something with which the user is familiar. A tool
that scores high on visualization has a sophisticated,
almost narrative style that uses a real-world
example.
With mathematical problem solving capacities in
mind, a “logical” tool for an information systems
student would rate high on visualization and low on
granularity. No details in command syntax required,
only larger building blocks and a sensible, relatable
metaphor that is detached from programming jargon.
When we consider the positioning of the
programming aids in the diagram, we can regard
each diagrammatic point as a programming starting
point. As we want any programming task to end
with completion (full, practical application) we can
measure the amount of knowledge travelling needed
to complete that task. Using a programming tool
such as Scratch for instance, would require a fair
amount of knowledge travelling to reach detailed
syntax (the comprehension of which is a goal of any
introductory programming course) whereas using
ICEIS 2010 - 12th International Conference on Enterprise Information Systems
134
BlueJ is less travelling required. The more travelling
that is required along the diagram, the more it suits
the mathematically disinclined. Consider the
travelling as a reality based, metaphorical cushion
with the purpose to smooth the way to mathematical
comprehension at a detailed level. The difference is
that each student should travel various lengths. An
Information systems student needs more distance in
order to mathematically comprehend the rather
abstract programming commands. This
comprehension is best done last. A computer science
student needs less distance, because these students
have already travelled some distance in the past,
most likely through scientific mathematical studies.
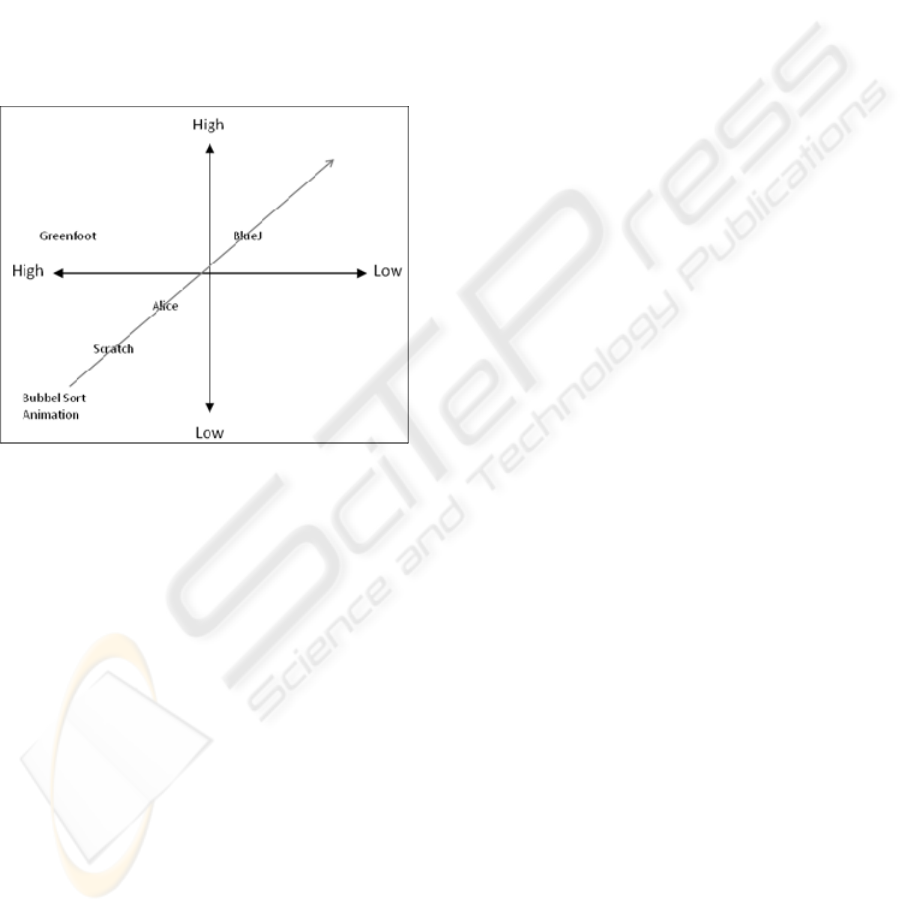
Figure 8: Classification of Visual Programming
Environments.
- Alice: Alice rates slightly below midrange on
granularity, and slightly above midrange on
visualization. In order to achieve the desired effect
on the figure skater featured in the introductory
example it was required to mix pre-programmed
function calls with visual drag and drop, to
understand the sequence of operations required.
- BlueJ: BlueJ rates slightly above midrange on the
granularity level, and slightly lower than midrange
on the visualization axis. We examined BlueJ based
on the provided shapes example.
- GreenFoot: GreenFoot rates quite high on
visualization and slightly above midrange on the
granularity level. We examined the default
“Breakout” game example. The metaphor is based
on the visual display of what the world looks like.
However, immediately under the surface there is
detailed programming required to achieve results.
- Scratch: Scratch rates low on the granularity level
and high on visualization, meaning small detailed
components that are understood in terms of
visualized representations rather than source code.
We examined Scratch by applying component pieces
to the provided cat picture to make it rotate in a
loop.
- The Bubble Sort Animation: Our animation rates
very high on visualization and very low on
granularity, meaning that it is a singular complete
visual representation of the entire functionality of an
algorithm and program.
6 SUMMARY
AND CONCLUSIONS
In several publications it has been argued and shown
that learning programming is experienced as
difficult for many students and that the failure rate is
high (Bennedsen and Caspersen, 2007; Robins, et
al., 2003). In this paper we have presented three
contributions the research field of visualizing in
programming education. We started by addressing
an initial study on visualizing the Bubble Sort
algorithm. This was followed by a design for
insertion of visualization into programming
education and ending with a classification of four
visual programming environments.
In all three contributions we focus on a
deep/holistic learning to programming. The purpose
of our contributions, and approaches, is to inspire
students to study towards a broader and deeper
understanding of the nature of a problem and its
solution. This is much more preferable to skimming
the surface of an algorithm without understanding it
at all.
The major contribution of this paper is presented
in the classification of visual programming
environments. The study shows that several of the
most common programming environments that are
specifically developed to facilitate learning
programming can be ranked in helpfulness
according to level of granularity and visualization.
Using the results of our study we can surmise that
those that rank low on visualization and high on
granularity will be less helpful than those ranking
high on visualization and low on granularity. The
important point to remember is that these
environments are developed with slightly different
students in mind. For instance, BlueJ is geared
towards model driven programming (Bennedsen and
Caspersen, 2008). In other words, these tools are by
no means silver bullets, and our results show that it
is very important to choose the right environment for
the right course. For information systems students
ON THE IMPORTANCE OF VISUALIZING IN PROGRAMMING EDUCATION
135

taking a distance education course in introductory
programming, Scratch should be used for maximum
effect.
REFERENCES
Barnes, D. J., Kölling, M., 2008. Objects First with Java A
Practical Introduction using BlueJ. Pearson
Education.
Bayliss, J. D, Strout, S., 2006. Games as a ‘Flavor’ of
CS1. In SIGCSE’06, pp. 500-504.
Bellström, P., Thorén, C., 2009. Learning How to Program
through Visualization: A Pilot Study on the Bubble
Sort Algorithm. In Proceedings of the 2
nd
International Conference on the Applications of
Digital Information and Web Technologies, IEEE, pp.
90-94, doi: 10.1109/ICADIWT.2009.5273943.
Bennedsen, J., Caspersen, M.E., 2007. Failure Rates in
Introductory Programming. inroads – The SIGCSE
Bulletin, Vol. 39, No. 2, pp. 32-36.
Bennedsen, J., Caspersen, M., 2008. Model-Driven
Programming. In Bennedsen, J., Caspersen, M.E.,
Kölling, M. (Eds.) Reflections on the Teaching of
Programming Methods and Implementations,
Springer-Verlag, Berlin, pp. 116-129.
Booth, S., 1992. Learning to program: a
phenomenographic perspective, PhD Thesis,
Göterborgs universitet, Acta.
Caspersen, M. E., Christensen, H.B., 2008. CS1: Getting
Started. In Bennedsen, J., Caspersen, M.E., Kölling,
M. (Eds.) Reflections on the Teaching of
Programming Methods and Implementations,
Springer-Verlag, Berlin, pp. 130-141.
Chamillard, A. T., 2006. Introductory Game Creation: No
Programming Required. In SIGCSE’06, pp. 515-519.
Cooper, S., Dann, W., Pausch, R., 2003a. Teaching
Objects-first In Introductory Computer Science. In
SIGCSE´03, pp. 191-195.
Cooper, S., Dann, W., Pausch, R., 2003b. Using Animated
3D Graphics to Prepare Novices for CS1, Computer
Science Education, Vol. 13, No. 1, pp. 3-30.
Cooper, S., Dann, W., Pausch, R., 2009. Learning to
Program with Alice. Pearson Education.
Dale, N. B., 2006. Most Difficult Topics in CS1: Results
of an Online Survey of Educators. inroads – The
SIGCSE Bulletin, Vol. 38, No. 2, pp. 49-53.
Eagle, M., Barnes, T., 2008. Wu’s Castle: Teaching
Arrays and Loops in a Game. In ITiCSE’08, pp. 245-
249.
Henriksen, P. & Kölling, M., 2004. Greenfoot: Combining
Object Visualization with Interaction. In OOPSLA’04,
pp. 73-82.
Kilbrink, N., 2008. Legorobotar i skolan Elevers
uppfattningar av lärandeobjekt och
problemlösningsstrategier, Licentiate thesis, Karlstad
University Studies.
Kölling, M., 2008. Using BlueJ to Introduce
Programming. In Bennedsen, J., Caspersen, M.E.,
Kölling, M. (Eds.) Reflections on the Teaching of
Programming Methods and Implementations,
Springer-Verlag, Berlin, pp. 98-115.
Kölling, M., 2009. Introduction to Programming with
Greenfoot Object-Oriented Programming in Java with
Games and Simulations. Pearson Education.
Kölling, M., Henriksen, P., 2005. Game Programming in
Introductory Courses with Direct State Manipulation.
In ITiCSE’05, pp. 59-63.
Kölling, M., Quig, B., Patterson, A. & Rosenberg, J.,2003.
The BlueJ System and its Pedagogy. Journal of
Computer Science Education, Vol. 13, No. 4, pp. 249-
268.
Maloney, J., Burd, L., Kafai, Y., Rusk, N., Silverman, B.,
Resnick, M., 2004. Scratch: A Sneak Preview. In
Second International Conference on Creating,
Connecting and Collaborating through Computing,
pp. 104-109.
Resnick, M., Maloney, J., Monroy-Hernandes, A., Rusk,
N., Eastmond, E., Brennan, K., Miller, A.,
Rosenbaum, E., Silver, J., Silverman, B. & Kafai, Y.,
2009. Scratch: Programming for All. Communications
of the ACM, Vol. 52, No. 11, pp. 60-67.
Robins, A., Rountree, J., Rountree, N., 2003. Learning and
Teaching Programming: A Review and Discussion.
Computer Science Education, Vol. 13, No. 2, pp. 137-
172.
Segolsson, M., 2006. Programmeringens intentionala
objekt Nio elevers uppfattningar av programmering.
Licentiate thesis, Karlstad University Studies.
Sung, K., 2009. Computer Games and Traditional CS
Courses. Communications of the ACM, Vol. 52, No.
12, pp. 74-78.
Tsai, M-H., Huang, C-H., Zeng, J-Y., 2006. Game
Programming Courses for Non Programmers. In
Proceedings of the 2006 international conference on
Game research and development, pp. 219-223.
ICEIS 2010 - 12th International Conference on Enterprise Information Systems
136
