
AUTOMATED 2D MEASURING OF INTERIORS USING A MOBILE
PLATFORM
Alexander Fietz, Sebastian M. Jackisch, Benjamin A. Visel
Robert Bosch GmbH, Corporate Research, 71701 Schwieberdingen, Germany
Dieter Fritsch
Institute for Photogrammetry, Universitaet Stuttgart, 70174 Stuttgart, Germany
Keywords:
Mobile robots, Surveying, Indoor environment, Exploration, Scan matching.
Abstract:
This paper presents an approach for a fully automated measuring of a self-contained indoor scene in 2D using a
mobile platform. A novel sensor is used, designed for the acquisition of precise floor plan scans, mounted on an
ordinary mobile robot. The software framework is configured to optimize the accuracy and the completeness
of the acquired data. Therefore an exploration strategy is presented that finds gaps in the data and determines
the next best view in an explorative way. The scene is presented to the system as continuous line segments.
Data management builds up the gathered point cloud in a homogeneous density, using the relevant and most
accurate available information. Existing scan matching techniques are modified in a way to work robust and
precise in the scenarios expected. The framework is tested in an exemplary indoor scene. Additionally, the
scene is surveyed with a referencing system to build ground truth data and to enable an accuracy evaluation of
the developed system.
1 INTRODUCTION
Architects, craftsmen but also further occupational
groups engage in the constructional modification of
interiors. Often the basis of their work is a de-
tailed and accurate floor plan. The acquisition of the
necessary geometrical information plus the following
modeling still is a time-consuming procedure. Typ-
ically, the measuring instruments used therefore are
tachymeters or just measuring tapes. Thus an auto-
mated floor plan creation is a topic that is worth in-
vestigating.
The intention of building a floor plan at the push
of a button requires the utilization of a mobile robotic
platform. This issue implicates a number of funda-
mental tasks that have to be overcome. The existence
of a hardware framework to allow processing like the
activation of sensors or the wheels is just a basic re-
quirement. For an autonomous operation the system
has to be able to locate itself in an unknown environ-
ment based on the available sensor data. Simultane-
ously one or even several maps have to be built up out
of the collected data. The generation of a floor plan
further used by the operator, but also a representation
of the environment the robot can deal with. Normally
these are associated with each other. The system has
to know which parts of the environment still have to
be surveyed and how it manages to do that. There-
fore exploration strategies have to be applied that pro-
pose new measurement positions and determine paths
to ensure a collision-free navigation.
The paper is organized as follows. Section 2 ad-
dresses the related and previous work, section 3 in-
troduces the hardware framework of the used system.
In sections 4&5 the scan matching technique and the
exploration strategy are presented. Experiments and
results are given in section 6, followed by section 7
that concludes the paper and refers to future work.
2 RELATED WORK
There has been a lot of research work in building two
dimensional maps using robotic platforms. Thereby
a broad variation of the presented approaches can be
found, according to the already mentioned number
of tasks a robotic system must accomplish. The ad-
equate representation of the environment is one of
115
Fietz A., M. Jackisch S., A. Visel B. and Fritsch D. (2010).
AUTOMATED 2D MEASURING OF INTERIORS USING A MOBILE PLATFORM.
In Proceedings of the 7th International Conference on Informatics in Control, Automation and Robotics, pages 115-120
DOI: 10.5220/0002877201150120
Copyright
c
SciTePress
the interesting subtopics. Depending on the systems
major task an occupancy grid (Elfes, 1987), feature-
based (Kuipers et al., 1993) or topological (Choset
& Burdick, 1996) maps can be the most appropriate
choice. Occupancy grids have the nature of an easy
handling, but need a lot of memory capacity. Thus
their usage comes along with an increased computing
time, especially in spacious applications. In compari-
son to that, feature-based and topological maps allow
a rapid treatment, but depict just an abstraction of the
scene.
Exploration strategies are based on these repre-
sentation types. An early approach was given by
Yamauchi in [1997]. He used a frontier-based ap-
proach that is based on an occupancy grid and accom-
plishes the exploration by classifying single grid cells.
Gonz
´
alez-Ba
˜
nos & Latombe presented in [2002] a
similar approach, that also observes the frontiers to
the unknown areas, but directly evaluates the mea-
sured data points. Consecutive data points are con-
nected to line segments and the obscurations inbe-
tween are filled by modeling with geometrical primi-
tives. The resulting line-like frontier models are built
for every new scan and update the global model with
a mergence. An alternative approach is given by
Schmidt et al. in [2006]. The assumption, that the en-
vironment consists of simple rectangular geometries
enables an abstraction of the collected data to geomet-
rical primitives. Exploration is pushed by checking
their topology and a sufficient observation of them.
These strategies do not suit to the aspired application
because they either primarily don’t target the com-
pleteness of data or can’t handle more complex indoor
geometries. So an alternative method had to be found,
that is presented in chapter 4.
Exploration applications require a simultaneous
map building. Thereby, the well-known SLAM-
problem, the bilateral dependancy of data registra-
tion and auto-localization, has to be considered to
deal with the geometrically imprecise maps as well as
noisy and ambigious sensor information. Various ver-
sions, how scan data can be matched to a map, were
presented in the past years (Besl & McKay, 1992),
(Lu und Milios, 1994), (Yaqub et al., 2006). State of
the art in global mapping is the usage of probalistic
methods. For robot motion and data acquisition un-
certainty models are generated at which Kalman or
particle filters are applied. In (Thrun, 2002) a general
review is given.
3 HARDWARE FRAMEWORK
The applied laser scanner is a prototype, designed for
precise indoor measuring tasks. Within a measure-
ment operation a point cloud of 3600 points can be
recorded that yields a 360
◦
view of the environment.
The combination of multiple phase measurements al-
lows distance measurements with a standard deviation
of a few millimeters in a range of 7.5 meters. An in-
tegrated leveling unit adjusts the floor uneveness to
make horizontal measurements possible. Signal anal-
ysis allows a prior filtering of erroneous data.
The sensor is mounted on a custom three-wheeled
VolksBot platform provided by the Fraunhofer Insti-
tut (Fraunhofer, 2009). Data handling and sensor con-
trol is done with a notebook placed on the top of the
platform. This set-up minimizes obscurations for the
sensor. Used algorithms are implemented in Matlab
(Figure 1).
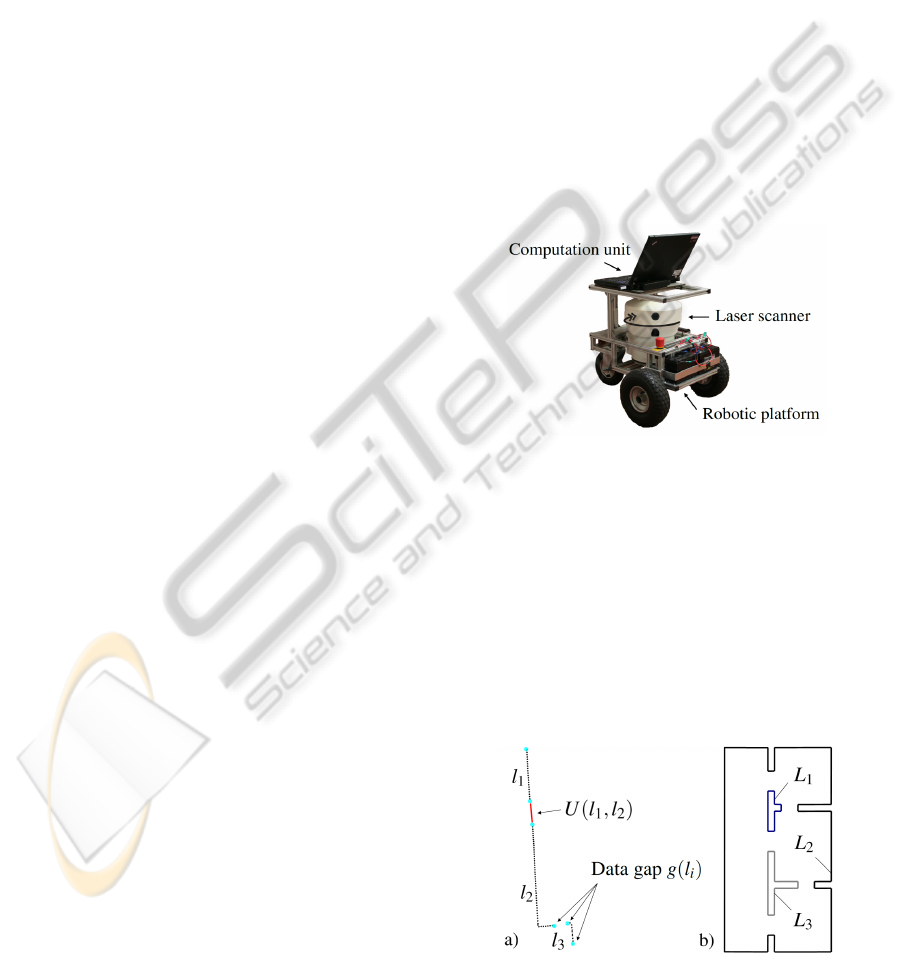
Figure 1: Hardware set-up.
4 GAP FILLING EXPLORATION
This section introduces an approach for the explo-
ration of an indoor scene in order to provide data of
the whole environment in sufficient density.
A: Representation of the Environment. The ap-
proach is based on the assumption that all occur-
Figure 2: Representation of the environment: a) mea-
sured line fragments l
i
, b) continuous line segments
L
i
.
ICINCO 2010 - 7th International Conference on Informatics in Control, Automation and Robotics
116
ing surfaces can be described as continuous and self-
contained line segments L
i
(Figure 2b)). The envi-
ronment is assumed as static. During the measur-
ing procedure exploration is incomplete and actually
searched segments L
i
are just existent in fragments l
i
that have to be connected (Figure 2a)). A segment
ends, when no more neighboured points can be found
within a certain distance d
gap
. Since a phase measur-
ing sensor is used, the layout of the measuring and
exploration procedure has to be adapted accordingly.
Data can be captured just from single selected points,
while the mobile platform is resting. This causes a
typical next best view problem.
For the definition of the area, accessible for the
robot, an occupancy grid is used, composed of clas-
sified cell elements o
m,n
(Figure 5(a)). Spatial areas
infused by the laser beams of the sensor can be clas-
sified as accessible, respectively as buffer area, if the
affected cells are arranged close to obstacles or unex-
plored regions. This is necessary because the robot is
regarded as a circular, moving item in the map. The
same grid is used for path planning. If the next mea-
surement position is determined, an A* Algorithm is
used to find an unobstructed path consisting of pass-
able grid cells to it.
The end points of l
i
refer to gaps g(l
i
)
1|2
in the
logged data. Since these should be eliminated dur-
ing exploration they are the basic information of the
strategy. Existing approaches assume a knowledge
of the assignment U(l
i
↔ l
j
) between single gap
points building an unexplored area (Gonz
´
alez-Ba
˜
nos
& Latombe, 2002). This is advantegeous for the
choice of explorative measuring positions, but leads
to ambiguities if the scene consists of several line seg-
ments L
i
. Hence, the presented approach tries to de-
termine U(l
i
↔ l
j
), but isn’t reliant on it.
B: Score Map. Potential measuring positions p
m,n
arise from the set of accessible grid cells p ∈ M with
M = {p
m,n
| c
m,n
b= accessible}. All candiate positions
are evaluated due to their explorative suitability S
p
as
follows:
S
p
= − f
1
· k ·D
cp
2
− f
2
k
∑
i=1
D
i
pg
2
+ f
3
k
∑
i=1
D
i
gg
(1)
with k: number of visible gaps ∈ p
m,n
The candidate position with maximum value S
p
is
elected for next measurement position. To avoid un-
necessary long distances between the single measure-
ments, the euclidean distance D
cp
between the current
x
cur
and the next position candidate x
pos
is considered.
Long distances lead to low evaluations. The same is
true for the distance D
pg
of x
pos
to the visible data
gaps (see section C). Since short distance measure-
ments promise a better signal-to-noise ratio, those are
prefered. Another influencing factor describes the im-
portance of a data gap with regard to the progress of
the exploration (see section D). Here, an assumption
of gap assignments is utilized to determine the size of
the unexplored area the gap could belong to. Partial
influences are weighted individually with the factors
f
1
- f
3
.
This results in a score map, that can be overlayed
with the current occupancy grid. (Figure 5(c)) shows
this exemplarily. Bright shaded grid cells indicate a
good suitability for being the next measurement posi-
tion.
In the course of the exploration uncloseable data
gaps can occur, caused by unobservable surfaces or
adverse geometrical situations. These must not hin-
der the exploration procedure. The system has to be
able to recognize this circumstance to adapt its behav-
ior appropriately. For that reason, data gaps are pro-
vided with counters. A gap, that couldn’t be closed
after a certain number of trials, is not tried to be ob-
served any longer. That provides, that in repeatedly
observed areas these data points are contained, which
were captured from a shorter distance. Thus an inher-
itance of gaps must be intended for the case of a data
exchange.
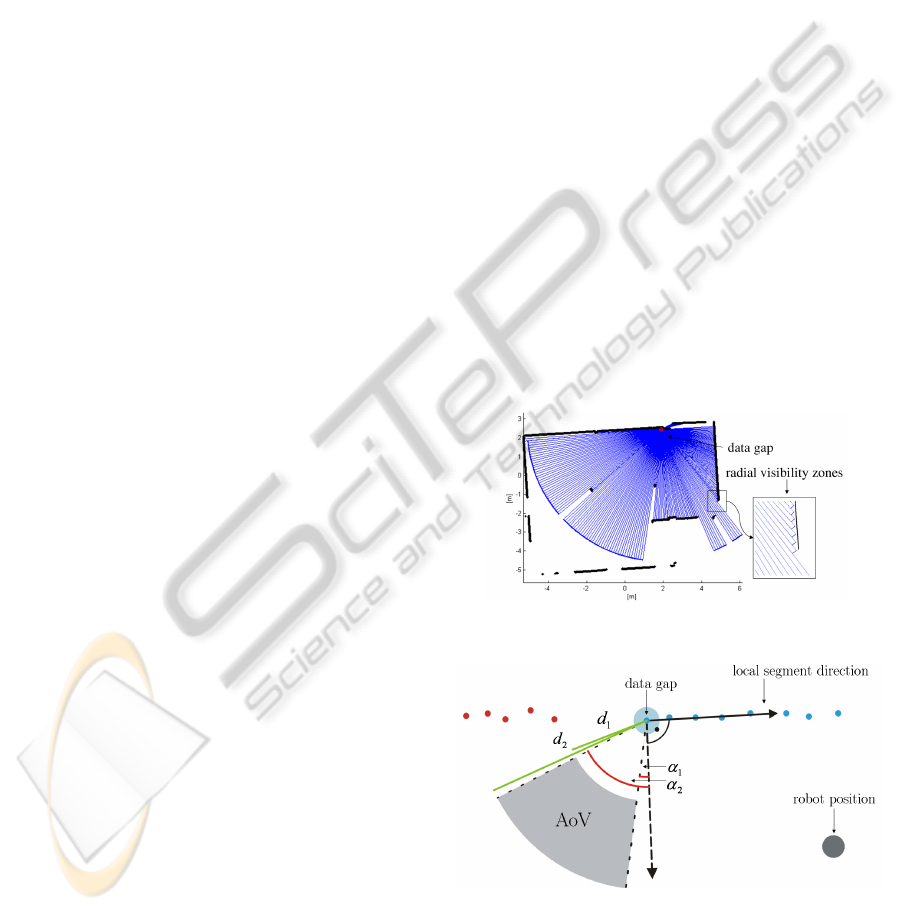
Figure 3: Visibility of gaps.
Figure 4: Area of visibility.
C: Area of Visibility. To ascertain the visibility of
gaps, inverse visibility scans are performed. The en-
vironment of each gap is divided into radially extend-
AUTOMATED 2D MEASURING OF INTERIORS USING A MOBILE PLATFORM
117

ing zones. Data gaps are visible along each zone up
to the point a line segment l
i
intersects the zone or the
sensors maximum range is reached (Figure 3).
Gap visibility is confined additionally. On the
one hand, the point of view, from where gaps can
be observed, should not have a too shallow angle of
incidence regarding the surface normal, because of
signal reflection. On the other hand measuring po-
sitions should be chosen, that imply a progress of
global exploration. Therefore, a ring segment-shaped
area of visibility AoV = AoV (lsd,[α
1
,α
2
],[d
1
,d
2
]) is
definied, from where gaps can be observed (Figure 4).
AoV is aligned to~n the normal vector of lsd, the local
segment direction of the gap . To avoid object ob-
servations on the back side, ~n points at the same side
where points of l
i
where measured from. To enable
an explorative behavior, AoV is spanned in an area
beyond~n relative to the current robot position.
D: Assignment Estimation. Gap assignments
U(l
i
↔ l
j
) are not used directly to deduce advanta-
geous measuring positions. Nevertheless, it is tried to
estimate potential connections. At least conclusions
on the size of the unexplored region, the data gaps
belong to, shall be retrieved to obtain an indicator
for their importance with regard to the explorative
benefit. So possible mismatches just lead to adverse
ratings instead of fatal misbehaviour. The estimation
is made using the hungarian method (Kuhn, 1955).
Starting point is the filling up of the square cost
matrix C
n×n
, that displays a complete bipartite graph.
Assignment costs c
i, j
between the data gaps g
n,1|2
are
given with their distances to each other. Distances of
assigned gaps are integrated in equation 1 as D
gg
.
c
i, j
=
(
| g
i
− g
j
|, i f l(g
i
) 6= l(g
j
),
∞ else.
(2)
So gaps g
n,1|2
, belonging to the same line segment l
n
,
should not be assigned to each other. This assumption
is valid as long as there are no almost completely ex-
plored line segments L
i
, that could be closed. Then
the probability of mismatches is increased. Figure
5(b) shows this exemplarily.
5 SCAN MATCHING
When the next measuring position is chosen the sys-
tem has to go there. The scanner is just usable at
standstill, so odometry is the only accessible data for
motion control. In interiors its accuracy is sufficient
for collision-free navigation, but not for a direct reg-
istration of collected data, in particular when highly
precise models are to be derived. Hence a robust and
precise scan matching is necessary for updating the
current system position and to assure exact mapping.
Registration of two-dimensional point clouds can be
described as a rigid body transformation on the ba-
sis of 2 translative components T
x
, T
y
and a rotatory
component α. So a point P
00
can be transformed with:
P
0
x
P
0
y
=
cos(α) −sin(α)
sin(α) cos(α)
·
P
00
x
P
00
y
+
T
x
T
y
(3)
To estimate the unknown transformation parameters
∆
ˆx
an adjustment according to the Gauß-Markov
model is proceeded:
∆
ˆx
= (A
T
GA)
−1
A
T
G∆
per
=
∆
α
∆
T
x
∆
T
y
(4)
A detailed description can be found in (Niemeier,
2002). Functional relationships f
n
between scans
have to be derived. For that perpendicular distances
∆
per
between data points P
00
n
of a new scan D
new
and
their foot points F
0
n
on the straight line segments s,
detected in the l
i
of the existing data D
exs
, are used.
s are derived like in (Nguyen et al., 2005). To derive
f
n
, ∆
per
is expressed using equ.3:
∆
per,n
=| P
00
n
− F
0
n
| (5)
Matching should take place in a manner that
∑
∆
2
per
is
minimized. Since f
n
are not linear functions, approx-
imate values have to be found and the adjustment has
to be executed iteratively.
For A
n,3
, f
n
have to be differentiated with respect to
the unknown parameters x:
A
n,3
=
a
1,1
a
1,2
a
1,3
a
2,1
a
2,2
a
2,3
.
.
.
.
.
.
.
.
.
a
n,1
a
n,2
a
n,3
with : a
n,u
= (
δ f
n
δx
u
) (6)
To give longer s a higher priority, since they are
less affected by outliers and signal noise, every f
n
is weighted on the trace of the weight matrix G, de-
pending on their own length and the longest occurring
straight line segment:
G
(n,n)
=
| s
n
|
| s
max
|
(7)
Two essential thresholds affect the matching. First,
d
line
for the definition of s, designating the maximum
permitted distance of points to the best fit straight line.
Second, d
area
for the area on both sides of s, where
points of D
new
can be found for ∆
per
(Figure 6). Points
further afield are not considered.
One major difficulty in scan matching is the
ICINCO 2010 - 7th International Conference on Informatics in Control, Automation and Robotics
118
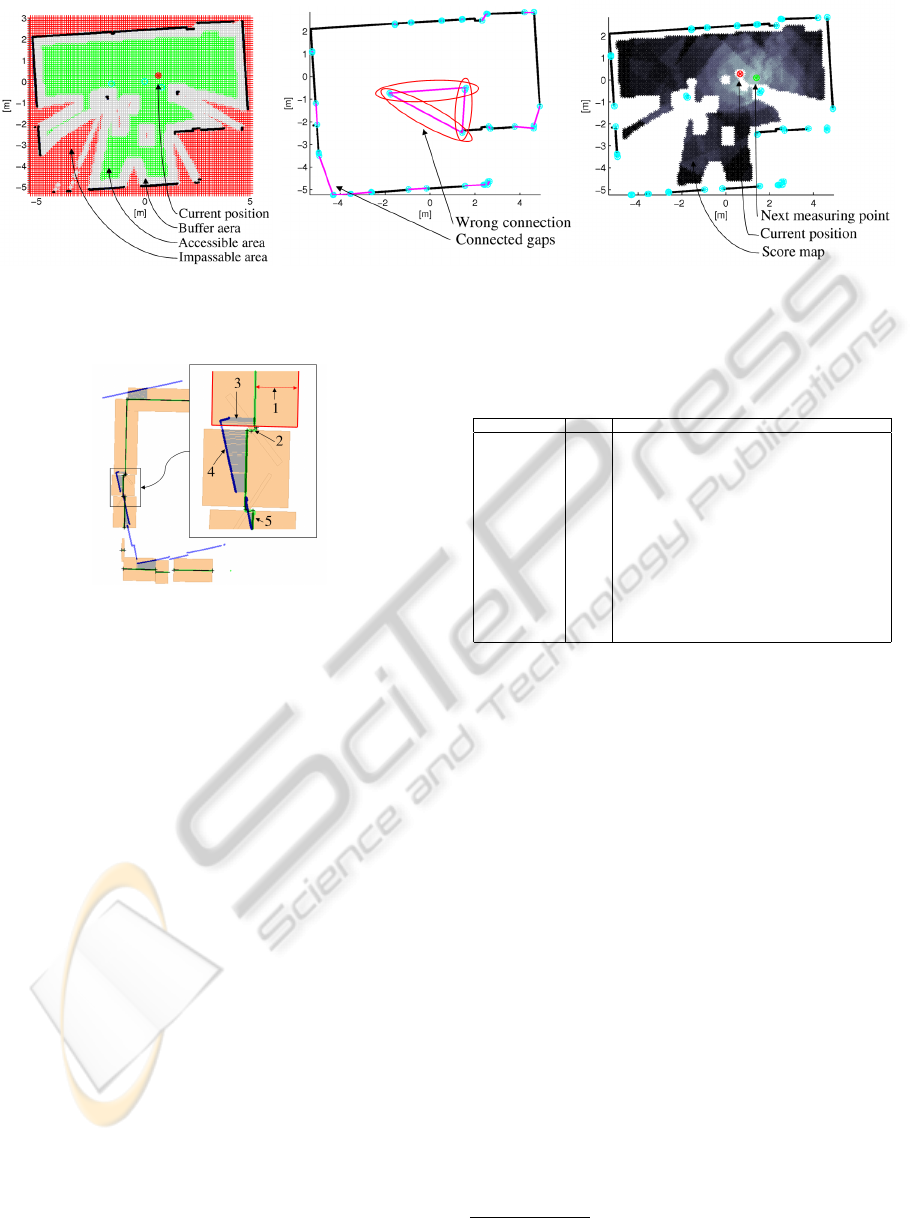
(a) Occupancy grid. (b) Gap assignment. (c) Score map.
Figure 5: Score map determination.
Figure 6: Scan matching with iterative stronger
threshold restriction: 1) d
area
, 2) straight line segment
s, 3) perpendicular disances ∆
per
, 4) new scan data
D
new
, 5) existing scan data D
exs
.
choice of adequate thresholds. While weak thresholds
entail a lower accuracy, a more strictly selection is at
the expense of robustness. This led to the implemen-
tation of an iteratively exerted matching, where d
line
& d
area
are restricted increasingly by halving. This
is iterated as long as there can be found enough line
segments in D
exs
with a certain minimum length and
a sufficient variation in their orientation. The latter is
necessary to avoid a degree of freedom in any spatial
direction. In this way it is achieved that just straight-
est lines and the points in their closest neighbourhood
are used for matching.
6 EXPERIMENTAL RESULTS
The system setup was tested in a interior scene of
ca.150 m
2
, consisting of several rooms and cleared
out (Figure 7). Based on 93 measurements a point
cloud of around 15k points was drawn up. Thereby
the system covered a distance of just over 160 meters.
Parameters and thresholds according to Table 1 were
used.
Table 1: Parameter settings for test environment ex-
ploration.
Parameter Value Description
d
area
(ini-
tial)
5cm distance to s, where points for ∆
per
are con-
sidered
d
line
(initial) 2cm maximum distance of points to the best fit
straight line
f
1
1.3 weighting of the distances to p
m,n
f
2
1 weighting of the distances to g(l
i
)
1|2
f
3
0.6 weighting of gap assignment assumption
d
gap
2cm minimal data gap distance b= model density
s
grid
0.1m edge length of grid cells o
m,n
v
counter
3 maximum number of trials to eliminate a gap
α
1
5 angular intervall for area of visibility
α
2
60 angular intervall for area of visibility
d
1
0.3m spacing intervall for area of visibility
d
2
7.5m spacing intervall for area of visibility
In principal, exploration of all rooms was success-
ful. Deficits can be observed with regard to the effi-
ciency. One issue are seesaw changes between zones
interesting for exploration, e.g. measuring positions
10, 11 & 12. Also notably is the high amount of mea-
surements on the left side of the scene. This was
caused by finely structured heatings, that were in-
stalled there. These led to many obscurations in the
scanner data and thus to data gaps the system tries to
close. To be able to conclude about the systems accu-
racy, ground truth data were recorded by generating
a model of the same scene with a tachymeter
1
. Same
points were tapped manually from the model the mo-
bile system generated. Both models were overlayed to
ascertain difference vectors. Coordinate differences
possess a standard deviation of s
0
= 5.2mm with max-
imal deviations of 1.2cm (Figure 7f)). As one can see,
the alignment of vectors shows no significant system-
atic influence of errors. d
area
& d
line
in Table 1 and in
the example of Figure5 differ. As Figure5 is for illus-
trative purpose, thresholds are set stricter in practise.
A rough pre-matching step is made then to overlay the
data already relatively accurate for higher robustness
against errors. Therefore the algorithm of (Winkel-
1
Leica TPS400 accuracy: -distance: 2mm + 2ppm -angle: 5
00
AUTOMATED 2D MEASURING OF INTERIORS USING A MOBILE PLATFORM
119
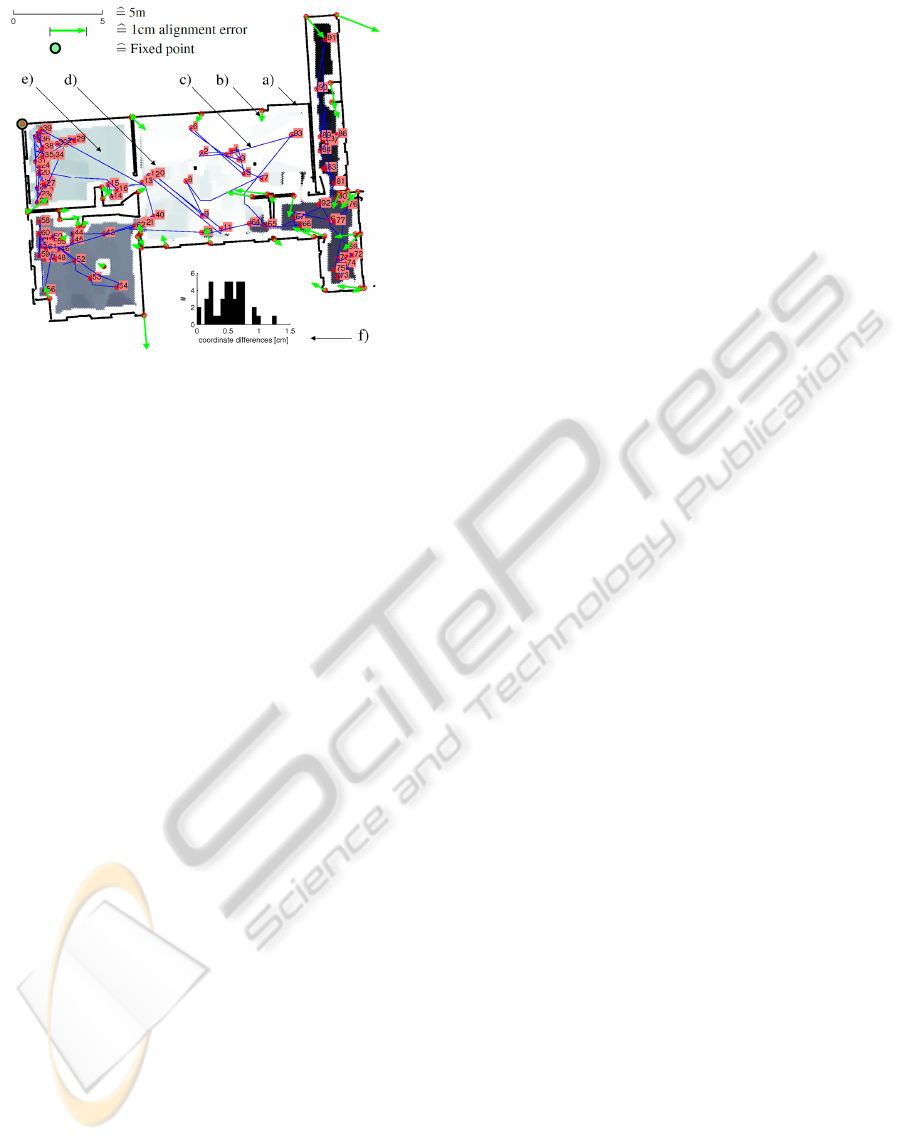
Figure 7: Test environment: a) model data, b) differ-
ence vectors to tachymeter model, c) path, d) succes-
sion of measuring positions, e) background, shaded
dependend on the point of time, the area was declared
as passable, f) histogram of differences to tachymeter
model.
bach et al., 2004) was adapted to the present condi-
tions.
7 CONCLUSIONS
This work introduces an approach for automated ex-
ploration and mapping of interiors. Experiments
showed that the system can deliver floor plan data of
high accuracy. To our best knowledge no previous
work on robotic 2D mapping could prove a compa-
rable accuracy. This is attributable to the sensor, but
also to the applied matching method. Mapping and
localization is done via scan matching solely, in con-
strast to many current approaches. So spacious en-
vironments cause difficulties for the approach, since
e.g. loop closing scenarios (Stachniss et al., 2004)
are not considered here. But the approach is demon-
strably powerful as long as the interiors size is limited
and there are enough geometrical landmarks existent
to deliver constraints to the matching, what both is the
case for small office environments. The exploration
strategy presented allows a complete observation of
the scene, but its efficiency is improvable. So future
work will engage in implementation of higher-level
strategies for exploration planning and control.
REFERENCES
Besl, P.J. and McKay, N.D. (1992). A method for registra-
tion of 3D shapes. IEEE Transaction on Pattern Ana-
lyisis and Machine Intelligence 14, Nr. 2. p. 239−256.
Choset, H. and Burdick, J. (1996). Sensor based motion
planning: The hierarchical generalized voronoi graph.
Ph.D. Thesis California Insitute of Technology, Pas-
sadena.
Elfes, A.(1987). Sonar-based real world mapping and
navigation. IEEE J. Robotics and Automation, RA-
3(3):249 − 265.
Fraunhofer IAIS Projekt: VolksBot. Domain:
http://www.volksbot.de/ (29.09.09).
Gonz
´
alez-Ba
˜
nos, H.H. and Latombe, J.C. (2002). Naviga-
tion strategies for exploring indoor environments. Int.
J. of Robotics Research. 21(10–11):829–848.
Kuhn, H. W. (1955). The hungarian method for the assign-
ment problem. Naval Research Logistic Quarterly, 2
83–97.
Kuipers, B., Froom, R., Lee, W.K. and Pierce, D. (1993).
The semantic hierarchy in robot learning. In J. Connell
and S. Mahadevan, editors, Robot Learning, Kluwer
Academic Publishers, Boston, MA.
Lu, Feng; Milios, Evangelos (1994). Robot pose estima-
tion in unknown environments by matching 2d range
scans. IEEE Computer Vision and Pattern Recognition
Conference (CVPR).
Niemeier, W. (2002). Ausgleichungsrechnung. de Gruyter,
Berlin - New York, ISBN 3-11-014080-2.
Nguyen V., Martinelli A., Tomatis N. and Siegwart, R.
(2005). A comparison of line extraction algorithms us-
ing 2D laser rangefinder for indoor mobile robotics.
Proc. Conference on Intelligent Robots and Systems,
Aug 2005, Edmonton, Canada pp. 1929–1934.
Schmidt, D., Luksch, T., Wettach, J. and Berns, K.
(2006). Autonomous behavior-based exploration of
office environments. 3rd International Conference on
Informatics in Control, Automation and Robotics -
ICINCO, Setubal, Portugal, August 1-5, 2006, pp.
235-240.
Stachniss, C.,Haehnel, D. and Burgard, W. (2004). Ex-
ploration with active loop-closing for FastSLAM.
In:Proceeding of 2004 IEEE/RSJ International Con-
ference on Intelligent Robots and Systems. Sendai,
Japan, pp.1505–1510.
Thrun, S. (2002). Robotic Mapping: A survey. Technical
Report CMU-CS-02-111, School of Computer Sci-
ence, Carnegie Mellon University, Pittsburg
Winkelbach, S., Rilk, M., Schoenfelder, C. and Wahl, F.M.
(2004). Fast random sample matching of 3d frag-
ments. Pattern Recognition, 26th DAGM Symposium.
Volume 3175 of Lecture Notes in Computer Science.,
Springer p. 129-136.
Yamauchi, B. (1997). Frontier-based approach for au-
tonomous exploration. In: Proceedings of the IEEE
International Symposium on Computational Intelli-
gence, Robotics and Automation, pp. 146-151.
Yaqub, T., Tordon, M.J. and Katupitiya, J. (2006). Line
segment based scan matching for concurrent map-
ping and localization of a mobile robot. In: Proc.
9th International Conference on Control, Automation,
Robotics and Vision, Singapore, pp.1-6.
ICINCO 2010 - 7th International Conference on Informatics in Control, Automation and Robotics
120
