
VERIFICATION OF AN INDUSTRIAL COMPUTER NETWORK
OF HIGH RISK OPERATION PLANTS
A NPP APCS Example
Vitaly Promyslov and Stanislav Masolkin
V.A. Trapeznikov Institute of Control Sciences, 65 Profsoyuznaya, Moscow 117997, Russia
Keywords: Modeling, Network calculus, Computer networks, Nuclear power plants.
Abstract: A modern APCS (automated process control system) of large plants, involving nuclear power plants (NPP),
is implemented as networked control system. In the paper, model based on the “network calculus” for an
NPP APCS segment is presented. A method of calculation of time characteristics of the system under worst
combination of input conditions is verified.
1 INTRODUCTION
An advanced APCS (automated process control
system) of large plants, involving nuclear power
plants (NPP), is implemented as a distributed in
functions and tools system with components
interacting with each other and with the plant by use
of a local area network (LAN). The time of passage
of a signal from a source to a receiver is an
important time characteristics of an APCS. The
signal source may be both an operator initiating an
action (control signal) – then the receiver is a
controller (gateway) transferring the command
directly to the lower level to an actuator, and a
digitized sensor signal– then the receiver is a
workstation at which the sensor signal is displayed.
Measuring this parameter within the process of
performance and adjustment of an NPP APCS is, as
a rule, a diagnostic function of the APCS. However,
direct measurements do not provide a required
quality of implementing the function, what is
determined by influence of the following factors:
• Some modes of LAN performance may not be
achievable under normal operation (being
emergence ones),
• Stochastic nature of interaction of components of
APCS software with each other, presence of
network equipment leads to the fact that the
measured parameter is a random value having a
complex distribution (Chen et. al. 2009).
For high risk operation plants, in addition to
direct measurements of the signal passage time with
subsequent statistical processing, one should use a
method which enables one to estimate the parameter
theoretically under worst combination of all possible
conditions influencing the measured parameter. We
investigate an applicability of a method known as
“network calculus” (Le Boudec and Thiran 2001) to
calculating LAN parameters. The calculation and
verification have been implemented for software of
the top level (SCADA) of prospective Russian NPP
APCSs (Byvaikov et. al. 2006) developed at the
V.A. Trapeznikov Institute of Control Sciences of
the Russian Academy of Sciences. All main data
presented in the paper have been received by the
authors in course of implementation of the
“Kudankulam” (India) NPP APCS.
2 PROBLEM STATEMENT
The NPP APCS LAN is partitioned on several
segments in accordance to technological
compartments (reactor compartment, turbine
compartment, etc.). The main data array circulates
inside a separate APCS LAN, amount of data
transferred between the segments of the APCS LAN
and NPP is small.
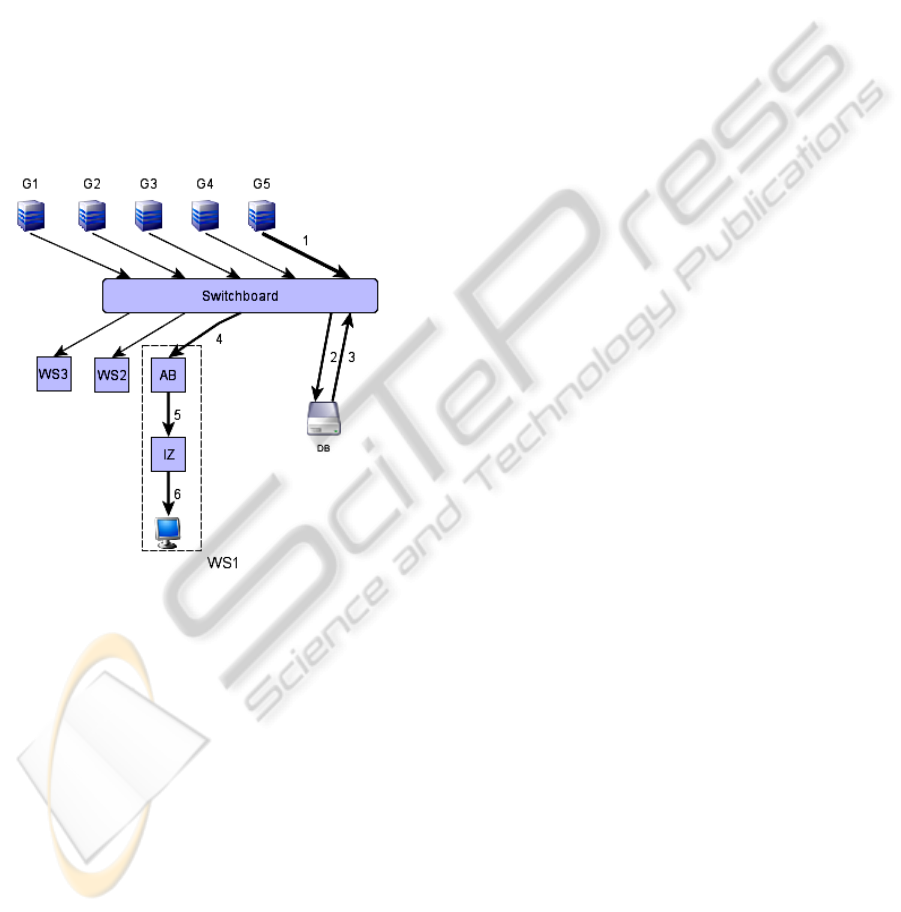
In Figure 1, a typical make-up of one segment of
NPP APCS is presented. Each segment is a set of
servers, gateways, and workstations united by the
network through a switchboard. For communication
between system components via the LAN, the
TCP/IP protocol of the class A is used, as a channel
74
Promyslov V. and Masolkin S. (2010).
VERIFICATION OF AN INDUSTRIAL COMPUTER NETWORK OF HIGH RISK OPERATION PLANTS - A NPP APCS Example.
In Proceedings of the 7th International Conference on Informatics in Control, Automation and Robotics, pages 74-79
DOI: 10.5220/0002878900740079
Copyright
c
SciTePress
level, the Ethernet network has been selected. Such a
solution, as practice shows, provides under steady
state acceptable stability and small time of
propagation a signal over the network between
components for given conditions (Profinet V1,
ModBus/IDA, Ethernet/IP) (Witsch1 et. al. 2006).
To analyze information flows circulating within
one segment of the NPP APCS, the segment LAN
has been presented as a block-scheme (Figure 1). In
the scheme nodes, there are indicated gateways (G1-
G5), server processing data (DB), and switchboard.
Also, in the segment scheme, there were introduced
nodes reflecting logical structure of the used
SCADA, functioning within a workstation, indicated
as IZ and AB. Internally IZ and AB are separate
processes which serve a data within a single
workstation and share same computing resources.
Figure 1: Model of APCS segment as a block-scheme. G1-
G5 – gateways, WS1-3 – workstations.
A characteristic of the system, being of
undisputable interest, is the time of passage of a
signal from a source to a receiver. It is assumed that
in the computer system there are provided absence
of loss of information and operability.
To calculate the system parameter, the method of
analysis pf deterministic systems “network calculus”
has been selected. The method is successively
applied to calculating parameters of both large
(Internet), and small (Intranet) computer networks
based on the TCP/IP protocol (Vantanski et. al. 2007
and Hwangnam & Hou 2004). In the paper, the time
of passage of a signal from the gateway to image in
the display is investigated. Sources of information
are gateways connected to the segment, servers (in a
general sense of the word as devices processing
information) are the switchboard and components
DB, AB, IZ. The terminal device is a workstation
display.
3 NETWORK CALCULUS: BASIC
CONCEPTS
The “network calculus” is a relatively new method
applied to analyze deterministic systems with a
queue, using the notion of plus-mini algebra. Basic
principles of the method have been installed in
papers (Cruz 1991a and Cruz 1991b), which, in turn,
have been being based on paper (Turner 1986), a
description of the method may be found in work (Le
Boudec & Thiran 2001).
Let us present basic notions of the applied
method by use of a networked system (Figure 2)
consisting of two components.
Let us define a flow function as a non-negative
non-decreasing function in time:
}{:;0,0)( +∞→
<
=
+
∪RRAttA . The flow function
may be considered as a counter counting data
inputted into the component and outputted from it.
Then one says on input/output flow function
correspondingly.
Before defining the next important notion, the
service function, let us define an operation of
“convolution” and an operation of “deconvolution”.
Let there are given two functions of a flow,
A
and
, the convolution of
S
A
и , is a function S
}{:*
1
+
∞→
=
+
∪RRSAA , such that :
)}()({inf:)(*)(
τ
τ
τ
−+
=
∈
tSAtStA
R
.
It is easily to see that the function is also a
function of the flow and it is non decreasing and
right continuous. A binary operation of the
“deconvolution”:
1
A
)}()({sup:))((
τ
τ
τ
StAtSA
R
−+
=
∅
∈
.
Let us define functions
)(
,
t
br
γ
(an affine function)
and
)(
,
t
TR
β
(a rate-latency function) of the
following form:
⎩
⎨
⎧
≤
>+
=
0,0
0,
:)(
,
t
tbrt
t
br
γ
,
⎩
⎨
⎧
≤
>−
=
Tt
TtTtR
t
TR
,0
),(
:)(
,
β
where, under modeling,
are frequently
interpreted as flow rate, flow burstiness, flow delay,
and flow capacity correspondingly.
RTbr ,,,
VERIFICATION OF AN INDUSTRIAL COMPUTER NETWORK OF HIGH RISK OPERATION PLANTS - A NPP
APCS Example
75

Let us assume that an input of a network element
is a flow described by a flow function
A
, output
flow is described by a flow function . The
network element has a minimal and maximal service
function, and
1
A
S
S correspondingly, of these meet
the conditions:
SAASAA *,*
11
≤≥ .
Let us define a notion of “envelope” for a flow.
A function
E
is an “envelope” of the flow
A
, if
E
A
A
*≤ .
The integral minimal (maximal) service function
()
SS for subsequently connected components of
a networked system without losses with minimal
(maximal) service function
N
(
)
ii
SS of an i-th,
, component is equal to:
Ni ...1=
N
SSSS *...**
21
=
N
SSSS *...**
21
=
For the a system (Figure 2) .
SAA *
*
≥
S
1
, S
1
S
2
, S
2
A(t)
A
*
(t)
A
1
(t)
Figure 2: A networked system with two subsequently
connected network components.
Let us define a delay of passage of data through a
network component as:
)}()(:{inf:)(
10
τ
τ
τ
+≤=
>
tAtAtd ,
then the maximal delay is:
}*{
0
inf: S
d
E
d
D ≤
≥
=
δ
,
where
d
δ
is burst delay function:
⎩
⎨
⎧
≥∞
<
=
0,
0,0
:
t
t
d
δ
.
The minimal delay is:
}0)(:{sup:
0
==
≥
tStD
t
.
4 CALCULATING DELAY
UNDER PASSGE OF A SIGNAL
FROM GATEWAY TO
WORKSTATION
In the block-scheme (Figure 1), there is emphasized
a way of signal passage from signal source
(gateway) to appear in the workstation display
(edges 1-5).
In order to preserve “transparency” of the
calculation (where it does not contradict to
authenticity of obtained results), to set
characteristics of components of the block-scheme
and input flows “simple” functions were used,
enabling one to receive analytical expressions of
desired parameters. As a function of “envelope” of
the input flow from gateways G1-G5, the function
)(
,
t
br
γ
is used, as a service function for all servers
(DB, AB, IZ, switchboard), the
)(
,
t
TR
β
is used.
Application for the “envelope” function of the
input flow with the dependence
)(
,
t
br
γ
is justified
by an algorithm of the interaction between the
gateway and DB server. In accordance to the
algorithm, the gateway sends packets of a fixed size,
equal to k
unit of data to DB server, with a
period . As a result of heterogeneity of time
characteristics of the server and time of passage of
the request over the network, the sampling period is
kept with accuracy . It is known (Le
Boudec and Thiran 2001), that the flow “envelope”
received from the gateway is described, in that case,
by the function
γ
T
γ
ττ
T<<,
)(
,
t
br
γ
with parameters
γγγ
τ
T/Tkkr )(/ bT ,
+
=
=
.
The algorithm of performance of the servers is
related to a type of algorithms with guaranteed rate
server, i.e.
Tfh
nn
+
≤
, where:
⎪
⎩
⎪
⎨
⎧
+=
=
−
Rlfaf
f
nnn
/),max(
0
1
0
,
where is the size of the data package, time
of completion of processing, and time of appearance
of information for the input
n correspondingly. For
the server of this type, it is known applicability of
the function
nn
ahl ,,
R
)(
,
t
T
β
for setting its service function
(Le Boudec & Thiran 2001). The servers have two
function modes differing by parameters and
T .
The modes are selected automatically in dependence
on make-up of received information and operator’s
actions. The minimal and maximal service functions
correspond to these two modes.
R
To determine the parameters service
function of the components DB, AB, IZ and input
flow , their direct measurements at the plant are
used, influence of the switchboard may be neglected.
ii
TR ,
br,
ICINCO 2010 - 7th International Conference on Informatics in Control, Automation and Robotics
76

Let us consider two separate types of the system
behavior. The first type is preserving the uniform
flow from the source to the receiver, i.e. each server
at the path of passage of the signal process data in
the flow only and do not change the total
information amount. The second type a
generalization of the first, is a variable bit rate
(VBR), when a server changes amount of transferred
information. The first type is rare in practice of
computer systems, at least within complex system,
however due to its computational simplicity it may
be used under preliminary analysis of a total system
and to calculate parameters of a system with uniform
flow. The second type is computationally more hard,
however it reflects a practical status more precisely.
4.1 Model with Uniform Flow
One can easily bee seen (see Section 3) that the end-
to-end minimal and maximal service functions for a
flow of interest propagated alone the emphasized
path (Figure 1) are:
)(
,
tS
s
T
s
R
β
=
(1)
and
)(
,
tS
M
T
M
R
β
=
(2)
where (Zdarsky & Martinovic 2008):
);()
(
4,3,2,14,3,2,1
∑∑
==
−∧∧−
−=
GGGGi
iIZAB
GGGGi
i
DBs
rRRr
RR
(3)
s
GGGGi
IZABDBi
GGGGi
i
IZABDBs
R
TTTrb
TTTT
∑∑
==
+++
+
+++=
4,3,2,14,3,2,1
)(
, (4)
i
MM
TTRR
∑
== ;min . (5)
Equations (3), (4) are written for assumption of
blind multiplexing flows in the channel, indexes
G1-G5,AB,DB,IZ define parameters for a
corresponding component of the system (Figure 1).
In the given case, the flows intersecting with the
main flow from the gateway G5 are flows from the
gateways G1-G4.
Finding the minimum and summation in equation
(5) is implemented over corresponding parameters
of the maxima service function
i
S for each
component (node) at the path of passage of the data
flow correspondingly.
The minimal delay of signal passage in the
system is
s
TD
=
, the maximal delay is
sGs
RbTD /
5
+= . (6)
4.2 Model with the VBR
This model type assumes that after passing a server,
at the path from source to receiver the flow may
change its amount. We will consider a case when the
output flow depends linearly on the output flow
with complete data set :
'
1
A
1
A
+
∈⋅= RAA
αα
:
1
'
1
with the “envelope”:
+
∈⋅= REE
αα
:
1
'
1
,
where the “envelope” of the output flow may be
represented via “envelope” of the input flow and
maximal and minimal service functions of the
component:
E
SSEE ∅= )*(:
1
. (7)
In the modeled APCS segment, a significant change
of the flow amount takes place after passing the
server DB. In accordance to that, the block-scheme
is partitioned on two parts: from the gateway to the
server DB and from the DB to the operator’s
display; the maximal delay of the signal passage has
been being calculated separately in each part, the
total delay is equal to sum of delays in each part.
For practical calculations of equation (7) when
)(
,
tЕ
br
γ
=
, and the first and the second part may be
described in the form of service functions
)(
11
,
t
TR
β
and
)t(
22
,TR
β
correspondingly, then may be
substituted by the approximation:
1
E
)(
11
rTbrtE +
+
≈
.
It is known that the maximal delay calculated
separately over path parts after summation becomes
more than the maximal delay calculated over the
total path (the “pay burst only once” principle) (Le
Boudec and Thiran 2001). For the system partitioned
on two components, the difference is:
212
// RrTRbD +=
δ
,
where are determined for each of parts
by formulae being analog to formulae (3)-(5).
2121
,,, RRTT
VERIFICATION OF AN INDUSTRIAL COMPUTER NETWORK OF HIGH RISK OPERATION PLANTS - A NPP
APCS Example
77
5 VERIFICATION OF THE LAN
MODEL OF THE APCS
SEGMENT
The NPP APCS segment model has been verified by
comparison of real and calculated by use of the VBR
model results. Measurement of the real data has been
being implemented at a NPP APCS test site at the
V.A. Trapeznikov Institute of Control Sciences
where a prototype of the “Kudankulam” NPP APCS
segment (Figure 1) has been assembled, by use of a
set of hardware and software tools being identical to
the real plant (Byvaikov et. al. 2006). To assign
input flows from the gateway G1-G5, simulators of
information flows validated for the “Kudankulam”
NPP APCS were used. At the prototype, measuring
the corresponding parameters involving into the
flow functions (equations 1-5) has been
implemented.
Let for the components of the block-scheme
(Figure 1) the following input parameters are
defined: the flow from the gateways G1-G5 is
equivalent and bounded by the function
)()(
,,
tt
br 1e585e3
γ
γ
= ; for the component DB, the
minimal service function
)()(
2.0,,
tt
TR 1e5
β
β
=
and
the maximal service function
)()(
5.0,,
tt
TR 5e5
ββ
=
,
6.0=
α
; for the server AB,
)()(
1.0,,
tt
TR 1e6
β
β
=
,
)()(
3.0,,
tt
TR 1e7
ββ
=
; for the server IZ
)(t)(
,
t
TR 02.0,1e6
β
β
=
,
)(
2.0,
t
1e7
β
) =
T
(
,
t
TR
β
, these
values has dimension of bits, bits per second, and
seconds for , and correspondingly.
These input parameters will be considered as
“normal”, which are assumed to be set for all
calculations and measurements in the paper, if
another is not specified. To assign the flow
parameters, the flow rate (r) as well as the size of the
output gateway buffer to assign heterogeneity of the
flow (b) were varied.
b
),r(R
In general, the difference between measured at
the prototype and calculated (VBR model) data is
not large, and does not exceed 30-50% at the work
range of the input data; at marginal values,
considerable mismatch (up to 100% of the measured
value) are possible, what perhaps reflects a non-
linearity of the investigated system.
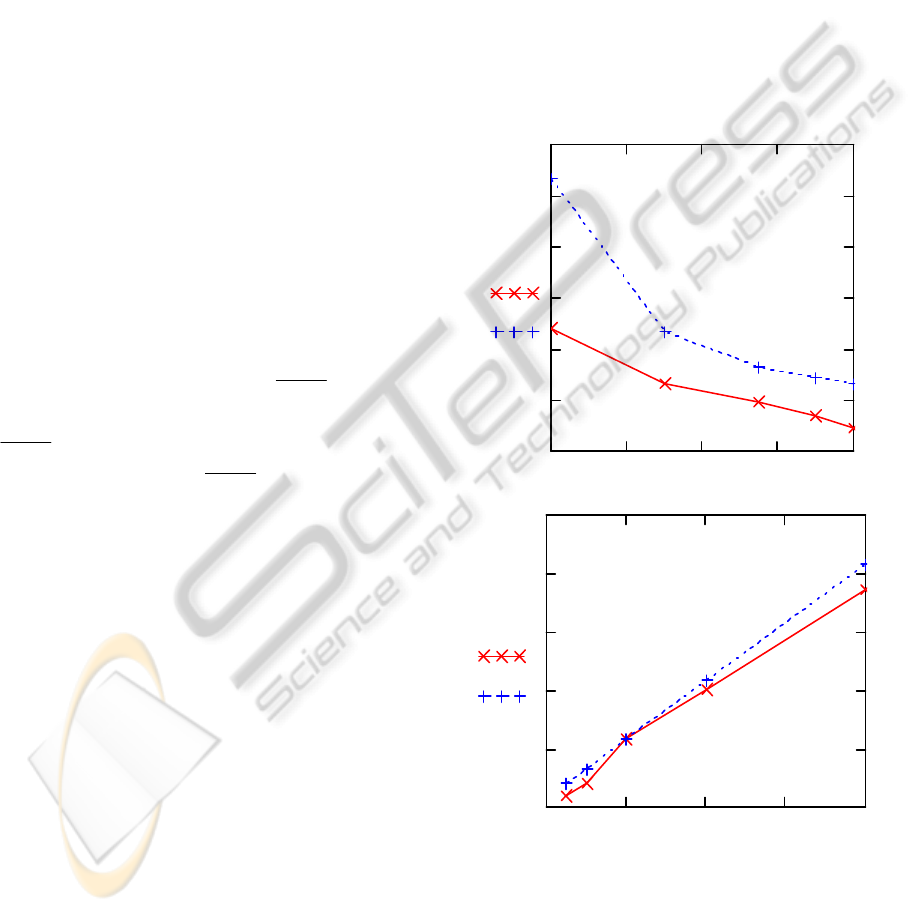
In Figure 3 (a), there are presented character
results of the modeling and real data on the maximal
signal passage time from the gateway to an image at
the workstation display. In the plot, the axis Х
represents capacity of the server element DB in
percents of the parameter bit/sec accepted
as 100%. Decreasing the capacity of the DB node
has been being achieved by parallel performance on
the computer of a background extra task of a
required capacity. The axis Y represents the
maximal delay in seconds. Each point of the real
dependence in the plot has been being selected, as a
maximum, at the interval 1 hour during measuring
the parameter.
51eR =
Figure 3 (b) presents a dependence of the
maximal delay of passage on the parameter а
representing heterogeneity of the input flow from the
gateway. As can be seen from equation (6), one
should expect linear dependency of the maximal
delay on flow heterogeneity, what is perfectly
corresponded to the measured data.
5G
b
20 40 60 80 100
0
1
2
3
4
5
6
RD
CD
CPU
0 200 400 600 800
0
2
4
6
8
10
RD
CD
INP
Figure 3 (a, b): To the upper (a), dependence of the value
of the maximal delay (sec) of server capacity (% of
maximally possible). CD –model data, RD – measured
data. To the lower (b), dependence of the maximal delay
(sec) of the parameter (Kbit). CD – model data, RD –
measured data.
5G
b
ICINCO 2010 - 7th International Conference on Informatics in Control, Automation and Robotics
78

6 CONCLUSIONS
Within works on creating a prospective NPP APCS
of the new generation, based on the method
“network calculus” it was developed and verified a
method of calculating time characteristics of the
system under worst combination of input conditions.
Such a solution will enable one to decrease NPP
APCS creation time, to decrease expenses and time
of validation of time characteristics of the system.
By use of the “network calculus” apparatus, a
model of a NPP APCS segment has been developed,
a delay of signal passage from a source to a receiver
within the segment has been calculated, formulae for
the maximal ad minimal service functions for the
NPP APCS segment have been derived. Parameters
of the computer system for control signals may be
symmetrically derived by analogous judgments.
REFERENCES
Chen Peng, Dong Yue, Engang Tian, Zhou Gu,. A delay
distribution based stability analysis and synthesis
approach for networked control systems, Journal of
the Franklin Institute, volume 346, issue 4, pp. 349-
365, May 2009.
Le Boudec, J.-Y., Thiran P. Network Calculus: A Theory
of Deterministic Queuing Systems for the Internet.
Springer-Verlag, 300 pp., 2001.
Byvaikov, E. M., Zharko, E. F., Mengazetdinov, N. E.,
Poletykin, A. G., Prangishvili, I. V., Promyslov, V. G.
Experience from design and application of the top-
level system of the process control system of nuclear
power-plant, Automation and Remote Control, volume
67, number 5, pp. 735-747, 2006.
Witsch, D., Vogel-Heuser, B., Faure, J.-M., Marsal G.
Performance Analysis of industrial Ethernet networks
by means of timed model checking, In Proc IFAC
INCOM ‘06 Symposium, 2006.
Vantanski, N. et. al. Compensating the transmission delay
in networked control systems, In 14th Nordic process
control workshop, NPCW ‘07, Espoo, Finland, 2007.
Hwangnam, Kim, Hou J.C. Network calculus based
simulation for TCP congestion control: theorems,
implementation and evaluation, In INFOCOM ‘2004.
Twenty-third Annual Joint Conference of the IEEE
Computer and Communications Societies. Publication
Date: 7-11 March 2004, volume 4, pp. 2844-2855.
ISSN 0743-166X.
Cruz, R. L. A Calculus for Network Delay. Part I:
Network Elements in Isolation, IEEE Transactions on
Information Theory, volume IT-37, pp. 114-131,
January 1991.
Cruz, R. L. A calculus for network delay. II. Network
analysis Information Theory, IEEE Transactions on
Information Theory, volume IT-37, pp. 132-141,
January 1991.
Turner, J. New Directions in Communications (or which
way to the information age?, IEEE Communications,
volume 24, number 10, pp. 8-16, .October 1986.
Zdarsky, N., Martinovic, F. A., Schmitt Ivan, Jens B. The
DISCO Network Calculator, In Proceedings: MMB
‘14th GI/ITG Conference – Measurement, Modelling
and Evaluation of Computer and Communication
Systems, Dortmund 2008.
VERIFICATION OF AN INDUSTRIAL COMPUTER NETWORK OF HIGH RISK OPERATION PLANTS - A NPP
APCS Example
79
