
A FRAMEWORK FOR ESTIMATING THE ENVIRONMENTAL
COSTS OF THE TECHNOLOGICAL ARCHITECTURE
An Approach to Reducing the Organizational Impact on Environment
Jorge Cavaleiro, André Vasconcelos
CODE – Center for Organizational Design and Engineering
INESC – Instituto de Engenharia de Sistemas e Computadores and Department of Computer Science and Engineering
Instituto Superior Técnico, Technical University of Lisbon, Lisbon, Portugal
André Filipe Pedro
Business IT Strategy & Management, Deloitte Consulting, Lisbon, Portugal
Keywords: Green IT, Enterprise Architecture, Environmental Efficiency, Cost Estimation, Information Technology.
Abstract: Green IT was developed from the growing concerns about the rise of the Information Systems energy cost
and power consumption along with the need for an environmentally efficient image of the organization.
This work addresses and links three main concerns: enterprise architecture modelling, need for energy cost
cuts and energy efficiency of Information Technology. It describes a new method to estimate the IT
architecture energy costs and CO
2
emissions, based on the technology layer of the enterprise architecture,
and some solutions for solving or, at least, reducing the environmental impact of the latter.
1 INTRODUCTION
The use of Information Systems (IS) is growing
(European Comission, 2008) (U.S. Environmental
Protection Agency, 2006) and the consequence of
this increase in the systems number and its working
load (Gartner Research, 2007) is, among others, the
rise of energy demands. This, combined with the
need for operational cost cuts, the demand to comply
with environmental standards (Energy Star, 2009)
and regulations (United Nations, 1998) (United
Nations, 2009) and the concern with implementing a
marketing strategy to decrease the ecological
footprint of the organization, emphasize the need for
action (Global Action Plan, 2007) (Laplante,
Nov/Dec 2008). These are the key areas at the heart
of Green IT.
Our approach to Green IT is more than
Information Technology (IT) infrastructure
optimization, in a sense that it attempts to identify
the existing problems in the infrastructure followed
by a benchmark
This article aims at linking enterprise architectures,
assets costs and technological infrastructure
optimization to address the concerns mentioned
before.
Therefore it reviews the latest developments in
Green IT (2). The following two sections (3 and 4)
describe the problems concerning Green IT and the
approach chosen to solve them. That approach is
demonstrated by using a model (section 5) and a
simple example of its application (section 6). In
section 7 this paper provides an overview about the
latest research developments and its future prospects
(9).
2 STATE OF THE ART
The next sections describe the latest developments in
Green IT and a set of regulations and incentives to
reduce the organization’s eco-footprint.
2.1 Enterprise Architecture
There are three relevant enterprise architecture
models to this work.
451
Cavaleiro J., Vasconcelos A. and Filipe Pedro A. (2010).
A FRAMEWORK FOR ESTIMATING THE ENVIRONMENTAL COSTS OF THE TECHNOLOGICAL ARCHITECTURE - An Approach to Reducing the
Organizational Impact on Environment.
In Proceedings of the 12th International Conference on Enterprise Information Systems - Information Systems Analysis and Specification, pages
451-455
DOI: 10.5220/0002899904510455
Copyright
c
SciTePress

The first one, Zachman Framework (Zachman,
1987), was published in 1987 and opened up an
approach to organize and align the organizations IS
with its business needs.
Today there is a sort of frameworks that allows
us to represent the whole enterprise from business to
technology concepts.
The most recent one is Archimate (Lankhorst,
2009). It defines a meta-model for business
architecture modelling. It is divided in three
organizational layers (business, applications and
technology) and three organizational aspects
(passive structure, active structure and behaviour).
Another similar tool is CEO Framework (FCEO)
(Vasconcelos, Sousa, & Tribolet, 2007). This
framework purpose is to model, on a non ambiguous
way, the organizational targets, business processes
and all of the resources used by the organization to
reach the his goals.
2.2 IT Efficiency
The rise of energy consumption, the research of new
technology and searching for new ways to reduce
energy consumption and environmental impact
created a new drive in the IT researching
community.
The major concern in energy consumption of the
IT infrastructure is the Data Centre (Deloitte
Consulting, 2007). For that reason some
optimizations and monitoring methods have been
developed. Power usage controlling metrics (Belady,
Rawson, Pfleuger, & Cader, 2008), optimization of
chillers operation (Schmidt & Iyengar, 2009), room
ventilation dynamics optimization (Hamann, et al.,
2009) or the reutilization of the heat produced by
servers (Brunschwiler, Smith, Ruetsche, & Michel,
2009) are some examples.
Other environmental efficiency improvements
can be made using fresh technologies like
Virtualization (Mann, 2009), Cloud-Computing
(Vaquero, Rodero-Merino, Caceres, & Lindner,
2009) or storage consolidation plans (Sun StorEdge,
2005).
Another key factor is human behaviour. There
are some daily actions taken that impact on energy
consumption. Some of the solutions are simple as
shut down computer screens while not in use or
reutilize paper to print draft documents or print tests.
3 PRESENT PROBLEM
Considering the issues discussed in Sections 1 and 2,
the problem addressed in this article is: “Could
energy consumption numbers defined by the
Technology Layer be used to estimate costs and
identify environmental problems related to IT?”
Our approach to that problem is spread into three
objective and targeted questions:
1. Could the data related to the energy consumption
and environmental efficiency of artefacts used in
Archimate Technology Layer (Lankhorst, 2009)
be applied to determine the environmental cost
of all the equipment owned by the organization?
2. Could the previous account be used to identify
problems related to the Technology Architecture
layer?
3. Completed the problem identification stage, are
there any solutions to improve environmental
efficiency that could be implemented?
Out of the work scope are subjects such as automatic
architecture identification and the use of other
enterprise architecture layers above technology
(such as business, application or information
architecture layers).
4 THE APPROACH PROPOSED
As previously mentioned in Section 3, the suggested
approach to the problem follows three steps. The
first one is to find out what Archimate Technology
Layer artefacts (Lankhorst, 2009) extensions are
needed to keep track of equipments environmental
cost. Those artefacts are extended with fields
representing the equipments specifications required
to do the cost estimation.
The second step is related to measure the IT
environmental cost. To do this a model was designed
to estimate power consumption. The model related
to servers and PC’s is based in real-time load
measurements in order to estimate the IT system
power usage on given moment.
The last step for solving the problem involves the
suggestion of a set of ideas to reduce the IT
environmental footprint. They are related to the IT
optimizations presented on sub section 2.2.
5 POWER USAGE ESTIMATION
Using measurements made by SPEC (Standard
ICEIS 2010 - 12th International Conference on Enterprise Information Systems
452
Performance Evaluation Corporation 2010) a first
version of a server energy consumption estimation
model has been created.
Using data of a set of one hundred and thirty two
measured servers, provided by SPEC, a method has
been developed for energy consumption estimation
based on the server load.
This method assumes that real power
consumption of the server for full and idle load
stages is previously known. Based on those two
stages figures and using a linear analysis represented
on Equation 1, power consumption can be estimated
in real time.
ܲ
௦௧
ሺ
݈
ሻ
ൌܲ
ௗ
൫
ሺ
ܲ
ெ௫ௗ
െܲ
ௗ
ሻ
ൈ݈൯
(1)
Tests run using data provided by the SPEC
measurements showed that this method has an
average error of 3.25%. Also there’s a data
correlation of 0.99354 between system load and the
real energy consumption values, so this is a good
approach.
6 METHOD APPLICATION
EXAMPLE
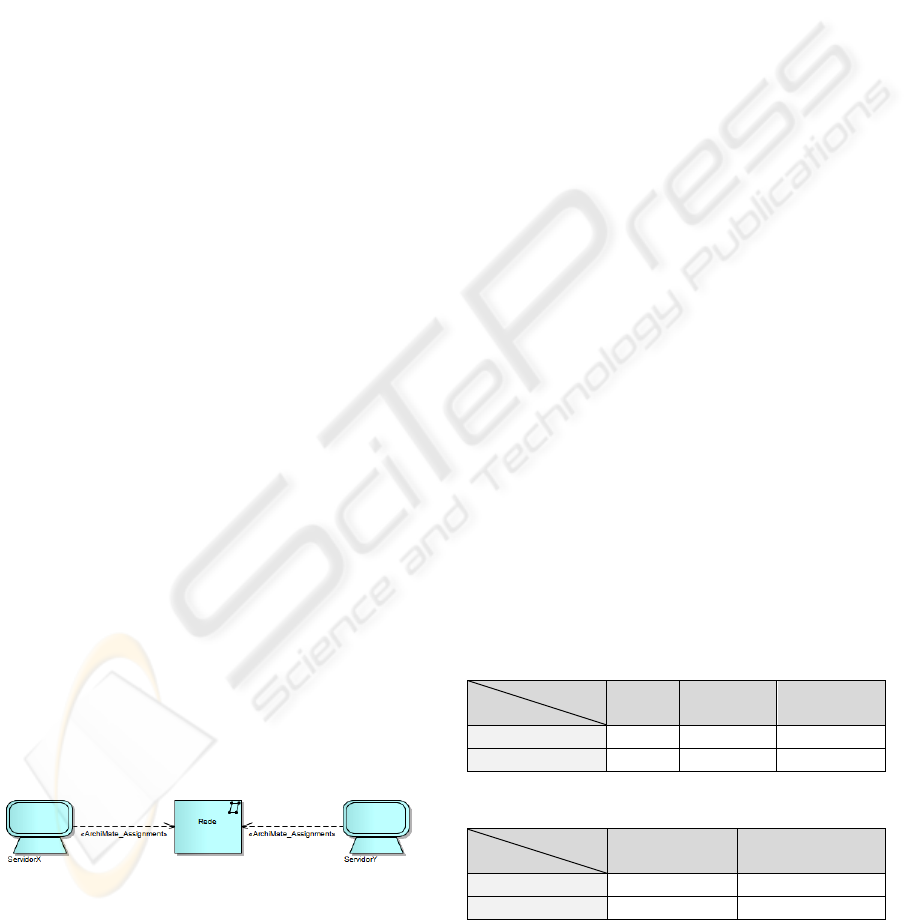
Suppose there are two servers X and Y connected by
a network. The target of this analysis is to estimate
the CO
2
emissions that each one of them produces.
Consider that the load of each server is 20%.
To represent this IT architecture using Archimate
and those environmental concerns, the artefact
Device has to be extended with the following fields:
• Load – Shows the system’s load percentage;
• Energy Consumption – Model estimation of
device energy consumption;
• CO2Emissions – Model calculation of device
energy consumption;
• Idle Power – Power usage of the system in the
idle state;
• Maximum Load Power – Power usage of the
system in full load state.
Figure 1: Archimate representation of Servers X and Y.
The graphical representation of the architecture
using Archimate model is shown in Figure 1.
The figures of power usage on full
(MaxLoadPower field) and idle load states
(IdlePower field) are previously known. Each server
test sample has been randomly selected from the
SPEC measurements to represent servers X
(SPEC_1, 2008) and Y (SPEC_2, 2008). In Table 1
energy usage values for servers X and Y are shown
for idle and full load stages and real energy usage is
shown at 20% system load (Real Power Usage
column) for later comparison. Using the approach
based on a linear growth of power usage related to
the system load on each moment, the Equation 1 can
be used to estimate the power usage for servers X
and Y.
Having the estimated figures for energy
consumption it is possible to calculate the CO
2
emissions produced by servers. For that purpose a
Portuguese government regulation (Diário da
República, 2008) establishes the conversion factor.
The results shown on Table 2 are the server
power usage estimation and its related emissions.
Comparing the real power usage figures shown
in Table 1 with the estimated figures for Servers X
and Y the results are drifted 7W (6.2%) and 2W
(1.1%), respectively.
7 ON GOING RESEARCH
This section presents the latest improvements in the
power consumption estimation model.
7.1 Server Power Estimation Model
The suggested model shows some inaccuracy and
functioning limitations.
The tests run with data provided by SPEC study
have shown a higher error of 6% between real and
estimated values at the 20% CPU load.
Table 1: Servers Consumptions.
State
Server
Idle
(W)
Full Load
(W)
Real Power
Usage (W)
Server X 89.40 173.00 113.00
Server Y 155.00 269.00 176.00
Table 2: Estimated Environmental Costs.
Cost
Server
Estimated
Power (W)
Emissions
(kgCO
2
eq)
Server X 106.12 0.0499
Server Y 177.80 0.0836
To improve it the model has been transformed from
a linear growth between idle and full load stages to a
model split into two sections: idle to 20% CPU load
stage; 20% CPU load to full load stage. Based on the
A FRAMEWORK FOR ESTIMATING THE ENVIRONMENTAL COSTS OF THE TECHNOLOGICAL
ARCHITECTURE - An Approach to Reducing the Organizational Impact on Environment
453

same principles used on the original model the
power usage at 20% CPU load is computed but
increased in 10%. After that the original method is
applied for both sections using the new value of
power usage at 20% load stage. Then a
transformation occurs in the graphical representation
showing two lines with different slopes.
This approach achieves a reduction of 1% on the
model average error.
To mitigate a final limitation, an upgraded
version of the model is being developed to be more
practical on real situations when data related to both
idle and full stages are not available.
The data resulting from SPEC study has been
modelled into multiple dimensions which consider
server specifications like the number of CPU chips,
cores per CPU or memory slots engaged. Using this
approach the aim is to find a typical value of power
usage for the idle and full power stages with the
combination of these multiple dimensions.
7.2 Printers Application
At present, the implementation of a model to
estimate the environmental footprint of printers in
the technology architecture is about to be completed.
There are two goals to be achieved with this
model: the first one is to prove that the principles
used for server’s power usage accounting could be
implemented in other technological equipments; and
the second one that is possible to use this efficiency
accounting to rate equipments and find out problems
of environmental efficiency on the technological
layer.
To achieve the first step, for each printing device
the model uses values related to the average time
needed to print one page, number (or average
number) of pages printed on a given time frame and
the manufacturer declared power usage for printing.
Also, for each device, the manufacturer power usage
definition for idle and, if available, “power saving”
mode, are considered. Using this data the model can
keep the account of the average energy consumption
on a given time frame.
The second step uses a framework that is based
on the ratio between the energy used and the number
of pages printed during a given month. With this
ratio calculated for each printer and using the office
layout and equipments distribution it is possible to
graphically check if there are areas in the IT
infrastructure that have energy usage inefficiency.
This generic method is also possible to apply to
servers, using a relevant ratio, like PUE (Rawson,
Pfleuger, & Cader, 2008), to calculate the
environmental efficiency of the equipments.
This approach is being applied in Deloitte’s office in
Lisbon. It is expected that the model will help to
determine existing problems on printer’s layout and
launch a staff awareness campaign on energy
consumption and paper use reduction.
8 CONCLUSIONS
This article gives a new approach to the problem of
environmental costs. This relates the enterprise
architectures with cost accounting to estimate the
environmental costs of IT operation.
This new approach holds a great potential to
address the environmental concerns of enterprise
organizations. Also, it’s a work with good
prospective of future applications due to its possible
extension to the upper layers of the enterprise
architectures and the relation with the environmental
performance, both areas with so many developments
today.
9 FUTURE WORK
This article traces a plan for a future work on Green
IT developments in energy consumption. As it
follows:
• A test on real environment is planned to compare
the results obtained using the model to estimate
the energy consumption against the real
consumption figures measured on the IT systems
considered. Although real energy consumption
figures are being used in the theoretical model
tests, this test in real environment will allow us
to compare the model’s accuracy in a real time
estimation and under real work load;
• This work only considers the technological layer
of the enterprise architecture. The extension of
this approach through all the others layers is
being considered. Therefore it will be possible to
carry on with CO
2
emissions quantification of
the organization’s products, service delivery and
processes. Going through all layers enables a
wider perception and a strategic awareness of the
environmental impact of the organization’s
energy consumption.
ICEIS 2010 - 12th International Conference on Enterprise Information Systems
454

REFERENCES
Belady, C., Rawson, A., Pfleuger, J., & Cader, T. (2008).
Green Grid Data Center Power Efficiency Metrics -
PUE and DCIE. Green Grid.
Brunschwiler, T., Smith, B., Ruetsche, E., & Michel, B.
(2009). Toward zero-emission data centers through
direct reuse of thermal energy. Journal of Research
and Development , 53 (3).
Deloitte Consulting. (2007). Green IT - The Fast-Track to
Enterprise Sustainability (White-Paper). Deloitte
Consulting.
Diário da República. (2008, June 26). Despacho no.
17313/2008. Diário da República, 2ª série - Nº122 .
Portugal.
Energy Star. (2009). ENERGY STAR Program
Requirements for Computer Servers. Washington:
Energy Star.
European Comission. (2008). Code of Conduct on Data
Centers Energy Efficiency - Version 1.0. European
Comission.
Gartner Research. (2007, April 26). Gartner Estimates
ICT Industry Accounts for 2 Percent of Global CO2
Emissions. Retrieved October 26, 2009, from Gartner:
http://www.gartner.com/it/page.jsp?id=503867
Global Action Plan. (2007). An Inefficient Truth. London:
Global Action Plan.
Hamann, H. F., van Kessel, T. G., Iyengar, M., Chung, J. -
Y., Hirt, W., Schappert, M. A., et al. (2009).
Uncovering energy-efficiency opportunities in data
centers. Journal of Research and Development , 53
(3).
Lankhorst, M. (2009). 5 A Language For Enterprise
Modelling. In Enterprise Architecture at Work -
Modelling, Communication and Analysis. Springer.
Laplante, P. A. (Nov/Dec 2008). IT Predictions for 2009.
10 (6).
Mann, A. (2009). Best Practices in Virtual Systems
Management - Virtualization Metrics and
Recommendations for Enterprises. EMA IT
Management.
Rawson, A., Pfleuger, J., & Cader, T. (2008). Green Grid
Data Center Efficiency Metrics: PUE and DCIE.
Green Grid.
Schmidt, R., & Iyengar, M. (2009). Thermodynamics of
information technology data centers. Journal of
Research and Development , 53 (3).
SPEC_1. (2008, November 3). ASUSTeK Computer Inc.
ASUS RS160-E5 (Intel Xeon L5430 Processor, 2.66
GHz). Retrieved January 10, 2010, from
SPECpower_ssj2008: http://www.spec.org/power_ssj
2008/results/res2008q4/power_ssj2008-20081103-
00093.html
SPEC_2. (2008, Setember 12). Acer Incorporated Altos
R520. Retrieved January 10, 2010, from
SPECpower_ssj2008: http://www.spec.org/power_ssj
2008/results/res2008q4/power_ssj2008-20080912-
00076.html
Standard Perfomance Evaluation Corporation. (2010,
January 4). SPEC
. Retrieved January 6, 2010, from
SPEC: http://www.spec.org/
Sun StorEdge. (2005). The Business Case for Storage
Consolidation - White Paper. Sun.
U.S. Environmental Protection Agency. (2006). Report to
Congress on Server and Data Center Energy
Efficiency. Washington: Energy Star Program.
United Nations. (2009). Copenhagen Accord. United
Nations. Copenhaga: United Nations - Framework
Convention on Climate Change.
United Nations. (1998). Kyoto Protocol to the United
Nations Framework Convention on Climate Change.
Kyoto, Japan: United Nations.
Vaquero, L. M., Rodero-Merino, L., Caceres, J., &
Lindner, M. (2009). A Break in the Clouds - Towards
a Cloud Definition. ACM Computer Communication
Reviews , 39 (1).
Vasconcelos, A., Sousa, P. M., & Tribolet, J. M. (2007).
Information System Architecture Metrics: an
Enterprise Engineering Evaluation Approach. The
Electronic Journal on Information Systems Evaluation
, 10 (1), 91-122.
Zachman, J. (1987). A Framework for Information
Systems Architecture. IBM Systems Journal , 26 (3),
276 - 292.
A FRAMEWORK FOR ESTIMATING THE ENVIRONMENTAL COSTS OF THE TECHNOLOGICAL
ARCHITECTURE - An Approach to Reducing the Organizational Impact on Environment
455
