
AN INTELLIGENT FRAMEWORK FOR AUTOMATIC EVENT
DETECTION IN ROBOTIC SOCCER GAMES
An Auxiliar Tool to Help Coaches Improve their Teams’ Performance
Jo
˜
ao Portela, Pedro Abreu, Lu
´
ıs Paulo Reis, Eug
´
enio Oliveira
LIACC-NIADR, DEI, FEUP-Faculty of Engineering of Porto University, 4200-465 Porto, Portugal
Julio Garganta
Faculty of Sport of Porto University, 4200-450 Porto, Portugal
Keywords:
Soccer performance assessment, Temporal sequential analysis, Robotic soccer.
Abstract:
In soccer, the level of performance is determined by a number of a complex variables interrelated: technique,
tactics, psychological factors and finally, fitness. Because of this, analyzing this information in a real-time,
even for soccer experts like professional coaches has become an impossible task. Automatic event detection
tools occupy an important role in this reality, although nowadays there isn’t any tool capable of producing
information capable of helping a professional coach choosing his team strategy for a specific game. In this
research project an automatic event detection tool is purposed and, a set of game statistics defined by a group
of sports researchers. All the teams present in the 2009 RoboCup tournament have a pass success rate superior
to 65%. These statistics provide an interesting viewpoint on how to evaluate a team performance, such as the
importance of dominating the opposing team field without losing the control of our own (this can be seen on
the top 3 zone dominance statistics). In the future this project will serve as a base for building a Framework
capable of simulating a match between two heterogeneous soccer teams and produce reliable information for
optimizing the team performance.
1 INTRODUCTION
Soccer is a Collective Sport Game (CSG) where two
teams compete to achieve a common goal: to score at
least one more goal than the opponent.
During a soccer match an observer/coach is un-
able to view and process the entire action taking place
in all of the playing area. Consequently, when a
human observer examines a soccer game, he usu-
ally adopts the ball tracking as his selection criteria
(Hughes et al., 2001). As a consequence of that,
performance analysis tools constitute a key role for
improving teams’ performance. Such tools are al-
ready used to produce individual and collective anal-
ysis data (Khatoonabadi and Rahmati, 2009) (Chen
et al., 2003). In spite of that, the majority of the ex-
tracted information has no direct relation to the team
performance. An example of this situation is the cal-
culus of team/player running distance during a match.
Although this information is present in many soccer
analysis tools, other statistics such as the number of
missed passes by a player in a certain region of the
field among others, would be a greater contribution
when assessing a team performance by its coach. In
this research work, an automatic tool capable of cal-
culating statistical information is proposed. This tool
would be the base for, in a near future, building a
framework capable of simulating matches between
two distinct teams. The statistics calculated were de-
fined by a group of academic researchers in the soc-
cer analysis area and the produced tool was used to
generate statistics for the 2009 RoboCup soccer sim-
ulation 2D league games. The results are quite sat-
isfactory which opens a good perspective in terms of
future work. The remainder of this paper is organized
has follows: section 2 describes the related work in
the soccer game analysis, section 3 presents all the
concepts behind the statistics calculus, section 4 ex-
poses the achieved results and in the last section the
conclusions are presented and future work trends are
discussed.
244
Portela J., Abreu P., Reis L., Oliveira E. and Garganta J. (2010).
AN INTELLIGENT FRAMEWORK FOR AUTOMATIC EVENT DETECTION IN ROBOTIC SOCCER GAMES - An Auxiliar Tool to Help Coaches Improve
their Teams’ Performance.
In Proceedings of the 12th International Conference on Enterprise Information Systems - Artificial Intelligence and Decision Support Systems, pages
244-249
DOI: 10.5220/0002900202440249
Copyright
c
SciTePress

2 RELATED WORK
A soccer team is constituted of eleven players (agents)
with different individual goals but with a common
collective goal (previously mentioned).
Being soccer one of the most popular sports in
the world (Dunning, 1999) many researchers have de-
veloped tools to study it. In this section these tools
were split into three groups: Professional perfor-
mance tools used by real soccer coaches; Playful so-
lutions incorporate all kind of video games related to
Soccer Management; Research software, in particu-
lar the ones used in the context of the RoboCup simu-
lation league.
2.1 Professional Performance Tools
Today, the competitiveness in professional soccer is
higher than ever so, even the slightest detail can in-
fluence the match result. In order to achieve that goal
professional soccer coaches use automatic tools capa-
ble of generating tactical and technical information.In
this section four distinct softwares were analyzed (ta-
ble 1). Three of the four analyzed softwares capture
the match images through video cameras.
2.2 Playful Software
The first video games appeared in 1948 (Goldsmith
and Ray, 1948), and this industry has been growing
ever since. Due to market demands, game develop-
ers everywhere have been trying to make their simu-
lations more realistic diminishing the differences be-
tween simulation and reality. In this section four soc-
cer manager games were analyzed (table 2). In this
reality the online softwares (Hattrick and Planetar-
ium manager) have a huge gaming community and
periodically simulate some matches of the European
leagues. Although they have a huge number of play-
ers, they do not generate a large amount of statis-
tics and the simulation has many random factors. On
the other hand we have the offline games which have
a good player and team model (football manager).
However these models are constructed manually by
scouts. Simulation wise, this software has one of the
most advanced simulation modes but this model is
still based in a pseudo random factors and teams for-
mation which, is not the best way to simulate a match.
2.3 Research Software
For this research work the focus will be specially on
the soccer simulation environments (table 3). One
of the best known simulation applications is the
RoboCup Soccer Simulator 2D. Other softwares like
SSIL statistics or team assistant have emerged which
have the capability to calculate a huge amount of in-
dividual and collective statistics complementing the
RoboCup Soccer Simulator 2D.
3 APPROACH
In this section the process of event detection and the
events themselves are described. The definition and
selection of these events was made according to sport
expert panel constituted by academical sport profes-
sors.
3.1 Initial Considerations
The statistics are extracted from the 2D competition
2009 logs and, for that purpose the SoccerScope2
1
software was chosen as the base for development.
This software reads the logs and creates a list of
Scenes each corresponding to an instant of the game.
This structure allows a sequential analysis of the
match which, facilitates the adoption of this software
for both offline and online analysis.
3.2 Detected Events
The events listed here were considered the most rele-
vant in the study. Although the events detected in this
work are of common use, a brief description of them
and, when necessary, the algorithms that allow their
detection is included.
Ball Kick. A ball kick occurs when a player sends
the kick or tackle command and the ball is within
range [0,kickable margin].
Ball Possession. Ball possession is determined by
the ball kicks. If the team of the current player is
the same as the previous player kicking then the ball
possession did not change, on the other hand when
this does not hold (they are not from the same team)
the ball possession between those two kicks is con-
sidered to be NEUT RAL. This ball possession data is
extended by contextualizing every instant of posses-
sion to the region where it occurred, the zones con-
sidered are the interception of the Wings and Quar-
ters field partition. Wings is an horizontal partition
that divides the field in three equal parts. Quarters is
1
More information online at http://ne.cs.uec.ac.
jp/koji/SoccerScope2/index.htm
AN INTELLIGENT FRAMEWORK FOR AUTOMATIC EVENT DETECTION IN ROBOTIC SOCCER GAMES - An
Auxiliar Tool to Help Coaches Improve their Teams' Performance
245
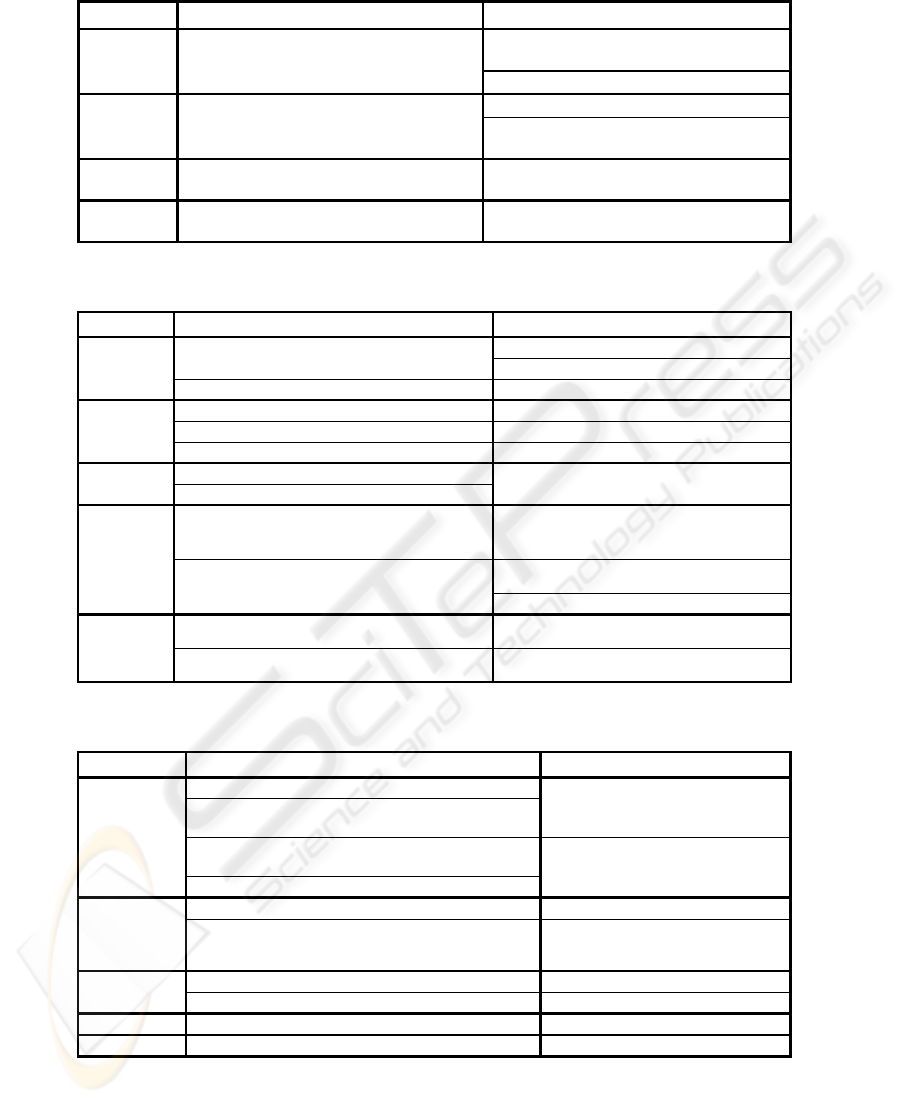
Table 1: Professional performance tools comparison.
Name Strengths Weaknesses
Theneedofamanualtreatmentoftheimages
afteracquisition
Non‐existenceofplayerandteammodeling
Non‐existenceofplayerandteammodeling
Inabilitytoshowtherealvideofeedtogether
withthe2Danalysis
Ascensio
MatchExpert
3Dgameviewerwheretheusercanseethe
soccermatch(frompreviouslycollected
Poorstatisticaltreatmentwhencomparedto
theprvioussoftwareanalyzed
MatchVision
Studio
Automaticimagetreatmentafteracquisition
Nomodelconstructionoftheplayersandteams
despitethestatisticdatapermit
Amisco
Statisticaltreatmentofthegame(individual
andcollectivelevel)
Prozone
Statisticaltreatmentofthegame(individual
andcollectivelevel)
Table 2: Playful software comparison.
Supports various types of competition not only at a senior
Name Strengths Weaknesses
Elifoot
Firstmanagersoftwarethatappearedonthema
Playermodelingalmostnon‐existent
rket
Nosimulationmode
Veryuser‐friendlyinterface Severallimitationsonplayertransactions
FootballManage
Verycompleteplayerandteamsmodelling Playermodellingisdonemanually
Existenceofapseudo‐simulationmode
r
Limitiedtrainingsimulationmode
Currentmarketleader Non‐existenceofarealisticgamesimulation
Championship
Manager
Powerfulnewtalentsobservationmode
Non‐existenceofarealisticgamesimulation
Verycompleteplayersdatabase
Hattrick
Innovativeplayertransactionsystem
Thegamereportpresentedattheendofeachgameis
justarandomreportgeneratedrandomlybythe
application
Availableonlinewithabigcommunitywhichmakes
competitive
Verylimitedplayerscharacterizationwiththeir
parametersfilledrandomly
itmore
Norealgamesimulationmode
Planetarium
Manager
Supports various types of competition not only at
levelbutalsoatajuniorlevel
a senior
Non‐existenceofteammodeling
Supportsseveraldifferentlanguagesandalargenu
leagues
mberof
Non‐existenceofarealisticgamesimulation
Table 3: Research software comparison.
Name Strengths Weaknesses
TheRobocup
SoccerSimulation
Client/ServerArchitecture
Nogamestatisticsgenerated
Theplayerscanbedevelopedinanyprogramminglanguagethat
supportssockets
Realisticsoccersimulationincludingsomehumancharacteristics
Default2Dviewerisverybasic
Possibletoconnectbothonlineandofflinecoaches
SSILstatistics
Capableofcalculatemanydifferentgamestatistics Nosimulationmode
XMLstatisticsoutputincludesaXSLTforconvenientHT
visualizationonline
ML
Thesetofgeneratedstatisticsarestill
incompleteanddidnotpresentagood
spectrumofteamperformance
TeamAssistant
Bothindividualandcollectivestatistics Camerasyncnotyetperfected
Realistic3Dviewer Norealgamesimulationmode
Logalyzer Capableofcalculatemanydifferentgamestatistics Norealgamesimulationmode
TaoofSoccer Bothteammanagementandgamesimulation Nogamestatisticsgenerated
a vertical field partition that divides the field into four
equal quarters.
Pass. A pass is when two players of the same team,
exchange the ball with each other. One of the players
kicks the ball so that his teammate can catch it, if the
receiver catches the ball without any of the opponents
intercepting the pass was successful on the other hand
if the pass is intercepted it is considered a pass miss.
The pass is considered offensive when it ends in the
opposing teams MIDFIELD. It is a break pass when
the receiving player of the pass is inside the opposing
ICEIS 2010 - 12th International Conference on Enterprise Information Systems
246
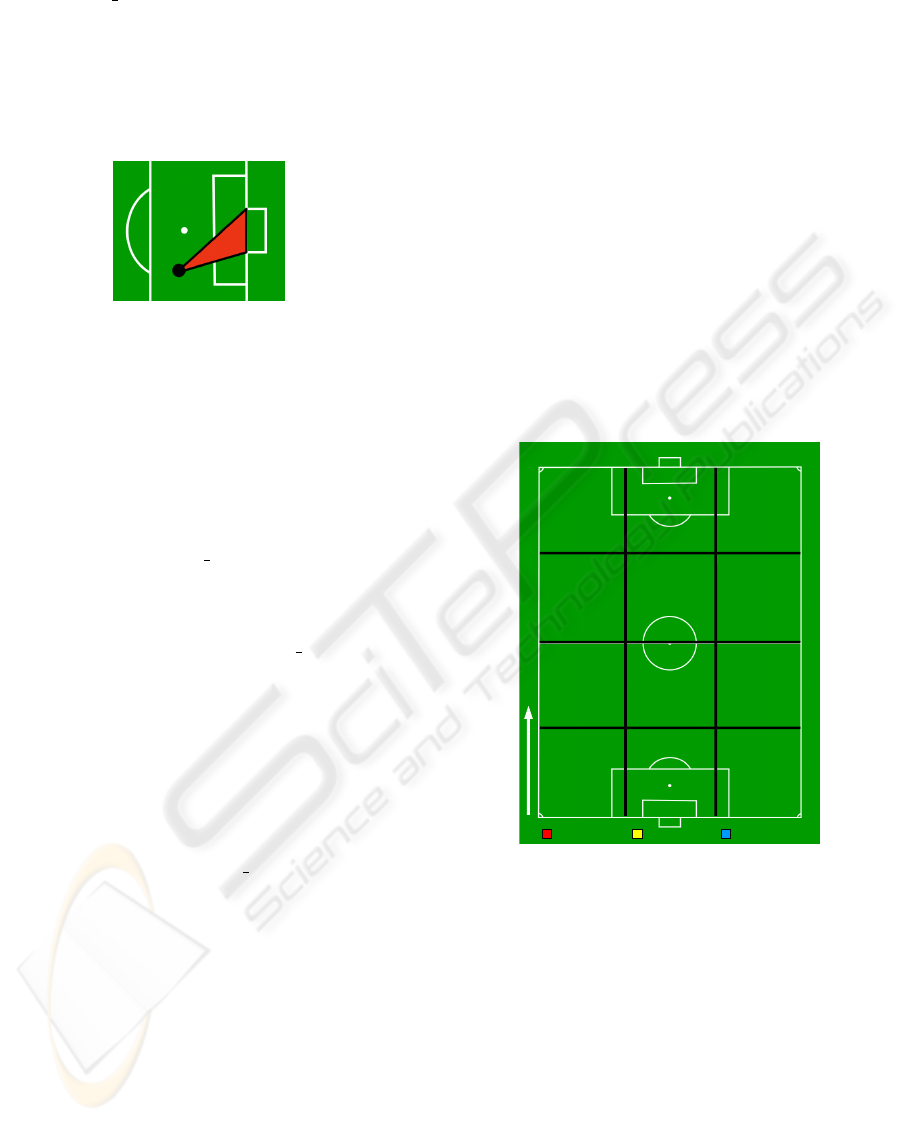
team DANGER AREA and has a goal-scoring oppor-
tunity. The goal-scoring opportunity is defined by
creating a virtual triangle having the player and the
opposing team goal poles as vertexes (figure 1) and
checking if the number of the opposing team players
inside are less than two. A break pass is always an
offensive pass.
Figure 1: Triangle area in red (the black dot represents the
player).
Attack. An attack from a team perspective is when
the ball advances in the direction of the opposing team
field starting by a kick of one of its players. The attack
must last at least 30 cycles to be valid attack. In the
attack process if the ball goes back but stays in the last
quarter of the opposing team field and in the attacking
team possession, the attack remains valid. When the
ball reaches the DANGER AREA the attack is clas-
sified according to a attacking speed of 0.9ups (units
per cycle) or better for a fast attack, [0.4 − 0.9]ups for
a medium attack otherwise will be a slow attack. If
the ball does not reach the DANGER AREA the at-
tack will be classified as a broken.
Pass Chain. A pass chain is a sequence of passes
made by the same team without losing ball posses-
sion.
Goal Opportunity. This occurs when three condi-
tions are met. The player is in kicking conditions (the
ball is within range - [0,kickable margin]). The ball is
close to the opponent goal. The last condition is that
the previously mentioned goal-scoring opportunity.
Wing change. This event occurs when a pass starts
and ends in different Wings. A wing change from/to
the MIDDLE wing is considered a partial wing
change. Two sequential partial wing changes repre-
sent a full wing change.
4 RESULTS
In this section the detected events detected in the
RoboCup 2D simulation 2009 league logs will be pre-
sented. Due to size limit constraints, the authors adopt
to present only a subset of the calculated statistics that
where considered to be the most significant ones.
4.1 Zone Dominance
The zone dominance calculates the average ball pos-
session in each field region per team. In the fig-
ure 2, the zone dominance of the top three teams in
the RoboCup Soccer Simulation 2D 2009 are shown
(Wright Eagle in red, Helios20090 in yellow and Oxsy
in blue respectively). This zone is displayed as if they
were attacking from the bottom to the top of the field.
As expected all of the 3 top teams have great con-
trol over the opponent team field, of these three teams
WrightEagle is the one that also retains more control
in its own field, in particular the middle field. This
dominance is closely followed by Helios2009 and at
last we have Oxsy. This order is the same as the com-
petition results.
26%
24%
13%
48%
35%
22%
24%
14%
17%
33%
42%
20%
65%
37%
26%
24%
48%
24%
49%
53%
42%
52%
48%
40%
46%
61%
43%
78%
53%
59%
68%
51%
50%
75%
70%
59%
HELIOS2009WrightEagle Oxsy
Figure 2: Zone Dominance for the top three tournament fi-
nalists.
4.2 Passes
The ratio between the successful and missed passes is
calculated and shown in figure 3. Regarding that fig-
ure, it is easy to note that even the robotic team that
presents the lowest ratio (successful versus missed
pass) have a percentage of successful pass greater
than 67% of the total executed passes. Comparing
this data with the final classification of each team in
the latest RoboCup competition, it is interesting to see
that the team that presents the best ratio is the cham-
pion team (Wright Eagle). However the Bahia 2D
team, which occupied the last position in the tourna-
ment presents only the sixth worst registry. Also it is
AN INTELLIGENT FRAMEWORK FOR AUTOMATIC EVENT DETECTION IN ROBOTIC SOCCER GAMES - An
Auxiliar Tool to Help Coaches Improve their Teams' Performance
247
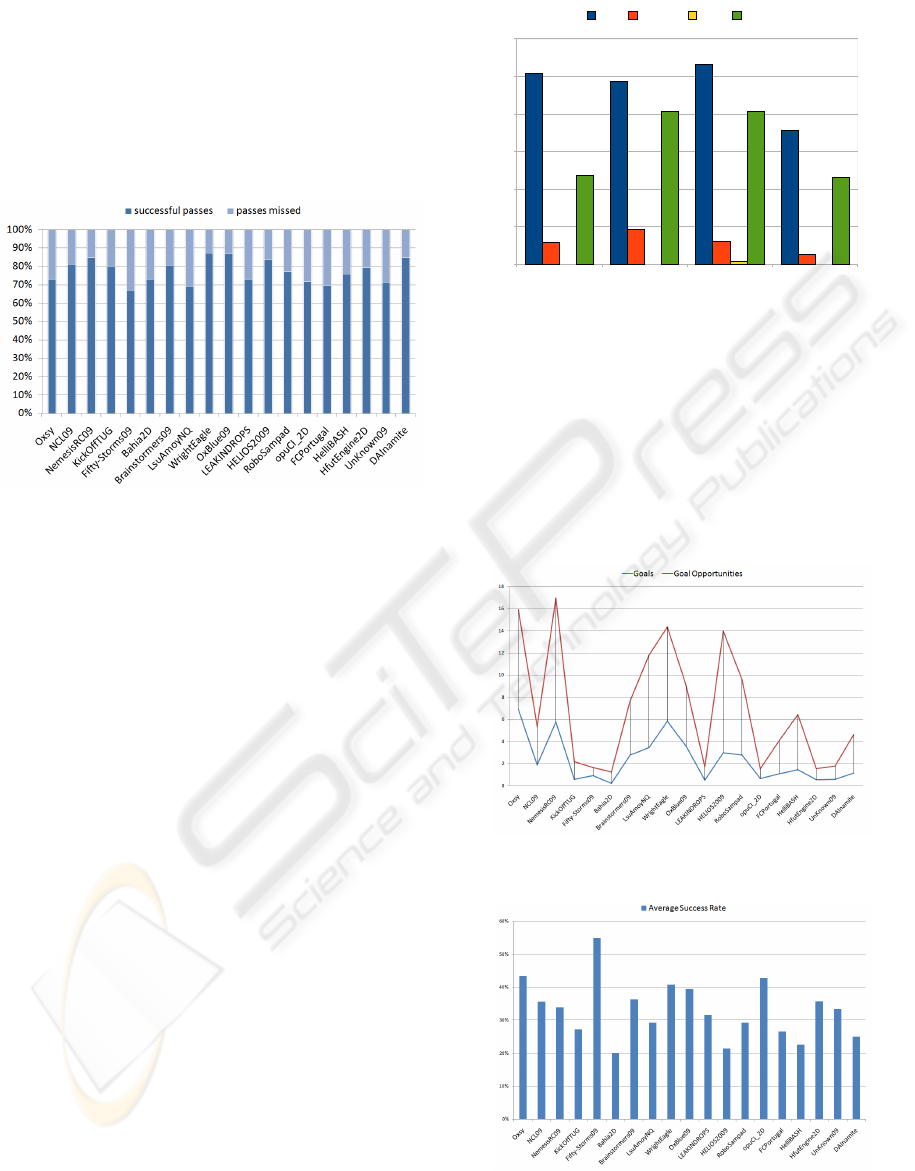
important to note that Oxsy, which occupied the third
position in the tournament, didn’t have a good ratio
between successful and missed passed (sixth worst
mark), similar to LsuAmoyNQ which occupied the
fifth position in the tournament and presents the sec-
ond worst mark. This fact could indicate that this
statistics per se did not influence directly the final
match result.
Figure 3: Successful to missed passes relation.
4.3 Temporal Sequence
A temporal sequence is detected when a team has pos-
session of the ball and without losing it, advances in
the field with the direction of the opponent goal un-
til it achieves a specific zone called ”the last third
of the field”. This sequence is essentially an attack.
Its classification is done according as previously de-
scribed. The figure 4 shows the calculus of temporal
analysis for the top four teams of the tournament. It
is clear to note that the main difference between the
top three teams is to the number of break sequences
over the competition. This indicator can represent that
the first team in the tournament (Wright Eagles) has a
huge percentage of success in terms of attack in com-
parison to other teams. Also it is interesting to note
that the team in the fourth place team Brainstormers
presents the lowest value of Medium Sequence which
is a peculiar characterization of its game.
4.4 Goal Opportunities
The winner of a soccer match is determined accord-
ing to the final goal difference (scored - conceded).
The team that presents the higher goal difference will
be acclaimed as the winner of the match. In order
to achieve that primary goal, the creation of goal op-
portunities constitutes a good indicator for a coach to
measure his team performance. Observing the figure
5) one can check that three of the four teams that have
a large number of goal opportunities, were the three
WrightEagle HELIOS2009 Oxsy Brainstormers09
0
2
4
6
8
10
12
Fast Medium Slow Broken
Figure 4: Temporal sequence of the top four teams.
finalist of the tournament and two of them present
the higher (NGoals)/(NOpportunities) ratio (up to
40%) in figure 6. Analysing the same figure it is cu-
rious to note that the team that presents the best goal
success ratio was ranked with the ninth place in tour-
nament (FiftyStorm team) which means that in spite
of having a higher success rate, the number of goal
opportunities is still small when compared to other
teams.
Figure 5: Goals and goal opportunities, per game (average).
Figure 6: Goal to opportunity ratio.
ICEIS 2010 - 12th International Conference on Enterprise Information Systems
248

5 CONCLUSIONS AND FUTURE
WORK
In this section the project’s main conclusions are
drawn based on the results presented in the previous
section. In this research an automatic statistical soc-
cer tool is proposed. This tool is capable of identi-
fying soccer events to help soccer coaches improv-
ing their teams performance. The set of statistics are
defined by a group of sports researchers and the test
data used is the RoboCup 2009 tournament – soccer
simulation 2D in particular – logs. Similar to other
research studies (Castellano-Paulis et al., 2007) in or-
der to detect all of the events, a sequential analysis
method was used and proved itself as a good approach
for this particular environment.
Regarding the results obtained in the previous sec-
tion it is important to note that even some of the most
simple statistics seem to yield important clues to a
way a team plays or some of the characteristics it
could improve. One of such statistics is the goal op-
portunities versus goal scored, in this score the top
teams present excellent results. Some other teams
such as Fifty Storm and OPUCI 2D in spite of hav-
ing a good ratio, still need to improve their creation of
goal opportunities over the game. The field zone dom-
inance statistics of the three leading teams suggests
that dominating the opposing team field is a must, but
what seem to set them apart from each other is the
ability to also control their own field. Finally, from
the sequence analysis point of view the observed re-
sults suggest that the fast attacks are the most impor-
tant of the bunch. The low number of broken attacks
of the WrightEagle team also point out that success-
fully reaching the opponents field can be a distinction
factor. It was also curious to note that some important
statistics like successful passes to pass misses relation
do not seem to demonstrate, by itself, any relation to
the final results of the competition. Possible interpre-
tations for this fact could be that the success of the
passes is already so high for every team that it loses
its’ importance or that the statistics should be comple-
mented with further contextual information. Taking
into account the project’s features then, as referred
in previous sections, the next steps of development
should focus on three fundamental aspects. The first
aspect is the identification of which is/are the statis-
tics (already calculated) that most influence the final
result. Off course in this set, for obvious reasons, the
scored goals cannot not be considered. The second as-
pect is the offline match simulation between two dis-
tinct teams. The main goal of this is to understand
which strategy is better to improve the final game re-
sult based on the analysis of specific statistics (previ-
ously selected). The authors believe that if a team can
use this information before playing a game against
an opponent, the changes of victory will greatly in-
crease. The final step of this process is the analysis
and identification of strategic opportunities by a team
in a competition scenario (real-time/online analysis).
This step is preceded by the offline analysis.
ACKNOWLEDGEMENTS
The second author is supported by FCT under Doc-
toral Grant SFRH/BD/ 44663 / 2008.
REFERENCES
Castellano-Paulis, J., Hernandez-Mendo, A., Morales-
Sanchez, Veronica, and Anguera-Argilaga, M. (2007).
Optimising a probabilistic model of the development
of play in soccer. Quality and Quantity, 41(1):93–104.
Chen, T., Han, M., Hua, W., Gong, Y., and Huang, T.
(2003). A new tracking technique: Object tracking
and identification from motion. Computer Analysis of
Images and Patterns, 2756/2003:157–164.
Dunning, E. (1999). Sport matters: sociological studies of
sport, violence, and civilization. Taylor and Francis,
1999.
Goldsmith, T. and Ray, E. (1948). United states patent of-
fice.
Hughes, M., Evans, S., and Wells, J. (2001). Establishing
normative profiles in performance analysis. Interna-
tional Journal of Performance Analysis in Sport, Vol-
ume 1, Number 1, 1(1).
Khatoonabadi, S. and Rahmati, M. (2009). Automatic soc-
cer players tracking in goal scenes by camera motion
elimination. Image Vision Comput., 27(4):469–479.
AN INTELLIGENT FRAMEWORK FOR AUTOMATIC EVENT DETECTION IN ROBOTIC SOCCER GAMES - An
Auxiliar Tool to Help Coaches Improve their Teams' Performance
249
