
HOURLY PREDICTION OF ORGAN FAILURE AND OUTCOME
IN INTENSIVE CARE BASED ON DATA MINING TECHNIQUES
Marta Vilas-Boas, Manuel Filipe Santos, Filipe Portela
Departamento de Sistemas de Informação, Universidade do Minho, Guimarães, Portugal
Álvaro Silva, Fernando Rua
Serviço de Cuidados Intensivos, Hospital Geral de Santo António, Porto, Portugal
Keywords: INTCare, Intelligent Decision Support Systems, Clinical Data Mining, Real-time prediction, Hourly
prediction, Intensive Care Medicine.
Abstract: The use of Data Mining techniques makes possible to extract knowledge from high volumes of data.
Currently, there is a trend to use Data Mining models in the perspective of intensive care to support
physicians’ decision process. Previous results used offline data for the predicting organ failure and outcome
for the next day. This paper presents the INTCare system and the recently generated Data Mining models.
Advances in INTCare led to a new goal, prediction of organ failure and outcome for the next hour with data
collected in real-time in the Intensive Care Unit of Hospital Geral de Santo António, Porto, Portugal. This
experiment used Artificial Neural Networks, Decisions Trees, Logistic Regression and Ensemble Methods
and we have achieved very interesting results, having proven that it is possible to use real-time data from the
Intensive Care Unit to make highly accurate predictions for the next hour. This is a great advance in terms
of intensive care, since predicting organ failure and outcome on an hourly basis will allow intensivists to
have a faster and pro-active attitude in order to avoid or reverse organ failure.
1 INTRODUCTION
In the information era, Intensive Care Units (ICU)
are a particularly attractive area for the use of Data
Mining (DM) techniques. Large quantities of clinical
data is produced and stored every day. However, the
databases may have valuable unknown information
regarding the patient’s prognosis. Human medical
data is the most rewarding and complicated of all
biological data to mine and analyze (Cios, 2002).
Critical patients’ condition is so complex that
sometimes even doctors find it hard to decide about
the most adequate procedure to provide them the
best health care possible. Despite of the patient’s
vital signs being constantly monitored, they only
serve as alarms to inform when a patient’s condition
is deteriorated; they don’t have the capability of
predicting those conditions, leading to a reactive
attitude of the medical staff. Subsequently, the
challenge is to use DM techniques to discover
unknown patterns and to predict dysfunction and
organ failure, as well as the patient’s outcome in a
timely manner, so that physicians may have a pro-
active attitude towards the patients’ best interest.
Hence the new approach of hourly prediction.
The use of DM techniques in the medical arena has
been gaining an increasing interest by researchers
but, despite the high expectatives, its application in
real world settings has been limited (Bellazzi, 2008).
To fill this gap, we are developing the INTCare
system (Santos, 2006), (Gago, 2006), (Silva, 2006),
an Intelligent Decision Support System (IDSS)
(Gago, 2008) that makes uses of DM techniques for
predicting organ failure and outcome for the next
hour. INTCare (PTDC/EIA/72819/2006) has
evolved greatly and it is currently being tested in
Hospital Geral de santo António (HGSA), Porto,
portugal.
The purpose of this paper is to present the new DM
models generated with data collected in the ICU of
HGSA, in real-time for hourly prediction of organ
failure and outcome.
270
Vilas-Boas M., Filipe Santos M., Portela F., Silva Á. and Rua F. (2010).
HOURLY PREDICTION OF ORGAN FAILURE AND OUTCOME IN INTENSIVE CARE BASED ON DATA MINING TECHNIQUES.
In Proceedings of the 12th International Conference on Enterprise Information Systems - Artificial Intelligence and Decision Support Systems, pages
270-277
DOI: 10.5220/0002903802700277
Copyright
c
SciTePress

Section 2 presents an overview on prediction of
organ failure and outcome and previous work, as
well as the INTCare system. Section 3 describes the
data modelling for the creation of the DM models
for each organ system and outcome. Later, it
presents the results, whose predictive performance is
discussed in section 4. Section 5 concludes this
paper with some considerations regarding this study
and it is pointed the future work.
2 BACKGROUND AND RELATED
WORK
Throughout the past 30 years, clinical scores have
been used to assess severity of illness and organ
failure in ICU and to stratify patients according to
their clinical condition (Silva, 2008). Prognostic
scores have undergone significant development,
validation, and refinement. Several models of organ
failure and mortality risk prediction have become
available, including the Sequential Organ Failure
Assessment (SOFA), which scores six organ systems
(cardiovascular, respiratory, renal, coagulation, liver
and neurological) (Le Gall, 2005). However, the
probabilistic nature of those models compromises
their application to the individual patient and is not
universally accepted (Silva, 2007). Each patient has
its individual characteristics; therefore, apart from a
global learning over patients, a more local learning
of would be useful (Ramon, 2007).
Recent innovations in risk adjustment include
automatic physiologic and diagnostic variable
retrieval and the use of artificial intelligence
(Rosenberg, 2002). Assessing the degree of organ
failure is a crucial task in ICU since one of the
critical aspects of ICU is to avoid or reverse organ
failure (Vincent, 1996). The earlier the patient’s risk
is identified, the earlier a correct therapy can be
applied.
DM is an important step of a process entitled
Knowledge Discovery in Databases (KDD) (Fayyad,
1996) which has brought the researchers’ attention.
The scope of DM goes beyond complex queries
to databases for hypothesis validation; it also
includes the discovery of new and previous
unknown patterns (Fayyad, 1998).
DM techniques can be applied in the
development of prognostic models to be integrated
in a Decision Support System (DSS). Some attempts
have been made to predict organ failure (Toma,
2008) but, to our knowledge, there is no DSS
implemented in a real environment that uses online
and real time data to predict organ failure for the
next hour.
Next, it is presented the INTCare system, an
Intelligent Decision Support System (IDSS) that
uses DM techniques for prediction of organ failure
and outcome, in real-time, for the next hour.
2.1 The INTCare System
INTCare is a situated IDSS for intensive medicine
that is being developed in the ICU of the HGSA in
Porto, Portugal. It relies on intelligent agents
(Abelha, 2004) that perform autonomous actions in
order to meet its purposes (Gago, 2006), (Santos,
2006). It is capable of predicting organ failure of six
systems (cardiovascular, respiratory, renal, liver,
coagulation and neurological) and outcome, i.e. the
patient’s status at the time of discharge (dead or
alive). Although the results attained could be
considered as promising (Gago, 2008), the previous
models were developed using offline learning, with
data from 42 European ICU (Miranda, 1999). The
challenges are to further develop these models so
that they can be used throughout the ICU. They are
part of the DM agent of the INTCare system, which
is responsible for the retrieval of relevant data in
order to make possible the application of the DM
models in real time (Gago, 2006). This system is
semi-autonomous, avoiding the need for manual data
preparation and integration, which has been pointed
as a great obstacle in the implementation of
prediction models as a decision support tool
(Ramon, 2007), (Patel, 2008).
As pointed before by research on the INTCare
(Gago, 2008), the new developments should regard
the inclusion of the data available as it is registered
(i.e. online data) to guarantee that all relevant
clinical information is taken into account for
decision support in real-time.
This is possible due to the new improvements of
the INTCare system that uses, not only the data
gathered by the bedside monitors (e.g. heart rate),
but also data from the Electronic Nursing Record
(ENR) (e.g. lab results) (Santos, 2009).
3 PREDICTION MODELS
FOR THE NEXT HOUR
3.1 Data Description
The data used to generate the DM models was
gathered in the ICU of HGSA during the period
HOURLY PREDICTION OF ORGAN FAILURE AND OUTCOME IN INTENSIVE CARE BASED ON DATA MINING
TECHNIQUES
271

between January 1
st
and March 31
st
of 2009 and it
relates to the first five days of stay of thirty two
patients.
The data collected came from three distinct
sources: the Electronic Health Record (EHR), 10
bedside monitors and paper-based nursing records.
The input variables consist of the case mix (i.e.
age, admission type and admission from) and
Critical Events (CE), derived from four physiologic
variables collected by the bedside monitors (Blood
pressure, heart rate and oxygen saturation) and urine
output, registered on the nursing records. CE was
defined by a panel of experts (Silva, 2003).
Whenever a physiological parameter is out of its
normal range for more than 10 minutes, it is
considered a CE.
The output target considered is the organ status
(normal and dysfunction/failure) of six organ
systems (cardiovascular, respiratory, coagulation,
hepatic, neurological and renal), measured by the
SOFA score and the patient’s outcome (dead or
alive).
The new requirements of the INTCare system
encompass a finer grained prediction, i.e. the
prediction for the next hour, hence the need for
hourly data. In order to accomplish that, some
adjustments were made.
The number of CE of each physiological
parameter considered was calculated hourly, for
each patient, and subsequently Accumulated Critical
Events (ACE) was derived as a new variable. The
CE were calculated with data from the bedside
monitors (which registers the patients’ vital signs at
the frequency of one minute) and from the paper-
based nursing record, in the case of CE of urine
output. The SOFA scores aren’t usually registered,
so they were calculated manually with data from the
bedside monitors and the paper-based nursing
record. Generally, SOFA is calculated once a day
and we considered the same score for each hour of
the corresponding day, except when there was data
to calculate it more than once a day. Later, it was
adapted to a binary representation, where 0 means
normality and 1 means dysfunction/failure and
comprises SOFA scores of 1,2,3,4.
Figure 1 shows the distribution of the values of
the target variables, as well as its missing values.
Noisy data (incorrect values) was manually
detected and corrected by ignoring values
considered absurd by the medical experts. This led
to an increase of missing data.
All the data considered was integrated in a
database for the construction of the final dataset for
the models’ creation, with 2614 records and 20
variables.
Figure 1: Distribution of the values for the target
variables (%).
3.2 Modelling (Feature Selection)
For the models’ creation, we had two concerns, the
first being related to the features selection and the
second, the DM techniques used.
We have explored three scenarios (M1, M2 and
M3) regarding the variables to be included in the
models, as shown below:
M1 = {Hour, Case Mix, ACE}
M2 = {Hour, Case Mix, ACE, Ratios}
M3 = {Hour, Case Mix, ACE, SOFA}
Where
Case Mix = {Age, Admission type, Admission
from}
ACE = {ACE of Blood Pressure, ACE of Oxygen
Saturation, ACE of Heart Rate, ACE of Urine
Output}
Ratios = {ACE of BP/elapsed time of stay, ACE of
SO2/elapsed time of stay, ACE of HR/elapsed time
of stay, ACE of Ur/elapsed time of stay}.
All these variables have hourly values.
By exploring these scenarios we intend to attest
the importance of new variables, other than the CE
for the prediction. The inclusion of ratios points to
the severity of the patient’s clinical evolution and its
relation to organ failure and outcome. Since multiple
organ failure is a major cause of ICU mortality
(Amaral, 2005), it is justified the inclusion of the
SOFA scores of the other organ systems.
Due to biased distribution of the target variables,
as shown in Figure 1, we transformed the variables
using the logarithmic function in order to maximize
normality and avoid overfitting.
For each one of these scenarios and for each
target variable (cardiovascular, respiratory, renal,
coagulation, liver and outcome) were applied four
DM techniques: Artificial Neural Networks (ANN),
ICEIS 2010 - 12th International Conference on Enterprise Information Systems
272

Decision Trees (DT), Regression and Ensemble
methods. These techniques have been applied before
for the next day prediction and with different data.
For the ANN, several configurations were tested
and the best results were achieved with a fully
connected Multilayer Perceptron with 3 hidden
neurons and logistic activation function. To assure
statistical significance, 30 runs were applied to all
tests.
Similarly to the ANN, for the DT, various
configurations were tested in order to achieve the
best results. The splitting method used for
partitioning the data was the Gini reduction. The
default algorithm splits a node into 2 branches and,
to avoid overfitting, the maximum number of
branches from a node was set to 10 and the splits
were evaluated as a reduction in impurity (Gini
index). The maximum depth of the tree was 6.
For the Regression, since we have binary targets,
it was applied a logistic regression. The selection
method that produced best results was the Stepwise.
The ensemble method used a combined mode of
the ANN, DT and Regression with the Mean
probability function.
It was not possible to generate models for the
neurological system due to the amount of missing
data (83%) required for calculating its SOFA score.
3.3 Results
A total of 6 (target variables) * 3 (scenarios) * 4
(DM techniques) = 72 models were generated and
tested.
We have partitioned the dataset in learning,
validation and test subsets to objectively assess the
predictive performance. The partition method is
based on a holdout of 40% for training, 30% for
validation and 30% for test.
Next, we present the results obtained for each
organ system (Tables 1 to 5) and outcome (Table 6),
in terms of Accuracy (Acc), Specificity (Spec) and
Sensibility (Sens) of each technique and scenario.
Table 1: Results of the Cardiovascular System (%).
M Technique Acc Spec Sens
1
Reg. 78.2 69.5 79.6
ANN 84.2 72.4 88.3
DT 87.6 77.5 92.4
Ens. 71.4 44.6 74.5
2
Reg. 81.4 79.8 81.7
ANN 91.9 93.7 91.3
DT 88.4 81.8 90.6
Ens. 63.3 30.2 73.3
3
Reg. 85.1 86.5 85
ANN 92.7 90.6 93.4
DT 88.6 81.6 90.9
Ens. 61.8 31.1 73.9
Table 2: Results of the Respiratory System (%).
M Technique Acc Spec Sens
1
Reg. 92 93.3 84.2
ANN 95.1 96.3 89.2
DT 95.6 79.6 87.3
Ens. 85.3 87.8 65.1
2
Reg. 92.4 94 82.7
ANN 96.1 96 96.2
DT 91.3 94.4 75
Ens. 72.9 84.9 22.8
3
Reg. 96.8 97.5 93.9
ANN 98.1 99 94.4
DT 95.8 96.1 95
Ens. 75.2 85.5 32.8
Table 3: Results of the Renal System (%).
M Technique Acc Spec Sens
1
Reg. 86.3 84.5 86.7
ANN 96.7 93.8 97.7
DT 93.2 93.4 93.1
Ens. 72.5 46.5 81.2
2
Reg. 86.1 75.2 89
ANN 95.4 87.7 98
DT 93.9 92.5 94.3
Ens. 67.9 35.2 79.7
3
Reg. 93.7 90.7 94.7
ANN 96.9 93.9 98.1
DT 95.7 92.4 96.8
Ens. 80 62.4 85.6
Table 4: Results of the Coagulation System (%).
M Technique Acc Spec Sens
1
Reg. 80.9 83.6 76.8
ANN 90.8 88.9 94.2
DT 89.1 96.2 81
Ens. 62.3 68 53.1
2
Reg. 81.6 84.6 71.2
ANN 98.1 98.5 97.5
DT 91 91.8 89.5
Ens. 56 62.6 45.6
3
Reg. 87.5 87.1 87.9
ANN 95.3 95.1 95.6
DT 92.1 96.4 86.6
Ens. 64.8 70.1 56.3
Table 5: Results of the Liver System (%).
M Technique Accuracy Specificity Sensibility
1
Reg. 80 71.2 82.3
ANN 91.7 87.7 93.1
DT 91.2 83.7 94.3
Ens. 59.5 32.1 72.7
2
Reg. 83.3 72.4 86.8
ANN 93.6 88.5 95.4
DT 93.2 88.3 95
Ens. 64.1 34.8 75.6
3
Reg. 94.3 95.4 94.1
ANN 98.2 97.6 98.3
DT 96.3 96.9 96.1
Ens. 77.8 61 85.1
HOURLY PREDICTION OF ORGAN FAILURE AND OUTCOME IN INTENSIVE CARE BASED ON DATA MINING
TECHNIQUES
273

Table 6: Results of the Outcome (%).
M Technique Acc Spec Sens
1
Reg. 88.8 83.9 90
ANN 97.3 94.6 98.3
DT 94.5 92.9 95
Ens. 65.4 34.7 81.6
2
Reg. 89.3 84.3 90.3
ANN 97.4 96 98
DT 94.5 92.5 95
Ens. 63.6 28.2 79.3
3
Reg. 91.2 87.4 92.1
ANN 97.1 95.1 97.6
DT 94.8 90.6 96.1
Ens. 63.2 31 79.6
4 DISCUSSION
For the analysis of the models’ performance, we
used confusion matrixes, a tool commonly used in
domains where the cost of incorrect classification is
high. In medicine, it is usual to use sensitivity and
specificity analysis for measuring the rates of error
(Cios, 2002). From the matrixes, three measures
were derived. Table 7 synthesises the best results for
accuracy, specificity and sensibility for each organ
system and outcome regarding the four techniques
and the three scenarios considered in the
experiments and presented in Tables 1 to 6.
Table 7: Best results of the organ systems and outcome (%).
Acc Spec Sens
Cardiovascular 92.7
ANN M3
93.7
ANN M2
93.4
ANN M3
Respiratory 98.1
ANN M3
99
ANN M3
96.2
ANN M2
Renal 96.9
ANN M3
93.3
ANN M3
98.1
ANN M3
Coagulation 98.1
ANN M2
98.5
ANN M3
97.5
ANN M2
Liver 98.2
ANN M3
97.6
ANN M3
98.3
ANN M3
Outcome 97.4
ANN M2
95.1
ANN M3
98.3
ANN M1
As shown in Table 7, and in a global
appreciation, it is notorious the distinction of the
ANN as the technique with best results for the three
metrics and M3 as the scenario with the most
number of best results, followed by M2. However,
as shown in Tables 2 to 6 and Figures 2 to 7, the DT
has a high performance as well. The ensembles show
a very poor performance, whose curves relate to a
random classifier, as shown in Figures 2 to 7.
In the context of clinical decision, for the organ
systems prediction and considering that 0 is the
normality and 1 is the dysfunction/failure, the
assessment must be in favour of sensibility, as it
measures the proportion of positives that are
correctly identified. The same principle was applied
for the prediction of the outcome. Thus, Table 8
presents the best results for the prediction of the
organ systems and outcome and the corresponding
techniques and scenario, in terms of sensibility.
Table 8: Sensibility for the organ systems and outcome (%).
System Technique Scenario Sensibility
Cardiovascular ANN M3 93.4
Respiratory ANN M2 96.2
Renal ANN M3 98.1
Coagulation ANN M2 97.5
Liver ANN M3 98.3
Outcome ANN M1 98.3
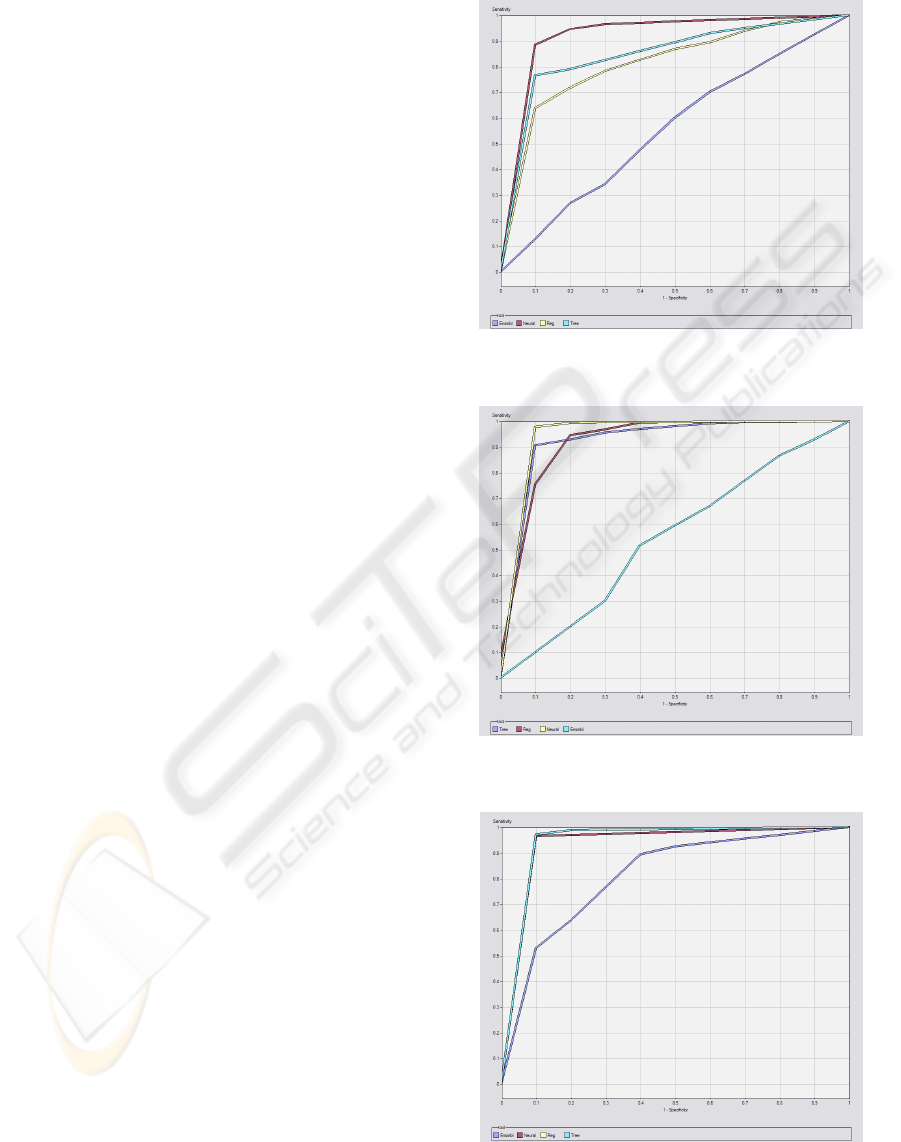
In the appendix are represented the ROC curves
for target 1 (dysfunction/failure and death) of the
bests models in terms of sensibility for the 5 organ
systems and outcome. ROC curves are frequently
used in the medical area to evaluate computational
models for decision support, diagnosis and prognosis
(Lasco, 2005). They measure the degree of
discrimination that can be obtained from a given
model and they establish the relation between
specificity and sensibility of a classifier.
As shown in Figures 2 to 7, it is confirmed the
emphasis of the ANN. Nevertheless, for the
respiratory, renal and liver systems (Figures 3, 4, 6),
the DT and regression have a close performance to
the ANN.
From Figures 2 to 7 it is also notorious the poor
performance of the ensemble methods, which point
to random classifiers, except for the renal and liver
systems, whose performance is slightly better, but
nonetheless poor.
With these experiments, it is confirmed the
importance of the inclusion of CE in organ failure
prediction. However, the inclusion of new variables
such as the ratios and SOFA scores of other organ
systems generated models with better results. Half of
the best models (Cardiovascular, Renal and Liver)
are related to the third scenario, hence it is justified
the new approach of including the SOFA score of
the other systems, as well as the ratios.
For the outcome prediction, the best models were
achieved with the first scenario, which only includes
the CE as input variables.
ICEIS 2010 - 12th International Conference on Enterprise Information Systems
274

5 CONCLUSIONS
AND FURTHER WORK
Currently, in the ICU environment, the decision
making is based on severity scores like SOFA and in
the intensivists’ empirical experience. However, this
process has some limitations. It is based on
probabilistic scores and doesn’t take into account
import information that might be hidden regarding
the patient’s clinical status and its evolution (e.g.
bedside monitored physiological parameters).
Research has evolved towards the inclusion of
new variables and DM techniques in order to predict
organ dysfunction/failure and outcome.
This paper presented new DM models for the
INTCare system, with data gathered in real-time at
the ICU of HGSA, in Porto, Portugal. The
techniques tested have been used before in the
research of the INTCare. The novelty of this
approach relies on the use of real-time data and a
finer grained prediction, i.e. the prediction of organ
failure and outcome for the next hour. Moreover,
new variables were used for the models generation
(e.g. racios). The experiments carried out focused on
finding the best combination of techniques and
features selection. For each technique, several
configurations were tested in order to achieve the
best results possible.
In this paper, we have proven that it is possible
to use online and real-time data to generate highly
accurate models, which is a great advance in the
context of a situated intelligent decision support
system like INTCare. The main goal in ICU is to
avoid or reverse organ failure. We expect that, with
an hourly prediction of the patients’ clinical status, it
will be possible for intensivists to have a timely
intervention so that worst complications may be
avoided.
As pointed in Section 3, the data used came from
three sources, including a paper-based nursing
record. However, we are developing an ENR that
collects hourly and in real-time all the necessary
data to feed the DM models (Santos, 2009).
These models must be tested in the ICU with
new data in real-time and new models will be
generated in order to try to achieve the best results
possible.
Advances in the prediction of organ failure and
outcome might include the development of new
strategies presented in this paper regarding the
features selection (e.g., the inclusion of new
variables like the SOFA score of the other systems,
and ratios). Moreover, it should be pointed that the
effort was put into the prediction of each organ
system individually and not the systems altogether.
Hence, it is expected that different systems have
different variables and techniques for their
prediction.
Although we have achieved very good results, it
should be stressed out that the dataset used was a
small population of patients. We believe that it will
be possible to maintain a good degree of prediction
because it is known that clinical data is very stable
(Silva, 2007).
The next step is the deployment of the models
and the analysis of their impact on the ICU
environment.
REFERENCES
Abelha, A., Machado, J., Alves, V., Neves, J., 2004. Data
warehousing through multi-agent systems in the
medical arena. In 1st international Conference on
Knowledge Engineering and Decision Support. Porto,
Portugal.
Amaral, A.C., Andrade, F.M., Moreno, R., 2005. Use of
the Sequential Organ Failure Assessment score as a
severity score. In Intensive Care Med, 31, pp. 243-249.
Bellazzi, R., Zupan, B., 2008. Predictive Data Mining in
clinical medicine: current issues. In Int J Med Inform,
pp. 81-97.
Cios, K., Moore, G., 2002. Uniqueness of medical data
mining. In Artificial Intelligence in Medicine 26, 1–24.
Fayyad, U., 1998. Mining databases: Towards algorithms
for knowledge discovery. In IEEE Data Eng. Bull., pp.
39-48.
Fayyad, U., Piatetsky-Shapiro, G., Smyth, P., 1996. The
KDD process for extracting useful knowledge from
volumes of data. In Communications of the ACM, 39,
pp. 27-34.
Gago, P., Santos, M. F., 2008. Towards an intelligent
decision support system for intensive care units. In
The 18th european conference on artificial
intelligence.
Gago, P., Santos, M. F., Silva, Á., Neves, J., Gomes, L.,
2006. INTCare: A knowledge discovery based
intelligent decision support system for intensive care
medicine: an overview. In Journal of decision
systems, pp. 241-259.
Lasco, T., Bhagwat, J., Zou, K., Ohno-Machado, L., 2005.
The use of receiver operating characteristic curves in
biomedical informatics. In J. of Biomedical
Informatics, 38(5):404–415.
Le Gall, J., 2005. The use of severity scores in the
intensive care unit. In Intens Care Med 2005;31:1618-
23.
Miranda, R., 1998. The effect of harmonizing and
standardizing the nursing tasks on intensive care units
of the European Community, second European
intensive care unit study (EURICUS-II). In Technical
report BMH4-CT96-0817, Health services research
unit – Groningen university hospital, The Netherlands.
HOURLY PREDICTION OF ORGAN FAILURE AND OUTCOME IN INTENSIVE CARE BASED ON DATA MINING
TECHNIQUES
275
Patel, V., Shortliffe, E., Szolovits, P., 2008. The coming of
age of artificial intelligence in medicine. In Artif Intell
Med.
Ramon, J., Fierens, D., Guiza, F., Meyfroidt, G., Blockeel,
H., Bruynooghe, M., Berghe, G., 2007. Mining data
from intensive care patients. In Advanced Engineering
Informatics, Elsevier Science Publishers, pp. 243-256.
Rosenberg, A.L, 2002. Recent innovations in the intensive
care unit risk-prediction models. In Current Opinion
in Critical Care, 8, pp. 321-330.
Santos, M.F., 2006. Intelligent decision support in
Intensive Care Medicine. In 2nd International
Conference on Knowledge Engineering and Decision
Support, Lisbon, Portugal, pp. 401-405.
Santos, M.F., Portela, F., Vilas-Boas, M., Machado, J.,
Abelha, A., Neves, J., 2009. Intelligent Decision
Support in Intensive Care Units – Nursing Information
Requirements. In Book Chapter on Applied
Informatics and Communications (AIC’09).
Silva, Á., 2007. Modelos de inteligência artificial na
análise da monitorização de eventos clínicos adversos,
disfunção/falência de órgãos e prognóstico do doente
crítico. Porto. In Tese de doutoramento.
Silva, Á., Cortez, A., Santos, M.F., Gomes, L., Neves, J.,
2008. Rating organ failure via adverse events using
Data Mining in the intensive care unit. In Artificial
intelligence in medicine, pp. 179-193.
Silva, Á., Cortez, P., Santos, M.F., Gomes, L., Neves, J.,
2006. Mortality assessment in intensive care units via
adverse events using artificial neural networks. In
Artificial Intelligence in Medicine, pp. 223-234.
Silva, Á., Santos, P., Gomes, L., Neves, J., 2003. Organ
failure diagnosis by artificial neural networks. In Third
IASTED International Conference on Artificial
Intelligence and Applications. Málaga.
Toma, T., Abu-Hanna, A., Bosman, R., 2008. Discovery
and integration of univariate patterns from daily
individual organ-failure scores for intensive care
mortality prediction. In Artificial Intelligence in
Medicine, pp. 47-70.
Vincent, J., Moreno, R., Takala, J., Willastss, S.,
Mendonca, A., Bruining, H., 1996. The SOFA
(Sepsis-related Organ Failure Assessment) score to
describe organ organ dysfunction/failure. In Intens
Care Med 1996;22:707-10.
APPENDIX
Figure 2: ROC curve of the Cardiovascular system for
target 1 (dysfunction/failure) of M3.
Figure 3: ROC curve of the Respiratory system for target 1
(dysfunction/failure) of M2.
Figure 4: ROC curve of the Renal system for target 1
(dysfunction/failure) of M3.
ICEIS 2010 - 12th International Conference on Enterprise Information Systems
276
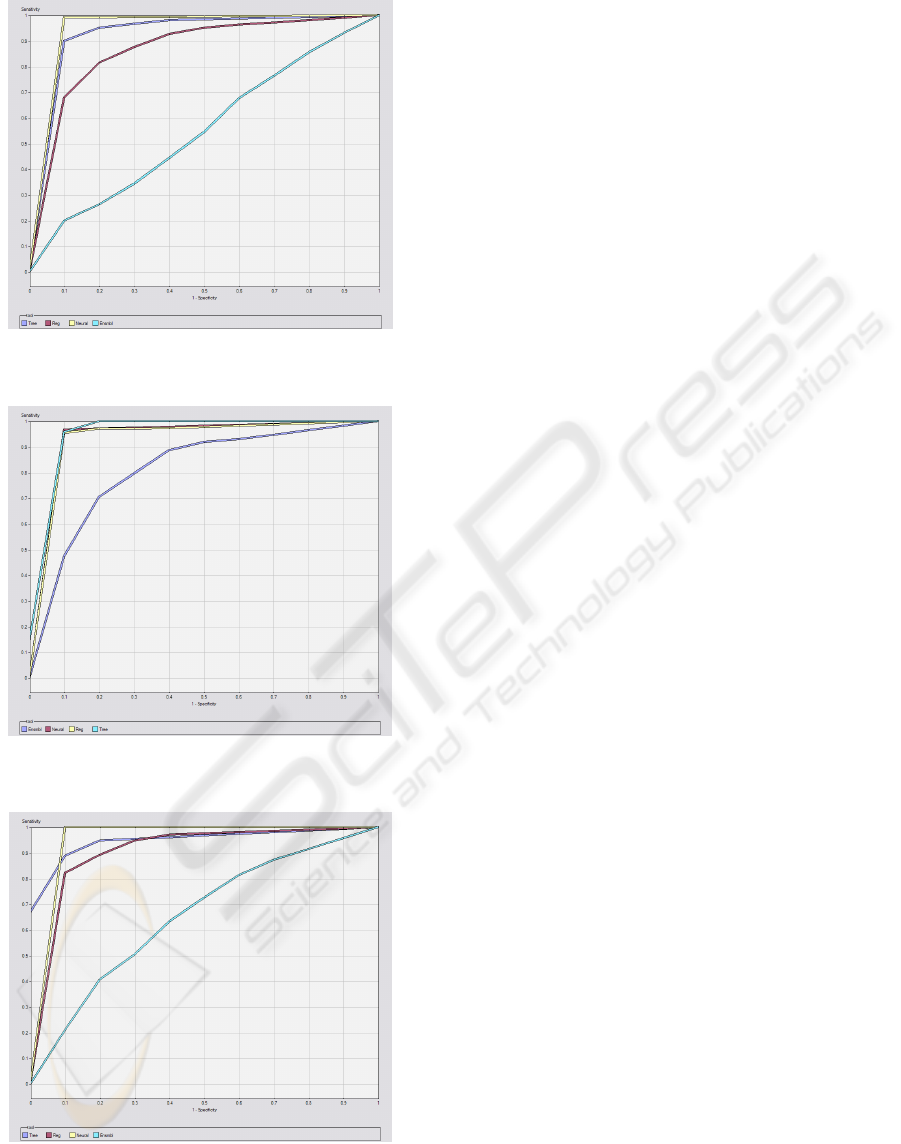
Figure 5: ROC curve of the Coagulation system for target
1 (dysfunction/failure) of M2.
Figure 6: ROC curve of the Liver system for target 1
(dysfunction/failure) of M3.
Figure 7 - ROC curve of the Outcome for target 1 (dead)
of M1.
HOURLY PREDICTION OF ORGAN FAILURE AND OUTCOME IN INTENSIVE CARE BASED ON DATA MINING
TECHNIQUES
277
