
A SOFTWARE SYSTEM FOR DATA INTEGRATION
AND DECISION SUPPORT FOR EVALUATION
OF AIR POLLUTION HEALTH IMPACT
Daniele Toscani
2
, Federica Bargna
1
, Luigi Quarenghi
1
, Francesco Archetti
1,2
and Ilaria Giordani
2
1
DISCO, Department of Informatics, Systems and Communications
University of Milano Bicocca, Viale Sarca 336, Milano, Italy
2
Consorzio Milano Ricerche, Via Cozzi 53, Milano, Italy
Keywords: Data Integration, Forecast, Health-environment Correlation.
Abstract: In this paper we present a software system for decision support (DSS – Decision Support System) aimed at
forecasting high demand of admission on health care structures due to environmental pollution. The
algorithmic kernel of the system is based on machine learning, the software architecture is such that both
persistent and sensor data are integrated through a data integration infrastructure. Given the actual
concentration of different pollutants, measured by a network of sensors, the DSS allows forecasting the
demand of hospital admissions for acute diseases in the next 1 to 6 days. We tested our system on cardio-
vascular and respiratory diseases in the area of Milan.
1 INTRODUCTION
The evaluation of the quality of the environment is
important for health impact assessment, which in
turn is crucial for taking actions for protecting the
public health. Many epidemiological studies have
shown that acute or chronic health effects can be
associated with high concentrations of environment
pollutants. This paper stems from the research
project LENVIS (Localised ENVironmental and
health Information Services for all) aimed at
designing a Decision Support System (DSS) based on
statistical learning. The main aim of the project is to
leverage on-line environmental monitoring into
alerts during episodic pollution events, in order to
inform people of the current environmental situation,
give warnings to health care providers about peaks
in requests of hospitalization, support public
authorities in deciding which actions have to be
carried out (e.g. prevent risks by reducing excess
pollution and minimizing exposure, prepare
hospitals to peaks of emergency admissions).
A number of techniques have been developed for
the prediction of pollutant concentrations (Gokhale
and Raokhande 2008) (Perez and Salini 2008) or
health indicators (Dong et al., 2009). The most
interesting and closest to our approach in its
objectives is (Wall and Li 2009), in which monthly
counts of medical visits for persons identified to
have alcoholism problems are modeled using two-
state hidden Markov models.
As far as the health data modelling is concerned,
typical studies rely on epidemiological approaches
(Lanki et al. 2006) (Zanobetti et al. 2009) and builds
on existing modelling technologies like GAM
(Generalized Additive Modelling) (Chan et al.
2009), regressions and statistics (Bellini et al. 2007).
We develop an original approach linking directly
environmental and hospitalization data. A future
evolution and exploitation of our system could
include any model in the same way defined by the
architecture, among the models which are actually
integrated. Another reason for our approach to be
driven by real hospitalization data is that the
complex relationship between health and the
environment limits the availability of causative
evidence and that a data driven model is both
simpler and of a more general application.
As far as the data integration task is concerned,
we develop a data integration infrastructure suitable
for the online access to multiple, distributed and
heterogeneous data sources, which is unique in the
state of the art of health modelling systems.
Essentially, forecasting approaches can be
grouped in empirical models, fuzzy logic based
systems, data driven statistical models and model-
284
Toscani D., Bargna F., Quarenghi L., Archetti F. and Giordani I. (2010).
A SOFTWARE SYSTEM FOR DATA INTEGRATION AND DECISION SUPPORT FOR EVALUATION OF AIR POLLUTION HEALTH IMPACT.
In Proceedings of the 12th International Conference on Enterprise Information Systems - Artificial Intelligence and Decision Support Systems, pages
284-290
Copyright
c
SciTePress

driven statistical learning methods. These last
methods, in particular State space models and
Bayesian Networks, appears as the most interesting,
since the “learning from data” and the probabilistic
links among quantities make them able to exploit
patterns and relations that cannot be explicitly
handled by fuzzy logic systems.
Statistical analysis of time series, like Multiple
Linear Regression (MLR), is based on local
information and assumes stationarity, or weak
stationarity, of the data. Analyzing health data,
asymmetries between growth and decline periods are
underlined and it is often difficult to distinguish
between long-term trends and noise. As result, a
forecasting model is valid only for a short period.
For that reasons it’s particularly interesting a class of
probabilistic state space models: the Autoregressive
HMM (AHMM) (Messina and Toscani 2008). This is
a class of the Hidden Markov Model (HMM), a set of
models widely applied in several fields (Dong et al.
2006) which assumes that an observation depends on
the current state and also on the previous p values.
The two main contributions of this paper are: (1)
a data access and integration component in order to
have a “stream reasoning capability” for DSS; (2) a
new algorithm for forecasting the numbers of
hospitalizations .
2 SYSTEM ARCHITECTURE
The objective of our system is to provide a tool to
evaluate the impact of current pollution on the health
status of the population, measured by the forecast of
number of hospitalization requests due to
environmental pollution, to deliver information to
e.g. public authorities and hospital managers.
Queries to the system can be formulated in the
structured format defined by the Data Access
Component (DAC), which represents the core of the
system. Results are produced as streams of
structured objects (DataObject) and provided
through both Lenvis Data Services (i.e. web services
defined for the exchange of data inside the Lenvis
platform) and Presentation and User Interaction
(e.g. the Service Oriented Business Intelligence
(SOBI) functionalities for user interaction, query
submission and graphical results presentation).
Two principal use cases can be defined: the
Calculation of health indicators, like statistical and
descriptive indicators of the impact of pollution on
the number of hospitalizations, and Forecast of
health impact, i.e. given the actual concentration of
pollutants and their forecast we produce a forecast of
the number of hospitalizations for the next 1 to 6
days. In this paper we address only this second case.
Figure 1 depicts the main components of the
system, grouped in four layers; the Data Layer
contains the external data sources, from which are
extracted the data to reply to queries, i.e. data stored
in data bases or coming from Lenvis services.
Integration Layer, represented by the DAC,
performs the operations of query interpretation, data
sources querying and orchestration, data integration
and preparation of queries replies. The third level,
the Analysis Layer, includes the computational
components, which produce the online data to reply
to complex queries (e.g. forecast). Finally, the
Application Layer is the level at which users can
submit queries and obtain the results. It includes the
interactions with the users through Lenvis Data
Services (web services) and the Presentation and
User Interaction, through the Service Oriented
Business Intelligence tools.
The system is implemented in Java and part of
the computational engine in Matlab. External
applications and user interfaces control the DSS and
collect the outputs through Java web services and
Java API (Application Programming Interfaces).
Figure 1: System architecture.
2.1 Data Layer
Pollution Concentration (from sensors)
We consider as environmental data in our case study
the concentrations of air pollutants in the city of
Milan. The network of air pollution monitoring
stations, in operation since 80s, counts 9 monitoring
stations, spread in all the city. Each station is
equipped with a variable number of sensors, for a
total of 37 sensors in the whole town. Each sensor
measures the concentration (in µg/m
3
) of one
among: benzene, nitrogen dioxide, sulphur dioxide,
carbon monoxide, nitrogen oxide, total nitrogen
A SOFTWARE SYSTEM FOR DATA INTEGRATION AND DECISION SUPPORT FOR EVALUATION OF AIR
POLLUTION HEALTH IMPACT
285

oxide, ozone, PM10 (Particulate Matter), PM2.5,
TSP (Total Suspended Particulate). The station
calculates every hour the mean of pollutant
concentration and sends it to a control centre, where
the data are manually validated to filter outliers and
further aggregated to obtain a daily measure.
These data are publicly available at the web site
of the environment protection agency of the
Lombardy region (ARPA Lombardia); they can be
downloaded as CSV files at the url:
www.arpalombardia.it/qaria/doc_RichiestaDati.asp.
Most of the data are available from the 80s-90s, but
for many stations they are available only after year
2000, in one case from 2007.
The series of data contains missing values, since
some stations have been under maintenance for
months or have been switched off. In building our
decision models we selected the time series with less
missing values, since not all the data series could be
analyzed together for long time periods. The data
have been downloaded and imported into a CSV file.
Pollution Concentration (from Lenvis services)
In Lenvis are developed a set of services that given
the actual concentration of air pollutants, weather
conditions and geographical locations of the emission
sources allows forecasting the pollution
concentrations in a given area for the next days. The
data produced by these services are used by our
system as soft sensors, i.e. virtual sensors that
produce data for the future. Based on this data, we
can provide health impact forecast for a longer period.
Admission Data
The health indicator that we address is the daily
number of hospitalizations in the city of Milan for
two principal classes of disease that can be related to
air pollution: respiratory (asthma) and cardio
vascular (myocardial infarction, ischemic heart and
deep vein thrombosis). In these data each patient is
characterized by his associated ID and his diagnosis.
The number of hospitalizations for each pathology
are collected by the local government of the
Lombardy region and published on
http://www.aleeao.it/. For the setup and tuning of
health models we obtained specific data from two
important general hospitals accredited by the
National Health Service, one with general audience
and one with focus on geriatrics patients. These two
hospitals have provided a small quantity of very
detailed data, including also ages of the patients, sex,
detailed diagnosis, which allows to perform class-
specific analysis (for e.g. age classes). Data have
been downloaded and imported into a CSV file.
2.2 Integration Layer
Input data are collected through web services and
local databases. The DAC is a software component
that provides integrated access to multiple,
heterogeneous and distributed data sources. Its
functionalities are: object-oriented representation of
the domain data through a meta-model definition of
the types of data supported; submission of structured
queries; return of the query result as a searchable
and navigable data structure. It allows executing
cross-source queries on temporal, spatial and logical
intervals, supporting data analysis and presentation
activities. Each query, despite the traditional SQL
syntax, specifies a target but not the data sources
from which to extract the data.
The platform defines the data types that the data
sources can provide. Each data type is a structured
object, containing multiple fields (e.g. for a sensor
reading, the source of the data, the value collected,
the timestamp to which it refers etc.) and it is linked
to other data types through hierarchical relations.
Each query also specifies the constraints on results
(temporal intervals, values of some attributes…).
This querying mechanism hides the
heterogeneity and distribution of the data sources.
Moreover, it is responsibility of the DAC to identify,
select and query all the sources needed to reply to
user requests and also to prepare and present the
output in the common format. A fundamental feature
is the possibility to reply to queries not only
accessing to persistent data but also using streaming
data produced online by sensors (e.g. sensor
networks) or by the models which perform online
inference (forecast).
The main components of the DAC are: the query
processor that takes as input a complex query
formulated by the user and produces a set of simpler
queries, each of which can be satisfied by a single
wrapper. The query processor analyzes also the final
conditions that have to be satisfied before to return to
the user the results produced by the Data Aggregator.
The Wrapper component is able to manage wrappers
belong to different classes; each class is specific for a
type of data source (relational database, web service,
text file...). A wrapper processes a simple query, it is
connected to a data source and extracts from it the
data needed to reply to the query, implementing
specific protocols of the source. Finally, Data
aggregator component merges the partial results
produced by different wrappers. Analogously to
relational databases, this merging can consist in set
union or join.
ICEIS 2010 - 12th International Conference on Enterprise Information Systems
286

2.3 Analysis Layer
At this layer are deployed the data analysis
components of our system, which forecast the
number of hospitalization in the next days through
Autoregressive Hidden Markov Models and
Multiple Linear Regression (see Sect. 3). An
innovation aspect of the DAC is that for each class
of computational components is defined a Wrapper,
in the DAC format, which allows to query the
components and extract data to reply to user’s
queries. An example of query is the request for the
number of hospitalization from the whole week,
being on Friday. The reply to this query involves the
extraction of historical data (from Monday to
Friday) from the Admission Database, while the
forecast for Saturday and Sunday is produced online,
merged with the historical data and presented to the
user through e.g. a graphical histogram (see sect. 2.4).
2.4 Application Layer
In this layer are included the components for the
interaction between users and the DAC, meaning
“user” as both human users and external
applications. The Presentation and User Interaction
set of modules includes the Service Oriented
Business Application that, based on the DAC for the
extraction and production of data, are responsible to
collect user queries and present results through
graphs and tables in the web interface of the Lenvis
Portal.
The other paradigm for the interaction with the
DAC are the Lenvis Data Services, web services that
expose the DAC functionalities for querying and
data extraction, which can be easily integrated in
external applications.
3 COMPUTATIONAL ENGINE
The algorithmic core of our system is the forecasting
engine of the analysis layer. While the literature
shows mostly the application of regression models,
which we used as benchmarks in our experiments,
the authors feel that the dynamic of the target
process is better captured by probabilistic state-
space models, namely Hidden Markov Models
(HMM) (Rabiner 1989). When data are generated by
a process that we cannot directly observe, or is too
complex, HMM allows ignoring or partially simplify
its nature, focusing the attention on the data
generation process, which is indeed our final
objective.
A HMM is a stochastic process whose evolution
is governed by a Markov Chain whose state variable
can assume a finite number of values s
j
, j=1,2,..,N,
which are often called states and cannot been
directly observed. Each s
j
corresponds to one of the
possible “conditions” in which the process can be.
The model is characterized by a probability
distribution for the initial value of the state π(s
j
), a
set of state transition probabilities A whose elements
a
ij
=P(s
j
|s
i
) measure the probability of being in state
s
i
at time t and s
j
at t+1. We apply Autoregressive
HMM (AHMM), a class of HMM which assumes
that an observation depends on the current state and
also on the previous p values. The formulation of the
model is completed by a set B of Probability Density
Functions (PDF) which describe the generation
(emission) of the observed values in each state.
The observation o
t
at time t is generated by s
j
according to:
o
t
=b
j
(O) = P(o
t
|s
j
,o
t-1
..o
t-p
) (1)
K subsequent observations are grouped in
vectors, which define an autoregression process of
order p:
Kkeoro
p
i
kikik
,..,2,1 ,
1
(2)
Where e
k
is a Gaussian noise component, with
zero mean and variance σ
2
, and r
i
(i=1,2,..,p) are the
autoregression coefficients. Note that, the PDF of
the observed variable O for state s
j
is a mixture of M
components:
M
m
M
jmjmjmjmj
ccObcOb
1 1m
0 , 1 ),()(
(3)
Where c
jm
are a set of weight, whose sum is 1,
and b
jm
(O) is the observation density for state j and
m
th
mixture component, computed as follows:
jm
K
jm
rO
K
K
Ob ,
2
exp
2
)(
2/
(4)
where:
p
i
rrjm
iRiRRRrO
jm
jm
1
)()(2)0()0(),(
(5)
1
0
1,
)(
p
n
njmjmnr
rriR
jm
(r
jm0
=1), 1≤i≤p (6)
1
0
1
)(
iK
n
nn
ooiR
, 0≤i≤p (7)
r
jmn
is the autoregression coefficient for state j,
mixture component m and element n of the
autoregression process. R
jm
(i) is the autocorrelation
of the autoregression coefficients for state j and
mixture component m and R(i) is the autocorrelation
of the observations.
The model is fully characterized by the set of
parameters λ=[π(s
j
),a
ij
,r
jmn
,R(i)], which have been
A SOFTWARE SYSTEM FOR DATA INTEGRATION AND DECISION SUPPORT FOR EVALUATION OF AIR
POLLUTION HEALTH IMPACT
287

estimated using the customized version of the Baum-
Welch algorithm described in (Messina and Toscani,
2008).
Since there is no analytical process to estimate
the optimal order p of the autoregression process,
given a sequence of T training values v
1
..v
T
, we
estimate multiple autoregression processes θ
p
for
different p by maximizing the conditional
distribution
pT
vvf
|..
1
, i.e. their likelihood (MLE
- Maximum Likelihood Estimation). Then, we select
the optimal p through the AIC (Akaike Information
Criterion) (Akaike, 1973). The initialization of
autoregression parameters is performed by analyzing
the relationship between autoregression parameters
and the autocorrelation function of the observed data
by solving a system of Yule-Walker equations
(Tsay, 2005).
The formulation of AHMM described here can
deal only with uni-variate series. To manipulate
multiple pollutants and health indicators at the same
time we use multiple models, one for each series, as
in (Messina and Toscani, 2008). We capture the
relations among series by estimating the Cholesky
decomposition R
D
of their correlation matrix (Russel
and Norvig, 2002).
The generation of data is as follows: each
AHMM is applied to sample T data. For each time
t=1,2,..,T we produce a vector of forecast (one value
for each series): given the current state s
t
we sample
the next state s
t+1
according to the state transition
probability and the observation o
t
from the
distribution b
j
(O). Finally, as in (Hoyland et al.,
2003), we restore the correlations among series by
multiplying the forecasts at the same time by R
D
.
4 CASE STUDY: MILAN AREA
We selected as case study the air pollution in the
metropolitan area of Milan, which is the Italian area
with the highest population (10
th
in Europe), very
high population density and it is affected by air
stagnation; all these conditions have brought to
considerable air pollution problems. This represents
the ideal test bed for our DSS, since we can observe
a high number of pollution peaks.
We collect through the DAC the environmental
data and health indicators. For each series, we obtain
a scale-free summary of changes in the data during
time by calculating the log-variation among two
consecutive values v
t-1
and v
t
, i.e. log(v
t
/v
t-1
). Log-
variations are the observations o
t
for our AHMM.
We grouped pollutants into three classes of
homogeneous substances; for each class we selected
a representative series, resulting in 9 triples of series
whose mutual correlation coefficient is <0.8. Each
triple has been used to predict cardio-vascular
admissions and, separately, respiratory ones. The
resulting configurations of the experiments
(E1..E18) are detailed in Table 1.
We analyzed series of about 3000 values. We
determined experimentally the optimal structure of
the AHMM, which achieves highest model
likelihood with respect to training data, having 2
states, 5 mixture components and an autoregression
process with order variable from 2 to 5.
In each experiment we trained the model on a
sliding window of 500 observations and we forecast
the number of hospitalizations from 1 to 6 days. For
each series we measure the performance by
calculating the Mean Absolute Percentage Error
(MAPE) between the real number of hospitalizations
and the forecast produced by AHMM.
In order to assess the model reliability, the
forecast is repeated 6 times for each model. We
present the results in terms of global MAPE,
calculated as mean of all the test executed with the
same series.
For evaluating the performance of our
forecasting model we used as benchmark the
Multiple Linear Regression (MLR) (Montgomery et
al., 2006), a multivariate statistical technique widely
used to capture the linear correlations between some
predictor variables v
1
..v
L-1
(i.e. concentrations of
pollutants) and a single dependent variable v
L
(response variable, i.e. health indicator).
Table 1: Configuration of data series in each experiment.
Pollutants
Experiment / Pathology
Nitrogen oxides, Sulfur dioxide, PM 10
E1 Card., E2 Resp.
Nitrogen oxides, Ozone, PM10
E3 Card., E4 Resp.
Nitrogen oxides, Carbon monoxide, PM 10
E5 Card., E6 Resp.
Nitrogen oxides, Benzene, PM10
E7 Card., E8 Resp.
Nitrogen dioxide, Sulphur dioxide, Benzene
E9 Card., E10 Resp.
Nitrogen dioxide, Sulphur dioxide, Total PM
E11 Card., E12 Resp.
Nitrogen monoxide, Ozone, Total PM
E13 Card., E14 Resp.
Sulphur dioxide, Ozone, Carbon monoxide
E15 Card., E16 Resp.
Ozone, Total PM, PM10
E17 Card., E18 Resp.
4.1 Experimental Results
The results from the high number of computational
experiments shows that AHMM achieve lower
average error on forecast than MLR. This can be
interpreted as indicator of the benefits introduced by
the application of state-space probabilistic modelling
which, despite regression models, has the ability of
better capture the variability in data patterns. In the
DSS, the measurement of the forecast error can help
the user in selecting the “best” mix of pollutants, i.e.
ICEIS 2010 - 12th International Conference on Enterprise Information Systems
288

the set of sensors whose monitoring can give the
lower error in forecast and hence the best advice on
health indicators.
Fig. 3 and Fig. 4 show the results on cardio-
vascular diseases; experiments for AHMM are
labelled with “H”, for MLR with “R”. Each
experiment is constituted by multiple tests; for each
experiment we report the overall minimum,
maximum and average value of MAPE obtained in
the tests. AHMM achieves a mean value from 7.424
to 19.64, while the best result for MLR is 15.86.
While MLR achieves a relatively high error,
which is approximately constant in all the
experiments, the result for AHMM vary depending
on the experiment. This variation can be explained
by the nature of the learning process of AHMM. In
fact, while MLR is a deterministic model, which can
be trained on a small quantity of data, training
procedures for AHMM are non deterministic
optimization techniques; the quality of the resulting
model depends on the reaching of the local maxima
and, definitively, on the nature of data.
The performance of AHMM can be improved by
executing multiple times the learning process and
selecting the maximum likelihood model, or even
changing the structure of the model and the quantity
of data.
Another remarkable feature of AHMM is that in
most experiments the maximum and minimum value
for MAPE in different tests is very close to the
mean; this shows the robustness of the approach,
which demonstrates that the low error can be
achieved in different conditions.
Fig. 5 and Fig. 6 show the MAPE in forecast
respiratory diseases. As for cardio-vascular, in most
cases the MAPE for AHMM is lower than for MLR,
ranging from 7.505 to 23.84 for AHMM and from
19.56 to 21.01 for MLR. The variation among
maximum and minimum MAPE in the test for each
experiment is generally lower for AHMM, showing
as in the previous case that this model can provide
more stable results.
Figure 2: MAPE of experiments E1..E9 on cardio-vascular
diseases.
5 CONCLUSIONS
In this paper we present a software architecture for
the collection and integration of historical and
streaming data from multiple sources, which
includes also as data data analysis algorithms as
providers. We apply our system to the evaluation of
health impact of air pollution on the number of
hospitalization through Autoregressive Hidden
Markov Models. In particular, given the
measurements of the concentration of some
pollutants in a given time period, the objective is to
forecast the number of hospitalizations for acute
cases of the related pathologies (of the cardio-
vascular and respiratory systems).
We compare AHMM with traditional regression
methods, showing that the probabilistic modelling
achieves a lower forecasting error.
Our results have obtained appreciation and interest,
expressed by researchers of European universities in
the area of environment, computer science and
health, and also by the medical staff of public
hospitals. The type of environmental and health
information that is typically available to them is
related to epidemiological statistics, while the short
term link between environment and health has not
been exploited yet. In fact, information is sometimes
available on dedicated web sites, but in many case
specialized papers and journals are the only source
of information.
0.00
5.00
10.00
15.00
20.00
25.00
30.00
35.00
Max
27.88
14.31
27.50
12.68
24.00
9.76
26.82
22.08
Min
11.51
7.28
12.19
8.99
11.87
4.22
11.83
11.54
Mean
18.10
10.95
18.28
10.65
16.47
7.42
18.05
16.49
E11R
E11H
E13R
E13H
E15R
E15H
E17R
E17H
Figure 3: MAPE of experiments E11..E17 on cardio-
vascular diseases.
A SOFTWARE SYSTEM FOR DATA INTEGRATION AND DECISION SUPPORT FOR EVALUATION OF AIR
POLLUTION HEALTH IMPACT
289
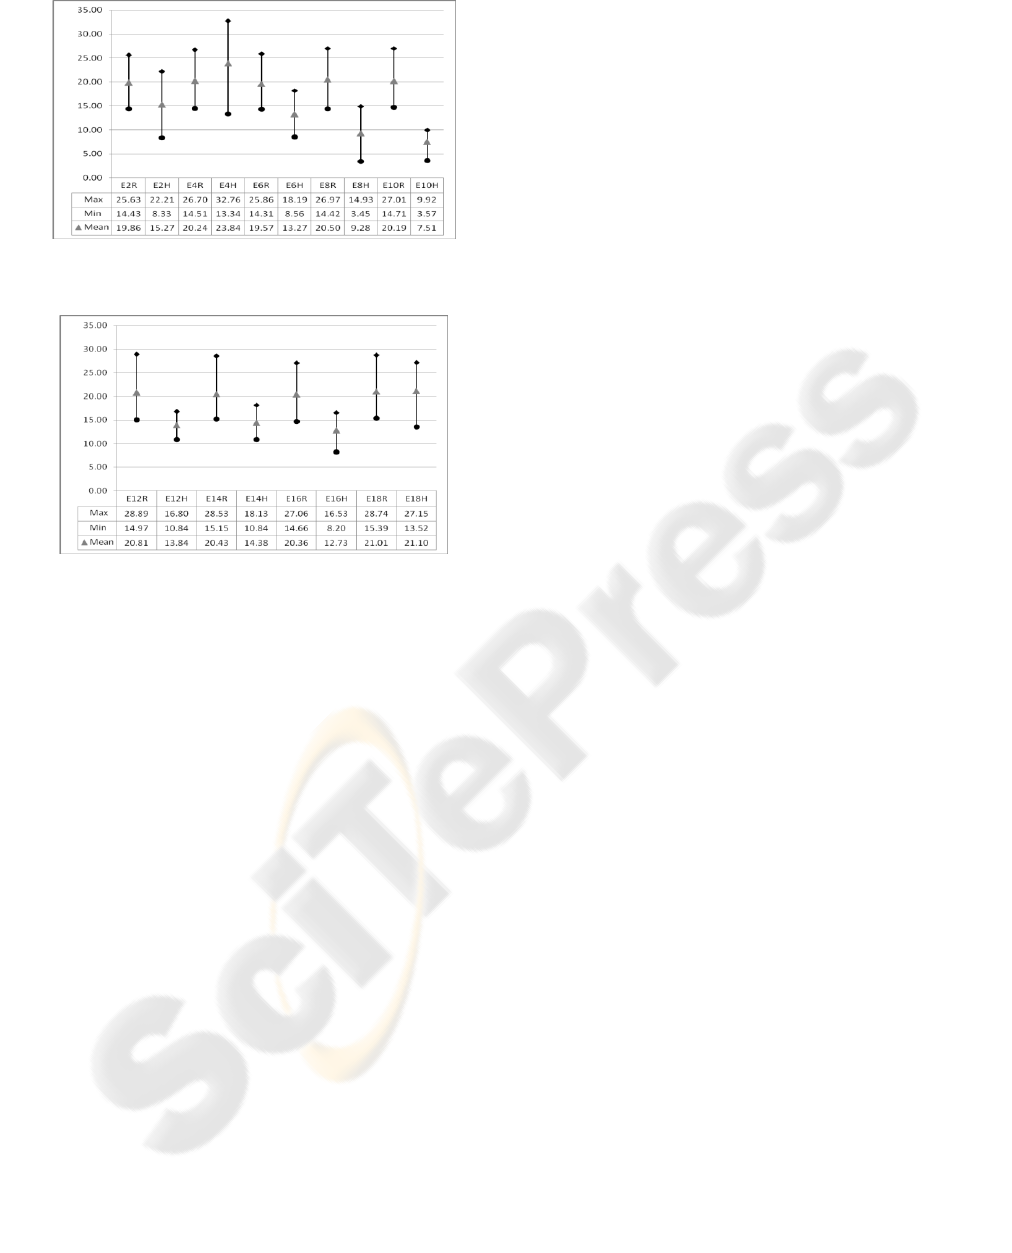
Figure 4: MAPE of experiments E2..E10 on respiratory
diseases.
Figure 5: MAPE of experiments E12..E18 on respiratory
diseases.
The substantial innovation of this paper is to provide
an automatic system that allows to have
continuously updated forecasts about the demand
for health services, i.e. hospitalizations and
emergency accesses.
Our work is still in progress: the links with
experts in environment and health are supporting us
in understanding the data, choosing the models and
interpreting results. Further analysis has to be
performed in order to expand the possibilities of data
integration and the robustness of the software
components of the computational engine. We are
actually expanding the application field of our DSS
to water pollution, to monitor pathologies of the
digestive system, skin and subcutaneous tissue.
REFERENCES
Akaike, H., (1973) "Information theory and an extension
of the maximum likelihood principle" Proc. 2nd
International Symposium on Information Theory,
267-281.
Bellini, P., Baccini, M., Biggeri, A., Terracini, B. (2007)
"The meta-analysis of the Italian studies on short-term
effects of air pollution (MISA): old and new issues on
the interpretation of the statistical evidences",
Environmetrics 18: 219–229.
Chan, T.-C.,Chen, M.-L.,Lin, I-F., Lee, C.-H., Ching, P.-
H., Wang, D.-W., Chuang J.-H. (2009)
"Spatiotemporal analysis of air pollution and asthma
patient visits in Taipei, Taiwan", International Journal
of Health Geographics, 8:26.
Dong, M., Yang, D., Kuang, Y., He, D., Erdal, S. and
Kenski, D. (2009) "PM2.5 concentration prediction
using hidden semi-Markov model-based times series
data mining", Expert Systems with Applications, 36
(5), 9046-9055.
Gokhale, S., Raokhande, N. (2009) "Performance
evaluation of air quality models for predicting PM10
and PM2.5 concentrations at urban traffic intersection
during winter period", Science of the total
environment, 394, 9-24.
Hoyland, K., Kaut, M. and Wallace, S. W.,(2003) "A
Heuristic for Moment-Matching Scenario Generation,"
Computational Optimization and Applications, 24
(2-3),169-185.
Lanki T., Pekkanen J., Aalto P., Elosua R., Berglind N.,
D’Ippoliti D., Kulmala M., Nyberg F., Peters A.,
Picciotto S., Salomaa V., Sunyer J., Tiittanen P., von
Klot S., Forastiere S., for the HEAPSS study group
(2006) " Associations of traffic related air pollutants
with hospitalisation for first acute myocardial
infarction: the HEAPSS study", Occup Environ Med
63:844–851.
Messina, E., Toscani, D. (2008), "Hidden markov models
for scenario generation," IMA Journal of Management
Mathematics, 19, 379–401.
Montgomery, D. C., Peck, E. A. and Vining, G. G. (2006),
Introduction to Linear Regression Analysis, Wiley.
Perez, P., Salini, G. (2008) " PM2.5 forecasting in a large
city: Comparison of three methods", Atmospheric
Environment 42, 8219–8224.
Rabiner, L. R., (1989) "A tutorial on hidden markov
models and selected applications in speech
recognition," in Proc. of the IEEE, 257-286.
Russell, S. and Norvig, R., (2002) Artificial Intelligence:
A Modern Approach, Prentice Hall.
Tsay, R. S., (2005) Analysis of financial time series, John
Wiley & Sons.
Wall, M. M., Li R. (2009) " Multiple indicator hidden
Markov model with an application to medical
utilization data", Stat Med. 28(2): 293–310.
Zanobetti, A., Franklin, M., Koutrakis, P., Schwartz, J.
(2009) " Fine particulate air pollution and its
components in association with cause-specific
emergency admissions", Environmental Health, 8:58.
ICEIS 2010 - 12th International Conference on Enterprise Information Systems
290
