
ASSESSING THE INTERFERENCE IN CONCURRENT
BUSINESS PROCESSES
N. R. T. P. van Beest, N. B. Szirbika and J. C. Wortmann
Department of Business & ICT, Faculty of Economics and Business, University of Groningen
Landleven 5, P.O. Box 800, 9700 AV Groningen, The Netherlands
Keywords: Business process interference, Inconsistencies, Data overlap.
Abstract: Current Enterprise Information Systems support the business processes of organizations by explicitly or
implicitly managing the activities to be performed and storing the data required for employees to do their
work. However, concurrent execution of business processes still may yield undesired business outcomes as
a result of process interference. As the disruptions are primarily visible to external stakeholders, organiza-
tions are often unaware of these cases. In this paper, a method is presented along with an operational tool
that enables to identify the potential interference and analyze the severity of the interference resulting from
concurrently executed processes. This method is subsequently applied to a case to verify the method, and re-
inforce the relevance of the problem.
1 INTRODUCTION
There have been only a few recent research ap-
proaches (Xiao and Urban, 2007), (Sundari et al.,
2007), (Trčka et al., 2009) to provide a systematical
discovery of data-flow errors in business processes
supported by various Process Aware Information
Systems (Dumas et al., 2005). As observed by (Sun
et al., 2006), existing commercial workflow systems,
for example, do not yet provide adequate tools for
data-flow analysis at design time.
Although the analysis of data dependencies and
process interference itself is investigated (see e.g.
(Xiao et al., 2008), the presented methods apply only
in the context of failing processes and refer to highly
distributed environments or Service-Oriented envi-
ronments (Xiao et al., 2008). In practice, however,
these interfering processes do not necessarily fail.
Rather, they may execute correctly with respect to
design constraints, (resulting in no internal error
messages) but provide the wrong business result,
especially from a customer perspective.
In addition, these situations are not limited to
those processes that include choice and parallelism,
but also appear when multiple sequential processes
are executed concurrently. Furthermore, this prob-
lem does exist independent from technical imple-
mentation details.
In this paper, an investigative method is pre-
sented. To support the method, an operational tool
has been developed and used to discover data /
process interdependencies. This method was tested
on a case of an Energy Supply company and results
have been analyzed in order to assess the severity of
the problem.
The remainder of this paper is organized as fol-
lows. Section 2 provides a background showing the
problem under investigation, related work and the
research methodology. The investigative method is
presented in section 3. This method is applied to a
case using an operational tool in section 4. The fin-
dings of the analysis performed on the case are pre-
sented in section 5. These results are discussed in
section 6, followed by a conclusion in section 7.
2 BACKGROUND
2.1 Interference in Concurrent
Processes
Concurrent execution of business processes that
share no common activities (that is, processes that
are “flow-wise” isolated) is common in most organi-
zations, although these processes may (partially) use
the same resources in terms of the information re-
261
R. T. P. van Beest N., B. Szirbika N. and C. Wortmann J. (2010).
ASSESSING THE INTERFERENCE IN CONCURRENT BUSINESS PROCESSES.
In Proceedings of the 12th International Conference on Enterprise Information Systems - Information Systems Analysis and Specification, pages
261-270
DOI: 10.5220/0002907502610270
Copyright
c
SciTePress

quired. In data-centric transactional systems used in
process support, this is described as “relaxed isola-
tion”, potentially leading to various anomalies.
However these are typically mitigated by supple-
mentary activities named “compensation activities”
(Eder et al., 1995).
Therefore, when enacting separate models of
various processes that are to be supported by various
Enterprise Information Systems, concurrent proces-
ses and their instances (cases) are assumed to be
independent. However, multiple processes may re-
quire the same data over a certain timeframe, and for
many of these process definitions various kinds of
negative process interference might occur. Process
interference is defined in this paper as the situation
where data mutations by one process affect other
concurrently executing processes, which potentially
causes an undesired process outcome. In the worst
case scenario, such processes may constitute a po-
tential risk of failed cases (which hang due to control
flow errors). These affect directly the internal re-
sources involved in the process and are immediately
considered by the organization as a threat for the
business process execution. This is usually resolved-
by means of an integration effort within the organi-
zation, which “aligns” the interfering processes. In
this way, most of the control flow errors are elimi-
nated.
A more subtle anomaly exists, which is rooted in
the relaxed data isolation of parallel processes. Even
if the process finishes regularly without any system
errors (from an internal perspective), the final result
is undesirable from a business perspective. That is,
customer satisfaction is negatively affected in the
long run. The customer is seen here as an external
resource involved in the execution of the concurrent
business processes, which is spread over more or-
ganizations.
For example, a customer of an energy company
may decide at a moment in time to change his ener-
gy provider and meanwhile move as well. After the
customer address has been changed, the process re-
sponsible for handling the switch of the energy pro-
vider may use the outdated address. Consequent-ly,
there may be a discrepancy between the actual ad-
dress of the customer and the address that is used for
his invoices. As a result, the customer may repeated-
ly receive an invoice charging an amount that is too
high according to the actual meter readings. None-
theless, in these cases the rather regular finish of the
business process implies only small internal disrup-
tions and does not affect visibly the performance
parameters that are monitored. These process envi-
ronments lead to those problems that are initially not
necessarily experienced inside the organization, as
no error messages – like a dynamic deadlock de-
tected – are signaled. The external part of the disrup-
tion however, has a considerable effect as the data
interference induced problem is primarily noticed by
the external stakeholders (mostly customers). There-
fore, the problem described is only detected by the
customer.
2.2 Related Work
Since the database management systems of the past
started to have multiple, concurrent access, it was
obvious that consistency problems may occur if in-
dependent processes access and change the same
data without global coordination. From the perspec-
tive of the design-time data-flow analysis, the exis-
ting business process modeling paradigms can be
roughly divided into two categories. One is rooted in
the initial focus on activity sequencing and coordina-
tion (i.e. the control flow perspective), using Petri-
nets (Aalst, 1998) and (or) activity-based workflow
modeling (Bi et al., 2003) where syntactic errors of
the model such as deadlock, livelock and orphan
activities are discovered through modeling and ana-
lysis. The other perspective is rooted in the more
recent service composition research but also with a
strong influence from the classic normalization of
databases of transaction-based systems, where the
focus has been primarily on implementing ACID
1
transaction semantics (for a review, see Xiao et al.,
2006).
Based on the current literature research, three
main solution categories can be identified:
a. Build a global database of object history ex-
ecution (as the PHCS – process history cap-
ture system – in Xiao et al., 2006), which is
appropriate in a transactional environment
with dynamic service composition (thus
without a designed process model), with fre-
quent rollbacks and cascading compensated
activities.
b. Build a data-flow model (like the data-flow
matrix used by (Sun et al., 2006) and inte-
grate the data-flow model in the control-flow
(or workflow) model.
c. Extend the control-flow model with data
elements (like WFD – workflow nets with da-
ta – used by Trčka et al., 2009) and use tem-
poral logic for the data-flow analysis.
Solution categories b. and c. consider that the data-
flow anomalies are strongly influenced by the two
1
Atomicity, Consistency, Isolation and Durability
ICEIS 2010 - 12th International Conference on Enterprise Information Systems
262

typical modeling patterns that appear in business
process models: parallelism and choice (typically
modeled by using AND or XOR constructs). Their
research is oriented towards finding an analysis me-
thod that covers as many patterns as possible. More-
over, all three approaches tend to find a generic so-
lution, which is not specially tailored to a certain
business process environment.
These three approaches are not suited for envi-
ronments where comparatively simple sequential
processes run independently (concurrently). In many
organizations, there is a strong semantic overlap
between the various data repositories of these pro-
cesses, which leads to anomalies. From a practical
point of view, no methods or tools exist that enable
the identification of the severity of these problems.
The presented research shows how such a me-
thod was developed. An experimental tool provides
the functionality that automatically identifies all the
data related overlaps between two business proces-
ses, showing as a result a map of data/process inter-
dependencies. The method was tested in a case in-
volving a real company. The case study serves the
following purposes: it verifies the appropriateness of
the method, it validates the utility of the tool, and
reinforces the relevance of the problem.
2.3 Research Methodology
The research methodology adopted in this paper is a
triangulation strategy (Benbasat et al, 1987). The
related case study was performed at a large energy
company in Europe, which interacts with other
smaller companies. This energy company (which
will be referred to as EC in the remainder of the pa-
per) is a major supplier of gas, electricity, heat and
other energy services. The case study is used in two
ways. First it is used to verify and validate whether
the proposed method in section 3 is capable of iden-
tifying the interference of two processes. Second, it
is used to identify the severity of the problem for a
large company, which is strongly dependent on the
consistency and the correctness of data used by “in-
dependent” processes.
3 METHOD DESIGN
The methodology concerns a number of distinct
steps that are executed to prepare the available
process documentation: (i) initial data gathering, (ii)
data structuring and cleaning and (iii) analysis.
3.1 Initial Data Gathering
Two basic sources of information about the process
can be identified: process documentation and infor-
mation gathered from process mining based on exis-
ting systems (Aalst et al., 2003). Although the latter
concerns a number of additional steps prior to the
actual data gathering (as described in e.g. (Măruşter
et al., 2009)), the information to be extracted from
the documentation during data gathering is indepen-
dent of the actual source of the information (i.e.
process mining or process documentation).
First, for each process, the activities need to be
identified in order to show the overlap in detail. In-
consistencies may occur when the same data is read
and written in two distinct processes whose execu-
tion time overlap. Inconsistencies do not occur when
both processes only read from certain data, as noth-
ing is changed. As a result, it is necessary to distin-
guish for each datafield used by an activity whether
it is read or written. That is, the read-write distinc-
tion is to be made at datafield level, because an ac-
tivity may contain both readfields and writefields.
For example, a write activity makes an update to a
certain data object and may return a result (usually
an ok, sometimes an error message). The update is
defined by the writefields, which indicate what is
going to be updated, whereas the returned result is
read by the process execution engine. Therefore,
such a write activity does not exclusively contain
writefields; it contains both readfields and write-
fields.
This distinction between readfields and write-
fields depends on both the fieldtype (input- or out-
putfield) and the nature of the activity itself. Conse-
quently, an activity needs to be categorized as either
a read activity or a non-read activity. A read activity
requires a key as input. The resulting output contains
the fields of the object that are returned. A non-read
activity makes a change to the data, by means of a
CREATE, UPDATE or DELETE operation. A
CREATE operation alone cannot result in any prob-
lems, as the object does (obviously) not exist before
the CREATE operation. Therefore, there cannot be
any dependency on that data by another process. As
a consequence, CREATE operations are not taken
into account in the analysis. In contrast to an UP-
DATE operation, a DELETE operation applies to an
entire object, rather than a single field. Deletion of a
record will be based on a key, deleting the asso-
ciated object. However, regardless whether it con-
cerns an update or delete, some data is changed.
Therefore, a non-read activity will be referred to as a
write activity for the remainder of this paper.
ASSESSING THE INTERFERENCE IN CONCURRENT BUSINESS PROCESSES
263

Once all activities have been categorized, the da-
ta used in each of these activities can be marked as
either a readfield or a writefield. Table 1 shows an
overview of the distinction made within fields used
by an activity.
Table 1: Overview of read and write indicators
Activity type
Fields used by
process engine as
Fields used by
analysis tool as
Read
(Get / retrieve)
Input -
Output Read
Write
(Set / update)
Input Write
Output Read
Outputfields of a write-activity are the result af-
ter writing the inputfields. Therefore, outputfields of
a write-activity are treated as readfields, whereas
inputfields of a write-activity are treated as write-
fields. Similarly, outputfields of a read-activity are a
result as well. However, the inputfields of a read-
activity are used to determine which data to retrieve
(i.e. an input parameter). These inputfields are not
written and, therefore, not treated as writefields or
readfields. They are not taken into consideration
during the analysis.
3.2 Data Cleaning and Structuring
Existing process documentation may contain incon-
sistencies concerning naming policies of activities
and data. For example, telephonenr may also be re-
ferred to as telnr or tel_no. Although these refer se-
mantically to the same concept in reality, i.e. tele-
phone number, they are represented differently in
the documentation. Nevertheless, the field can be
stored consistently in a single database. That is, the
inconsistencies in naming policies usually only oc-
cur in the documentation. As a result, they cannot be
marked automatically as being the same field.
Therefore, these synonyms need to be found and
provided with a univocal name.
Subsequently, all fields need to be marked with a
rating indicating the severity of overlap. That is, the
severity of the business implications in case these
fields are inconsistent. This rating will allow to cre-
ate a layered representation of the analysis, because
some fields are more important than others.
Finally, different overlapping properties need to
be defined, in order to be able to identify activities in
different processes that require and change the same
data. Due to differences in the representation in
process documentation, three distinct possibilities
are defined to identify overlap:
• Full field Overlap.
If the inputs and outputs are specified on a low
level, like a database field, full field overlap will
suffice. If and only if two fields are entirely the
same, they are considered to overlap.
• Keyword Overlap.
If inputs and outputs are only specified by natu-
ral language (which does occur in some cases),
a full match between fields is not convenient, as
these fields provide a description of the infor-
mation used. In these cases, for every field
keywords are identified and the overlap is de-
tected based on a certain percentage of equal
keywords between two fields. For instance, if
two fields are compared with 5 keywords each
and 3 keywords overlap, then these fields can be
considered to have 60% overlap.
• Document Code Overlap.
If inputs and outputs originate from a document
(i.e. an activity requires information from a
written document), the document code can be
used to detect overlap.
3.3 Analysis
In the analysis step, the fields of the activities are
compared, based on the overlapping criteria de-
scribed above, to identify all potential data overlap
between two processes. If data is read only by both
processes, no problems can occur as the data is not
changed. Overlap in data use is considered potential-
ly harmful if one of the processes (or both) is (are)
changing certain data that is also required by the
other process. In the example given in section 2, the
address change is written to the database, whereas
the supplier change requires the address for connec-
tion data. In order to identify such cases, three dis-
tinct comparisons need to be done:
1. Writefields in process 1 compared to readfields
in process 2.
2. Readfields in process 1 compared to writefields
in process 1.
3. Writefields in process 1 compared to writefields
in process 2.
4 METHOD APPLICATION
The method described in section 3 is applied to the
business process of EC. In this section, the specific
application and details for each analysis step will be
explained, along with the tool support created for
ICEIS 2010 - 12th International Conference on Enterprise Information Systems
264
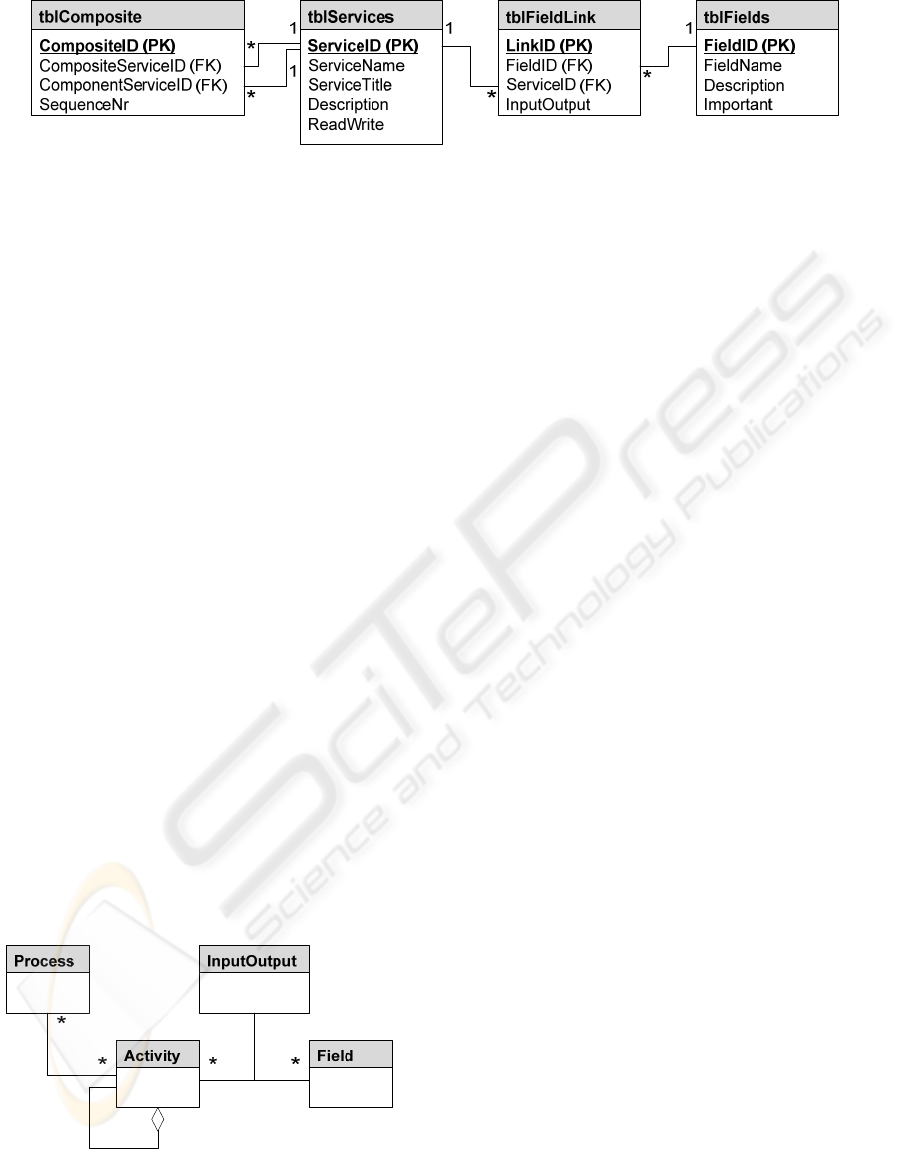
Figure 1: Data structure of the analyzed process.
automated analysis.
4.1 Case: Initial Data Gathering
The documentation about the business process of the
energy company contained a detailed description of
all processes and activities. The processes were re-
ferred to as services that were provided to the cus-
tomer. These services were nested and are, therefore,
comparable to the process and activity structure used
in process modelling. For each service, the inputs
and outputs were provided along with a detailed
description of the functionality of the service.
4.2 Case: Data Cleaning
and Structuring
The structure of the documentation is reflected in the
data structure used for analysis. Conceptually, the
data structure corresponds to the model shown in
Figure 2. The actual implementation, however, is
slightly different, as shown in Error! Reference
source not found.. All activities are represented as
non-composite services, having the read/write dis-
tinction represented as a field in tblServices.
Processes are represented in the documentation as
high-level composite services (i.e. composite servic-
es that can execute autonomously). Inputfields and
outputfields are both represented as fields, where the
junction table tblFieldlink specifies whether the field
is used as inputfield or outputfield.
Figure 2: Data structure of reworked process documenta-
tion.
Every service was defined as either a write-
service or a read-service. All information has been
structured into a relational database, containing the
services, composite definitions, and all input- and
outputfields. The fields of the tables in the analysis
database are shown in Table 2.
4.3 Case: Analysis and Tool Support
Due to the complexity of the comparisons done in
the analysis, a software tool was deemed necessary
and has been developed. This tool is capable of de-
termining overlap between datafields used by two
processes. As a main result, this software tool
enables to assess the severity of the interference be-
tween two processes. The three ways of comparing
shown in section 3.3 ensure that the overlap is iden-
tified independent from the order in which the
processes are selected in the tool. That is, there is no
difference between comparing process 1 with
process 2 and comparing process 2 with process 1
(the comparison is commutative).
The analysis tool shows a graphical representa-
tion of two selected processes, including individual
activities. After the automatic analysis has been per-
formed by the tool, potential overlap is represented
by activities marked in red and connection lines be-
tween all interfering activities. For each process an
activity can be selected, to show the inputs and out-
puts of these activities and their specific overlap.
The overlap can be determined by multiple layers of
severity. Due to the three possible comparisons, a
distinction can be made between read overlap and
write overlap. An example of the usage of the expe-
rimental tool is shown in Figure 3.
The severity of the overlap between an address
change and a provider change is immediately sug-
gested by the haywire of lines between the two
processes and the large amount of interfering activi-
ties. At a deeper level of analysis, the severity is also
given by the fact that data concerned with the over-
lap comprises essential datafields, like address in-
formation and connection information.
ASSESSING THE INTERFERENCE IN CONCURRENT BUSINESS PROCESSES
265
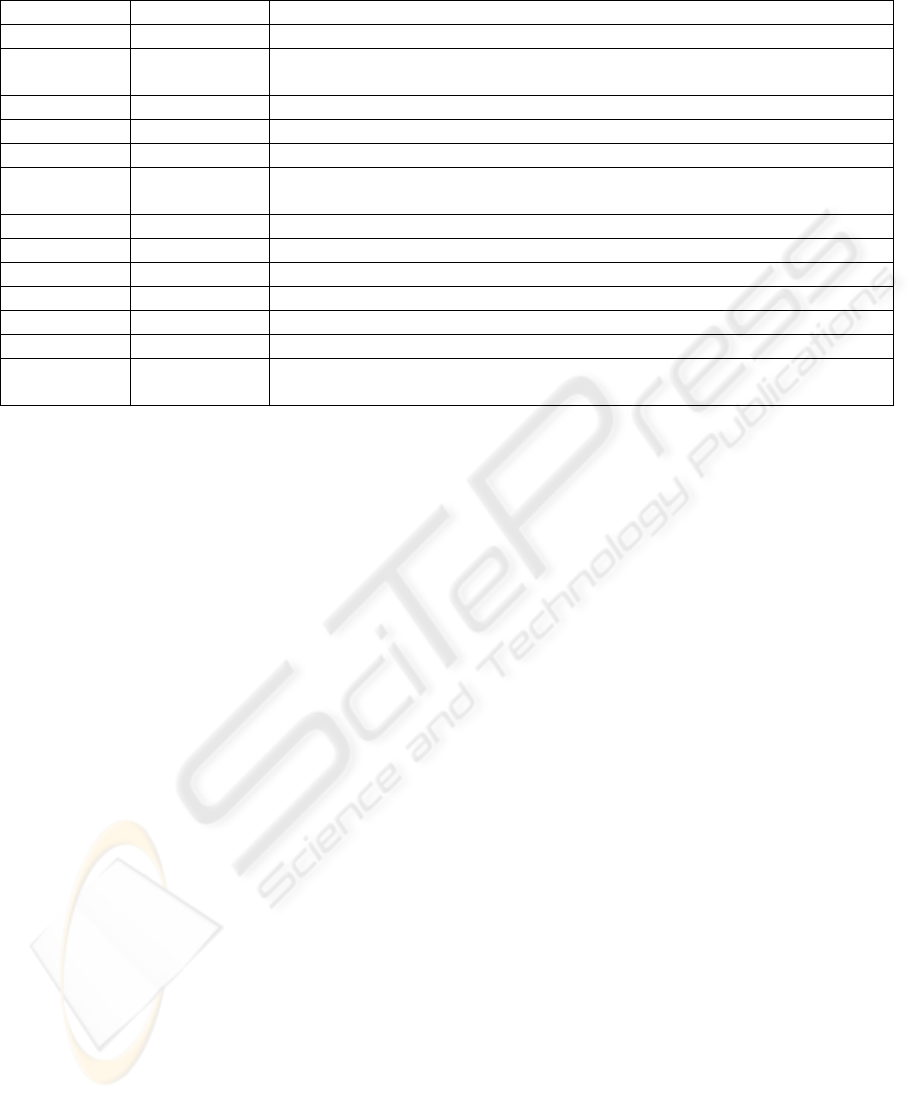
Table 2: Explanation of contents of the analysis database.
Table Field Purpose
tblComposite CompositeID Primary Key of tblComposite.
SequenceNr Indicates the execution order of the services that are part of the composite
service.
tblServices ServiceID Primary Key of tblService.
ServiceName Name of the service (internal code).
ServiceTitle Title of the service.
Description Short description containing the functionality of the service in natural lan-
guage. Although not used for automatic analysis, it may be used as lookup.
ReadWrite Indicates whether it concerns a read or a write service.
tblFieldLink LinkId Primary Key of tblFieldLink.
InputOutput Indicate whether field with FieldID is used as input or output field.
tblFields FieldID Primary Key of tblFields.
FieldName Name of the field.
Description Short description of the field in natural language.
Important Indicates the importance of the field. The higher the value, the more severe
and harmful data-interference will be.
5 FINDINGS
5.1 Results
Based on the provided documentation, eleven main
high-level processes were identified and analyzed.
For each pair of processes, the amount of overlap
and the severity of the overlap were analyzed. First
of all, a distinction has been made between different
grades of overlap: severe overlap, overlap, mild
overlap and non-important overlap. This distinction
is made based on the data involved and the amount
of interfering activities in both processes.
The data is assessed on the amount of customer
data (Address, Financial data), meter data, and con-
nection data used. These types of data are considered
to be the essential data to the business processes of
the EC. If the overlap does not concern data related
to these, it is marked as non-important overlap. The
type of overlap in case of involvement of essential
data depends on the amount of interfering activities.
If less than 10% of the activities concerns essential
data, the overlap is marked as mild overlap. If more
than 30% of the activities concerns essential data,
the overlap is marked as severe overlap. Further-
more, if any of the three comparisons described in
section 3.3 applies to the pair of processes, the over-
lap is marked as severe overlap as well. An over-
view of the analyzed processes along with the results
of this analysis is shown in Table 3.
The numbers in the column-headings refer to the
same processes shown in the row-headings. The
analysis revealed that 42 out of 55 process pairs
were likely to occur concurrently. In a natural way,
the NewCustomer process does not occur concur-
rently with other processes. As a result, no other
processes will be executed and interfere with the
NewCustomer process. In a similar way, the
processes ChangeContract, CancelContract and
EndContract are also mutually exclusive processes.
Processes that are very unlikely to occur simulta-
neously are denoted by “X”.
All other pairs of processes are likely to occur
simultaneously. It shows that all pairs of these pro-
cesses show overlap. The distinct types of overlap
are denoted with “N” (non-important overlap), “M”
(mild overlap), “O” (overlap) and “S” (severe over-
lap).
In 37 out of 42 different process pairs that were
compared, overlap concerning essential data was
found.
Furthermore, 16 of these cases were considered
severe based on the amount of interfering activities
and the involvement of essential data. It was ob-
served that these situations occur under certain spe-
cific conditions; every interference case concerned a
co-occurrence of one or more of the basic properties
listed below:
• Heavily Data-dependent Processes. This con-
cerns parts of processes for which certain infor-
mation is assumed to be correct and unchanged,
ICEIS 2010 - 12th International Conference on Enterprise Information Systems
266
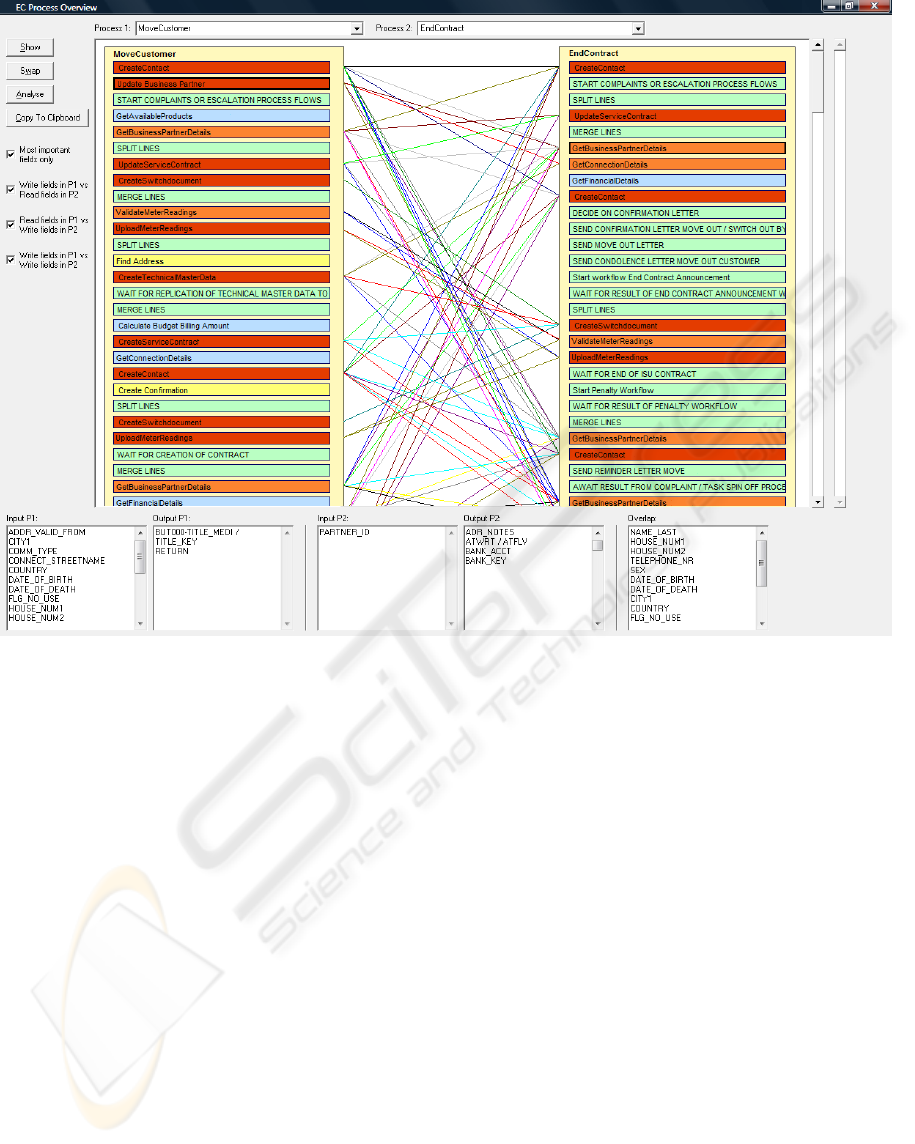
Figure 3: Example of the experimental tool, developed to automatically identify the overlap.
and there is a strong need for external data –
that is, data that is stored far from the environ-
ment of the resources that execute the process –
to proceed.
• Data-interconnected Processes where Diffe-
rent Time Events are often the Main Activity
Triggers. This concerns those concurrent pro-
cesses (that are assumed in the organization to
be independent, due to the relaxed isolation
view), which use the same data at a particular
point in time or within a certain timeframe.
• Long-running Processes. This concerns a
chain of activities that affect the same business
object over a long time period. As a result, lock-
ing of data objects is highly undesirable from a
pro-cess design point of view and, therefore, is
avoided in practice by the modelers.
5.2 Example of Severe Overlap
Using the tool, the severe cases could easily be iden-
tified. Although the specific details of the processes
of the EC are beyond the scope of this paper, a sim-
plified outline of the processes will illustrate the
potential business consequences of the identified
overlap.
For example, as indicated by Figure 3 and Table
3, an address change (denoted by MoveCustomer)
and a supplier change (denoted by EndContract)
have severe overlap when executed concurrently.
The following essential data is affected by both
processes: customer data (address), connection data
(EAN code linked with address) and meter data
(which is essential for the energy consumption to be
charged at the final invoice). Both processes can be
considered heavily data-dependent, as they require
essential data to remain correct and unchanged over
time. In both processes, this data is read and written.
As a result, the property of data-interconnected
processes applies as well.
The process of a supplier change consists of two
parts. The first part is located at the old supplier (end
of contract). The second part is located at the new
supplier (new contract / new customer). This exam-
ple will focus on the first part. That is, EC will be
the old supplier where the EndContract process will
be executed. In case of a concurrent execution of
ASSESSING THE INTERFERENCE IN CONCURRENT BUSINESS PROCESSES
267
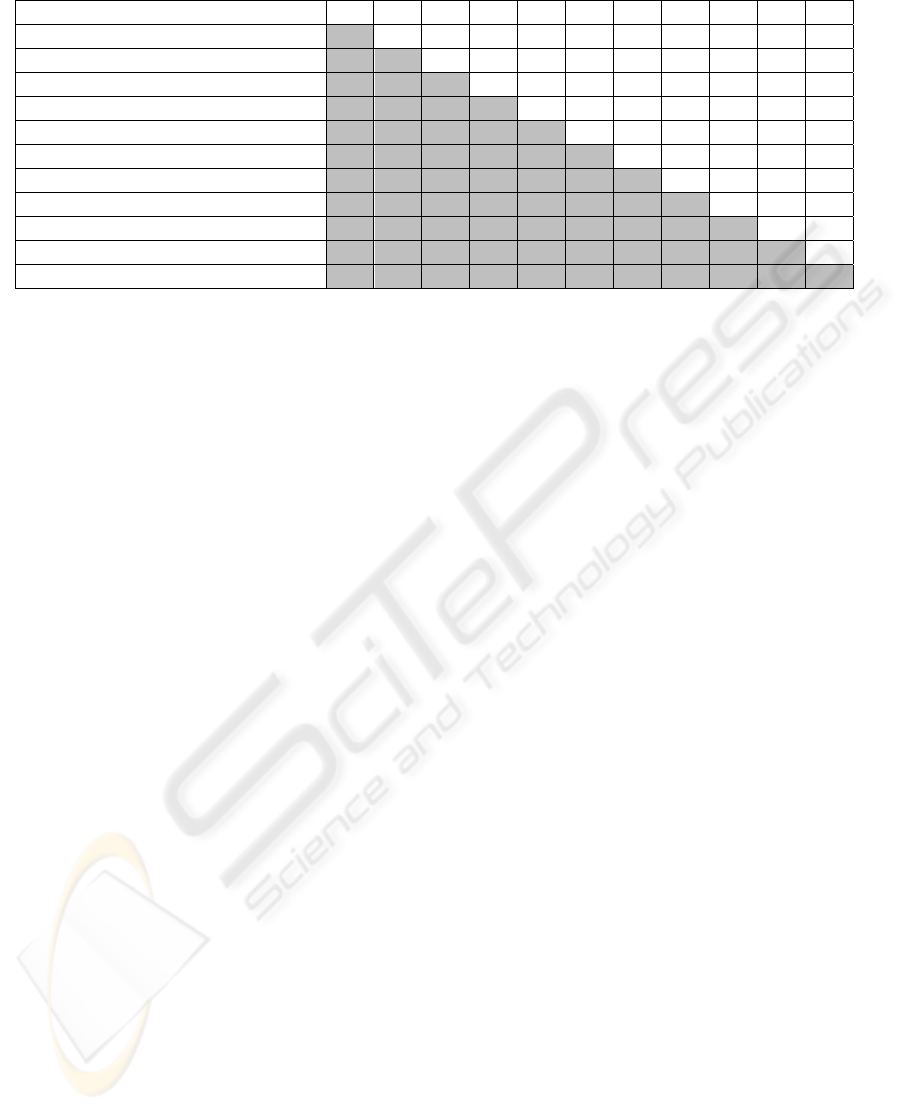
Table 3: Overview of overlap between processes.
Process 1 2 3 4 5 6 7 8 9 10 11
1. NewCustomer
X X X X X X X X X X
2. MoveCustomer
O M N S N M S S S
3. UpdatePaymentDetails
S N S M O S S S
4. UpdateBBP
S O O M S O S
5. AddMeterReadings
N N O O O S
6. UpdateCustomerDetails
O O S O S
7. CreatePaymentArrangement
M M M M
8. HandleCustomerComplaints
S O O
9. ChangeContract
X X
10. CancelContract
X
11. EndContract
MoveCustomer and EndContract, two basic sce-
narios are possible: MoveCustomer is triggered be-
fore the end of EndContract, or MoveCustomer is
triggered after the end of EndContract. In the first
scenario, the concurrency of both processes is entire-
ly within the responsibility of EC and, therefore, the
least likely to fail. However, a number of atomic
transactions appear, where information is read and
required for some of the subsequent activities.
The potential difference between the timestamp
of the request for switch and the requested switch-
date (this may be up to 6 months) implies that this
process can be characterized as a long-running
process. When a switch is proposed, the delivery of
energy by the desired energy provider is linked to a
certain address (that is, the address of the customer
is retrieved and coupled to the connection data). If
the address changes after this part of the process, the
address change is updated to the customer data.
Consequently, the new address will be correctly up-
dated, but the change of the energy supplier will not
be actualized for this customer. Instead, the desired
energy supplier change will apply for the old ad-
dress. As a result, the new inhabitant of the old
house of the customer, will have the energy supplier
as requested by the customer.
As presented in Section 2.1, this final result of
the execution of both processes (without error mes-
sages) is highly undesired.
5.3 Validation of the Results
For each analyzed process pair it was assessed
whether the results represented a realistic sequence
of events in the execution of the actual business
processes. Furthermore, it was assessed whether the
problems were known inside the organization.
The results of the analysis were validated by
means of interviews with the process experts at the
EC. The validation consisted of informal interviews
with 4 different process experts. First, the individual
processes obtained by the analysis were shown to
process experts of the EC, to verify the process re-
presentation used by the analysis with the execution
of these processes in reality. It showed that all
processes as represented were reflecting the execu-
tion of business processes reality.
Subsequently, the analyzed process pairs were
assessed with the execution of business processes in
reality. That is, the concurrent execution as
represented by the analysis tool was validated with
the potentiality of such a co-occurrence in reality.
This assessment revealed that process 9, 10 and 11
in Table 3 would not co-occur in reality, as these are
mutually exclusive. The remainder of the processes,
however, executed concurrently (with the exception
of process 1, NewCustomer, which does – naturally
– not interfere with other processes, as discussed in
section 4).
Finally, the organization’s awareness of each
troublesome case was evaluated. The interviews
with the process experts clearly revealed the busi-
ness nature of the problem, as the majority of the
results was unknown to the EC. The most characte-
ristic example of such an unknown case is presented
in section 5.2.
Most of the problems emerging from the over-
lapping scenarios concerned customer data or con-
nection data without resulting in failing processes.
Consequently, the problems primarily affected the
external stakeholders (customers), whereas they did
not directly affect the internal resources. As a result,
most of these scenarios were past the awareness of
the organization and no mechanisms or procedures
were in place to prevent, correct or identify these
errors.
Two of the severe cases were within the aware-
ness of the organization. These processes were
ICEIS 2010 - 12th International Conference on Enterprise Information Systems
268

equipped in an ad-hoc manner with various mechan-
isms designed to minimize the risk for these errors.
The most typical cases of data interference were
intercepted by custom-built triggers to either enforce
alignment between the processes or provide a
process lock. That is, one of the processes is not
allowed to proceed until completion of the other
process or not allowed to start at all. The results of
the analysis, and the interviews showed a confirma-
tion of the hypothesis expressed in section 2.
6 DISCUSSION AND FUTURE
RESEARCH
The tool presented can be interpreted as a methodo-
logical instrument that have been applied in a case
study (i.e. EC) to successfully identify data-flow
related errors. This application of the tool verifies
the technical implementation of the proposed me-
thodology. Experts from the company have been
consulted to ascertain the practical relevance of the
data-flow errors identified by the tool. This has fur-
ther established the added business value of the tool.
Moreover, from a design science perspective (Hevn-
er et al., 2004), the established criteria for artifact-
driven research regarding evaluation have been sa-
tisfied (Jones et al., 2007).
Within this methodology-based context, one of
the most important findings is that two of the seven
identified cases of severe data-flow errors where
known to the process experts. Highlighting these
findings in front of the experts lent immediately
more credibility to this work, and expanded their
effort to identify symptoms and causes of the other
tool-identified errors. Furthermore, revealing the
basic nature of the error eased the finding of solu-
tions for these errors.
However, the application of the methodology
does not reveal whether the problems can be preven-
ted by means of coordination or a better software
implementation, as this would imply that every sin-
gle possibility and exception should be modeled.
Rather, application of the methodology identifies the
potential interfering processes. Moreover, it provides
insight in the severity of potential interference be-
tween concurrently executed processes, which pro-
vides the opportunity to resolve or prevent these
situations in the Enterprise Information System.
Correspondingly, the overlap found in the analy-
sis of EC is not a result of a poor software imple-
mentation. The analysis has been performed inde-
pendent from any implementation. In this respect,
this paper has gone beyond past research, by analyz-
ing the process flow along with the information re-
quired in each of the distinct activities. The results
of the application of the methodology to the case
clearly show the importance and relevance of these
business problems, as severe overlap in concurrent
processes (but apparently independent) is widely
spread.
In addition to the theoretical deduction of the po-
tential consistency issues, this paper contributes in-
directly to the area of business intelligence as well.
If data-flow errors remain undetected, business strat-
egies formulated from mining transactional data
would be ineffective. For example, if organizations
are planning to tailor business strategies according to
the geographical distribution of customers, then in-
accurate addresses would translate to wrongful in-
terpretations of consumer preferences. Therefore, the
methodology does not only improve operational
efficacies (i.e., better customer service), but it also
augments strategic decision making (i.e., data min-
ing in formulating business strategies).
Foreseen future research can be described as fol-
lows. The development of a context-independent
categorization of data can contribute to the generali-
zability of the method. If essential data is
represented in terms of data hierarchies, i.e. the more
a piece of data is required for the smooth running of
one or more business processes within and/or across
corporate hierarchies, the more “essential” it is. Fur-
thermore, in defining essential data according to data
hierarchies, it might be possible to incorporate addi-
tional tracing capabilities into the tool that enable
process experts to trace the impact caused by specif-
ic data-flow errors.
Furthermore, this methodology should be applied
to multiple case studies, as this may not only contri-
bute to generalize the presented methodology, but
also provide a confirmation of the usability of the
experimental tool. In addition, the agile model-
driven framework presented in (Van Beest et al.,
2009) can be applied to the EC case, in order inves-
tigate whether the problems identified in this paper
can be overcome.
7 CONCLUSIONS
In this paper, a methodology is presented that
enables to identify and analyze the potential incon-
sistency issues resulting from concurrently executed
processes. This methodology is applied to a case,
showing the severity of the problem for that organi-
zation.
ASSESSING THE INTERFERENCE IN CONCURRENT BUSINESS PROCESSES
269

The analysis showed that concurrently executed
processes may indeed interfere in practice. Further-
more, the validation with process experts revealed
that the unknown problems as indicated by the anal-
ysis tool are common practice in reality as well. The
amount and severity of the overlap identified con-
firms the premised frequency of occurrence of the
problems as well as the according relevance for or-
ganizations.
Compared to other methods, this is a rather
lightweight method. That is, it does not require the
availability of a formal representation of the busi-
ness process. Instead, it is applicable using semi-
structured process documentation, providing results
that are legible by users without in-depth knowledge
of implementation specifics.
The methodology showed its ability to efficiently
provide a representative and valuable insight in the
interference between concurrent processes and the
potential disruptions emerging.
REFERENCES
Aalst, van der, W.M.P., 1998. The application of petri nets
to workflow management. The Journal of Circuits,
Systems and Computers, (8:1), pp. 21–66.
Aalst, van der, W., van Dongen, B., Herbst, J., Măruşter,
L., Schimm, G., Weijters, A., 2003. Workflow Min-
ing: A Survey of Issues and Approaches. Data and
Know. Eng. (47:2), 237-267.
Beest, van, N.R.T.P., Szirbik, N.B., Wortmann, J.C., 2009.
A Vision for agile Model-driven Enterprise Informa-
tion Systems. In Proc. of the 11th Int. Conf. on EIS,
vol. "Inf. Syst. Analysis and Specification”, pp. 188-94.
Benbasat, I., Goldstein, D. K., Mead, M., 1987. The Case
Research Strategy in Studies of Information Systems,
MIS Quarterly, (11:3), pp. 369-386.
Bi, H. H., and Zhao, J. L., 2003. Mending the Lag Be-
tween Commercial Needs and Research Prototypes: A
Logic-Based Workflow Verification Approach. In
Proc. of the 8th INFORMS Computing Society Conf.,
pp. 191-212.
Dumas, M., Aalst, W.M.P. van der, Hofstede, A.H. ter,
2005. Process-aware information systems: bridging
people and software through process technology, John
Wiley & Sons, Inc., New York, USA.
Eder, J., & Liebhart, W., 1995. The workflow activity
model WAMO. In Proc. of the 3rd Int. Conf. on Co-
operative Information Systems.
Hevner, A.R., March, S.T., Park, J., Ram, Sudha., 2004.
Design Science in Information Systems Research. MIS
Quarterly (28:1), pp 75-105.
Jones, D. and Gregor, S. The Anatomy of a Design
Theory, 2007, Journal of the Association for Informa-
tion Systems, (8:5), pp. 312-335.
Măruşter, L., Beest, van, N.R.T.P., 2009. Redesigning
business processes: a methodology based on simula-
tion and process mining techniques. Journal Know.
and Inf. Syst., (21:3), pp 267-398.
Sun, S.X., Zhao, J.L., Nunamaker, J.F., Sheng, O.R.L.,
2006: Formulating the Data-Flow Perspective for
Business Process Management. Inf. Sys. Research, 17,
pp. 374- 391.
Sundari, M.H. ,Sen, A.K., and Bagchi., A., 2007. Detect-
ing Data Flow Errors in Workflows: A Systematic
Graph Traversal Approach. In 17th Workshop on Inf.
Technology & Syst. (WITS-2007), Montreal.
Trčka, N., Aalst, van der, W.M.P., and Sidorova, N., 2009.
Data-Flow Anti-Patterns: Discovering Data-Flow Er-
rors in Workflows. In Proc. of CAiSE’09, LNCS 5565,
Springer.
Xiao, Y., Urban, S.D., 2006. A Process History Capture
System for Analysis of Data Dependencies in Concur-
rent Process Execution. In Data Engineering Issues in
E-Commerce and Services, LNCS 4055, pp. 152-166,
Springer.
Xiao, Y., Urban, S.D., 2008. Using Data Dependencies to
Support the Recovery of Concurrent Processes in a
Service Composition Environment. In Proc. of the
Coop. Inf. Syst., Monterrey, Mexico.
ICEIS 2010 - 12th International Conference on Enterprise Information Systems
270
