
REPUTATION-BASED SELECTION OF WEB INFORMATION
SOURCES
Donato Barbagallo, Cinzia Cappiello, Chiara Francalanci and Maristella Matera
Politecnico di Milano, Dipartimento di Elettronica e Informazione, Via Ponzio 34/5, Milano, Italy
Keywords: Web reputation, Web search.
Abstract: The paper compares Google’s ranking with the ranking obtained by means of a multi-dimensional source
reputation index. The data quality literature defines reputation as a dimension of information quality that
measures the trustworthiness and importance of an information source. Reputation is recognized as a multi-
dimensional quality attribute. The variables that affect the overall reputation of an information source are
related to the institutional clout of the source, to the relevance of the source in a given context, and to the
general quality of the source’s information content. We have defined a set of variables measuring the
reputation of Web information sources along these dimensions. These variables have been empirically
assessed for the top 20 sources identified by Google as a response to 100 queries in the tourism domain.
Then, we have compared Google’s ranking and the ranking obtained along each reputation variable for all
queries. Results show that the assessment of reputation represents a tangible aid to the selection of
information sources.
1 INTRODUCTION
Web browsing most often starts from search engines
and moves along a chain of links originating in the
top search results (DeStefano and LeFevre, 2007).
Search engines are general purpose and implement
proprietary ranking algorithms which, although
efficient and commonly effective, do not always
meet users’ expectations. Users are often dissatisfied
with the ability of search engines to identify the best
information sources within a given domain or for a
given purpose (cf. Chen et al., 2008). It is common
experience how the identification of relevant
information on a specific issue through Web
browsing requires several iterations and interesting
sources may surface as a result of relatively long
search sessions. In (Jiang et al., 2008), empirical
evidence is provided indicating that there is a quite
large probability (about 63%) of a relevant
document being found within a 1-120 rank range. In
addition to that, the study found that the most
relevant document in substantially more than 65% of
the cases, not even the top 300 ranked documents
are expected to suffice.
The ranking algorithms used by search engines
are authority based, i.e. they tie a site’s ranking to
the number of incoming Web links (Gupta and
Jindal, 2008). The literature provides several
alternative approaches to ranking aimed at
increasing the satisfaction of users in different
contexts. A large body of literature follows the
semantic Web approach and proposes ranking
algorithms taking advantage of semantic abilities
and metadata, such as tags, domain knowledge,
ontologies, and corpuses (cf. Lamberti et al., 2009).
Recently, collaborative approaches propose
innovative ranking algorithms based on a variety of
user-provided evaluations (cf. Louta et al. 2008).
More consolidated approaches focus on QoS and
adjust authority-based rankings with runtime
response time information (Chen and Ding, 2008).
This paper explores the possibility of adjusting
the ranking provided by search engines by assessing
the reputation of Web information sources. The data
quality literature defines reputation as a dimension
of information quality that measures the
trustworthiness and importance of an information
source (Batini et al., 2009). Reputation is recognized
as a multi-dimensional quality attribute. The
variables that affect the overall reputation of an
information source are related to the institutional
clout of the source, to the relevance of the source in
a given context, and to the general quality of the
source’s information content. To the current state of
30
Barbagallo D., Cappiello C., Francalanci C. and Matera M. (2010).
REPUTATION-BASED SELECTION OF WEB INFORMATION SOURCES.
In Proceedings of the 12th International Conference on Enterprise Information Systems - Software Agents and Internet Computing, pages 30-37
DOI: 10.5220/0002908400300037
Copyright
c
SciTePress

Table 1: Reputation metrics.
Traffic Breadth of contributions Relevance Liveliness
Accuracy
n.a. average number of
comments to selected post
(crawling)
Centrality, i.e., number of
covered topics (crawling)
n.a.
Completeness
n.a. number of open discussions
(crawling)
number of open discussions
compared to largest Web
blog/forum (crawling)
number of comments per user
(crawling)
Time
traffic rank
(www.alexa.com)
age of source (crawling) n.a. average number of new
opened discussions per day
(www.alexa.com)
Interpretability
n.a. average number of distinct
tags per post (crawling)
n.a. n.a.
Authority
- daily visitors
(www.alexa.com)
- daily page views
(www.alexa.com)
- average time spent on
site (www.alexa.com)
n.a. - number of inbound links
(www.alexa.com)
- number of feed
subscriptions (Feedburner
tool)
number of daily page views
per daily visitor
(www.alexa.com)
Dependability
n.a. number of comments per
discussion (crawling)
bounce rate
(www.alexa.com)
average number of comments
per discussion per day
(crawling)
the art, the literature lacks evidence demonstrating
the importance of the concept of reputation in
improving the ranking provided by search engines. It
also lacks an operationalization of the concept of
reputation for the assessment of Web information
sources. This paper aims at filling this literature
gaps.
The next section discusses our operationalization
of the concept of reputation applied to Web
information sources. Section 3 describes our
experiment and Section 4 reports our main research
results. Section 5 contextualizes our contributions in
the fields of reputation assessment. Conclusions are
finally drawn in Section 6.
2 OPERATIONALIZATION OF
THE CONCEPT OF
REPUTATION
Our operationalization of reputation draws from the
data quality literature. In particular, we start from
the classification of reputation dimensions provided
by (Batini et al., 2009). The paper explains how
accuracy, completeness, and time represent the
fundamental data quality dimensions in most
contexts. Interpretability, authority, and
dependability represent additional dimensions that
should be considered when assessing reputation,
especially for semi-structured and non structured
sources of information.
In this paper, we focus on Web information
sources and, specifically, on blogs and forums. This
choice is related to the general research framework
in which this paper is positioned, which focuses on
sentiment analysis, i.e. on the automated evaluation
of people’s opinions based on user-provided
information (comments, posts, responses, social
interactions). For this purpose, blogs and forums
represent a primary source of information.
We have identified four aspects of blogs and
forums that should be evaluated to assess their
reputation:
• Traffic: overall volume of information produced
and exchanged in a given time frame.
• Breadth of contributions: overall range of issues
on which the source can provide information.
• Relevance: degree of specialization of the source
in a given domain (e.g. tourism).
• Liveliness: responsiveness to new issues or
events.
Table 1 summarizes the reputation metrics that
we have identified for the variables above (table
columns) along different data quality dimensions
(table rows). The source of metrics is reported in
parentheses, where “crawling” means either manual
inspection or automated crawling depending on the
site. Please note that some of the metrics are
provided by Alexa (www.alexa.com), a well-known
service publishing traffic metrics for a number of
Internet sites. Also note that not all data quality
dimensions apply to all variables (not applicable,
n.a. in Table 1).
The metric labeled “number of open discussions
compared to largest Web blog/forum” has been
calculated based on the following benchmarks.
Technorati (www.technorati.com) reports that the
REPUTATION-BASED SELECTION OF WEB INFORMATION SOURCES
31

blog with the highest number of daily visitors is
Huffingtonpost (a blog of blogs), with an average
4,80 million visitors per day. Alexa reports that the
forum with the highest number of daily visitors is
Topix, with an average 2.05 million visitors per day.
As a general observation, our choice of metrics
has been driven by feasibility considerations. In
particular, Table 1 includes only quantitative and
measurable metrics.
3 RESEARCH DESIGN AND
DATA SAMPLE
We have performed 100 queries with Google in the
tourism domain. This domain choice is related to the
importance of tourism in Web search activities. It
has been estimated that more than 60% of Web users
perform searches related to tourism and travel (see
www.bing.com/travel).
Referring to a specific domain helps design the
set of queries according to a domain-specific search
model. In this research, we refer to the Anholt-GfK
Roper Nations Brand Index (Anholt, 2009). This
index defines six fundamental dimensions of a
destination’s brand along which the basic decision-
making variables of potential tourists should be
identified: presence, place, pre-requisites, people,
pulse, and potential. We have identified ten
decision-making variables along these dimensions:
1. Weather and environment.
2. Transportation.
3. Low fares and tickets.
4. Fashion and shopping.
5. Food and drinks.
6. Arts and culture.
7. Events and sport.
8. Life and entertainment.
9. Night and music.
10. Services and schools.
Our choice of decision-making variables is
discussed in (Barbagallo et al., 2010). The
discussion of the decision-making model is outside
the scope of this paper; however, the design of our
set of queries according to a decision-making model
helps us understand the impact of our findings. In
particular, we can assess the usefulness of the
reputation concept in the identification of important
information sources for all decision-making
variables, or, alternatively, only for specific
variables. If, on the contrary, queries were generic, it
would be more difficult to understand the
consequence of missing high-reputation sources of
information.
Table 2: Basic queries.
Decision making variable Tags for five basic queries
Weather and environment level of pollution,
congestion charge,
sustainable tourism,
weather, air quality
Transportation underground, rail, airport,
traffic jam, street
Low fares and tickets low-cost flights, cost of
living, discounts and
reductions, student fare,
tickets discount
Fashion and shopping shopping, fashion,
department store, second
hand, vintage
Food and drinks pub, wine, beer, pizza, good
cooking
Arts and culture museums, monuments,
parks, festivals, art
Events and sport sport, tennis courts, city
marathon, NBA, football
Life and entertainment cinema, restaurants,
clubs&bars, theaters, theme
parks
Night and music nightlife, music, theaters,
party, jazz
Services and schools public transports,
accommodation, university,
utilities, healthcare
We have defined 10 queries for each decision-
making variable. The 10 queries are derived from
the 5 basic queries described in Table 2 by adding
“London” and “New York” to all queries. To limit
Google’s results to blogs and forums, all queries are
in the form: < “tag” [London or New York] “tag”
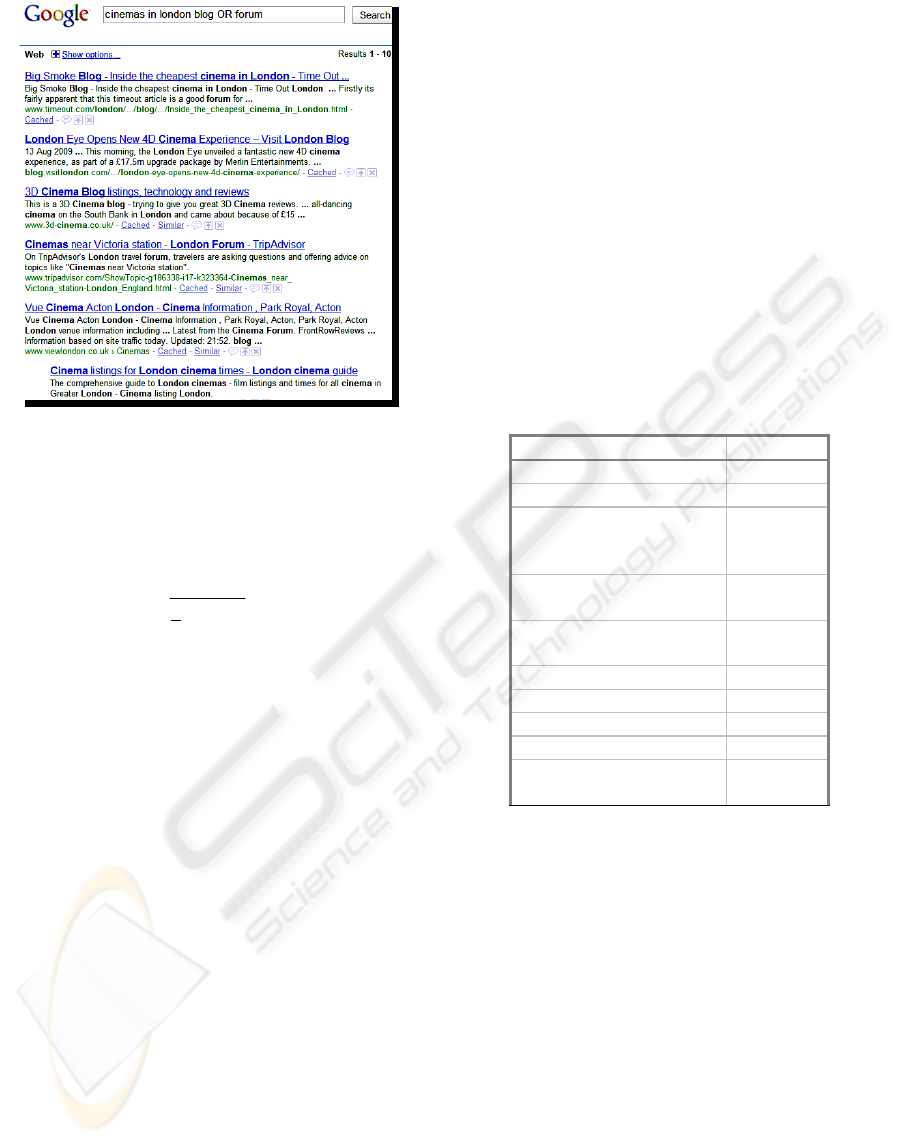
[blog or forum]>. Figure 1 reports the Google results
for a sample query about cinemas in London.
For all queries, we have considered the top 20
results according to Google’s ranking. Then, we
have re-ranked results according to all metrics in
Table 1. The distance between Google’s ranking and
the ranking obtained according to each reputation
metric has been calculated by means of Kendall tau
(Kendall and Smith, 1938). Kendall tau (Kτ) has the
following properties:
ICEIS 2010 - 12th International Conference on Enterprise Information Systems
32
1.
2.
3.
4.
5.
6.
…
1.
2.
3.
4.
5.
6.
…
Figure 1: Sample query results.
• It ranges between -1 and 1.
• It is equal to 1 when two rankings are identical.
• It is equal to -1 when two rankings are opposite.
Formally, Kendall tau is defined as follows:
1
(1)
2
cd
nn
K
nn
τ
−
=
⋅
−
where n represents the number of ranked items, n
c
represents the number of concordant pairs (i.e., pairs
with the same position in both rankings), n
d
represents the number of discordant pairs.
By comparing Google’s ranking with reputation-
based rankings we can:
1. Understand the impact of the reputation
variables over the search results.
2. Understand whether different reputation
variables provide similar results and, hence, it
seems reasonable to define an aggregate
reputation index.
We have complemented the quantitative analyses
based on Kendall tau with a number of qualitative
inspections of results and manual verifications in
order to triangulate results. These complementary
analyses have allowed us to understand the practical
impact of deltas between rankings.
4 EMPIRICAL RESULTS
As discussed in the previous section, our
experiments have been based on the top 20 results
according to Google’s ranking for the 100 queries
created considering all the tags listed in Table 2 both
for London and New York. For all the Web sites
retrieved through Google, we calculated the metrics
in Table 1 and re-ranked results according to the
performed assessment. We thus obtained more than
1000 re-ranked items to compare with the official
Google ranking by means of the Kτ index.
The computation of the average of the Kτ values
for each metric allowed us to assess the impact of
each metric in the Google ranking definition. In fact,
the similarity values reported in Table 3 can be
defined as the degree with which each reputation
metric is implicitly considered in the Google’s
PageRank algorithm. Note that Kτ values have been
normalized in the [0, 1] interval.
Table 3: Similarity between our ranking based on
reputation metrics and the Google ranking.
Metric Kτ
Daily visitors 0,41845
Bounce rate 0,44585
Number of open discussions
compared to largest Web
blog/forum
0,45071
Average number of comments
per discussion per day
0,45159
Number of comments per
discussion
0,46638
Traffic rank 0,46878
Number of inbound links 0,47769
Daily page views 0,50409
Average time spent on site 0,50499
Average number of new
opened discussions per day
0,52813
A first result of our experiments is the proof that
actually the PageRank algorithm is only partially
based on the observation of the inbound links. In
fact, as can be noted in Table 3, the Kτ index
associated to this metric reveals a dissimilarity
between the Google ranking and the ranking
exclusively based on inbound links. Furthermore,
results also show that the Authority metrics provide
rankings with a higher similarity than the ones
generated on the basis of the Dependability and
Completeness metrics. This is due to the fact that
the PageRank algorithm mainly analyzes the
frequency with which users access the Web site and
thus it tends to promote the Web sites characterized
by numerous users’ accesses (e.g., page views). The
similarity with the Google ranking then decreases
when the metrics start to deal with the analysis of
the actual use of the Web site contents (e.g., average
number of comments, new discussions, etc.). This is
REPUTATION-BASED SELECTION OF WEB INFORMATION SOURCES
33

Table 4: Analysis of the score differences.
Metric
Average
distance
Variance
Coincident
links (%)
Daily visitors 3,9213 7,6337 7,874
Bounce rate 4,10590 7,5874 7,2386
Number of open
discussions
compared to
largest Web
blog/forum
3,9567 7,7077 6,9554
Average number
of comments per
discussion per day
3,9685 8,23 7,6016
Number of
comments per
discussion
3,8344 7,521 8,812
Traffic rank 3,8427 7,3033 7,4705
Number of
inbound links
3,7296 7,3072 8,3113
Daily page views 3,9895 7,5242 7,6115
Average time
spent on site
3,9507 7,6656 7,723
Average number
of new opened
discussions per
day
3,9093 7,5773 7,6215
due to the generality of Google, which on one hand
is advantageous but, on the other hand, does not
focus on the quality of information provided by Web
sites. The lack of dependability and completeness
metrics therefore often leads to misjudgments of
forum and blogs, where contents play a major role.
Besides the similarity coefficients, the ranking
comparison has been further refined by considering
the distance between the positions associated with
the same link in two different rankings. Again,
considering all the metric-driven rankings, we have
calculated (i) the average distance, (ii) the variance
and (iii) the percentage of the coincident links inside
a ranking. Table 4 shows the results of this analysis.
The average distance is in general about 4, which is
noteworthy if we consider that only the first 20
positions have been considered in both the rankings.
The variance values especially highlight that in some
cases the distance is particularly high. This is also
confirmed by the results shown in Table 5, where
the details about the number of sites with a score
difference greater than 5 and 10 are given. As can be
noted the percentage of cases in which the difference
is greater than 5 is at least the 35%.
Table 5: Details on the number of sites with a distance
greater than 5 and 10.
Distance>=10 (%)
Distance>=5
(%)
Daily visitors 2,62 38,40
Bounce rate 2,75 41,81
Number of open
discussions compared
to largest Web
blog/forum
3,01 37,61
Average number of
comments per
discussion per day
3,80 39,32
Number of comments
per discussion
2,75 35,91
Traffic rank 2,88 36,57
Number of inbound
links
2,23 35,78
Daily page views 2,62 40,10
Average time spent
on site
2,49 38,14
Average number of
new opened
discussions per day
2,36 40,10
In order to reduce the complexity of the model
due to the large number of metrics, a principal
component analysis (PCA) has been performed. This
kind of analysis is used to reduce the initial set of
variables into a small group of correlated ones.
Table 6 then shows the outcome of PCA along with
the standardized regression weights of the
relationships between the construct, considered as a
latent variable, and observed variables. The results
of the reliability analysis run with SEM show that all
the factorizations can be accepted, since all the
values of the composite factors are greater than the
threshold value of 0.70, as suggested by (Bagozzi
and Yi, 1988; Fornell and Larcker, 1981) and the
average variance extracted is greater than 0.50, as
suggested by (Hair et al., 1998). Moreover, all the
relationships considered between observed and
latent variables are significant (p < 0.001). This
confirms that the factorizations in the measurement
model have been performed correctly. The results of
such analysis show how the initial set of metrics can
be reduced to three main identified constructs: (i)
traffic construct, which groups all those metrics that
are, directly or indirectly, involved with the Web site
traffic generated through its authority on the Web;
(ii) participation construct, involving those metrics
that measure the contribution of external users that
write messages or replies and of internal users who
ICEIS 2010 - 12th International Conference on Enterprise Information Systems
34

Table 6: Principal Component Analysis.
Variable Construct
Standardized
Regression Weights
p-value
Variance
Extracted
Composite
Reliability
Traffic rank Traffic 0.873 <0.001 0.937 0.944
Daily visitors 0.992 <0.001
Daily page views 0.980 <0.001
Number of inbound links 0.852 <0.001
Number of open discussions compared to
largest Web blog/forum
0.988 <0.001
Average number of new opened discussions
per day
Participation 0.482 <0.001 0.758 0.867
Number of comments per discussion 0.634 <0.001
Average number of comments per
discussion per day
0.903 <0.001
Average time spent on site Time 0.957 <0.001 0.852 0.886
Bounce rate 0.747 <0.001
Table 7: Linear regression analysis.
Dependent Variable Independent
variable
Unstandardized
coefficient
Standardized
coefficient
Standard error p-value
Google_rank Traffic 0.108 0.106 0.051 0.036
Google_rank Participation -0.105 -0.090 0.056 0.058
Google_rank Time -0.187 -0.177 0.045 <0.001
keep the content up-to-date; (iii) time construct
which is an index of users’ interest, since it collects
measures of the time spent on the Web site.
Then, constructs for further analysis have been
obtained through an average of each identified
component in order to proceed with regressions.
Table 7 reports the results of a linear regression that
measures the interaction between each construct and
the Google ranking variable, named Google_rank.
The relation between traffic and Google_rank is
significant (p = 0.036) and positive, meaning that
traffic is a good predictor of Google positioning. The
interaction between participation and Google_rank
is supported at 90% significance level (p = 0.058)
and the coefficient has a negative sign. Finally, time
and Google_rank are negatively related and the
relation is strongly significant (p < 0.001), so the
better the results in such an indicator, the worse it is
on a Google search.
These analyses confirm that PageRank algorithm
is directly related to traffic and inbound links,
privileging mere number of contacts rather than the
actual interest of the users and the quality of such
interactions. Indeed, the inverse relations between
Google_rank and time and participation give some
evidence of the fact that highly participated Web
sites can be even penalized in a Google search or, at
least, not rewarded. To understand this result let us
consider the practical example of companies’
institutional Web sites. These Web sites are often
equipped with a forum or a blog which is usually
highly monitored by moderators or editorial units to
avoid spam or attacks to the company reputation. It
is easy to observe that this kind of Web sites are
always well positioned, usually on top, and are also
the most visited since they are the gate to the
company and the related products and services.
Nevertheless, they are not always the most
interesting or truthful sources of information,
because negative comments on products can be
removed. In this case, an independent forum or blog
could be a good information sources for reviews but
these are not usually highly ranked by Google unless
they have a high traffic rate.
5 CONTRIBUTIONS TO THE
FIELD OF REPUTATION
ASSESSMENT
The analysis described in this paper originates from
the need of determining the influence of reputation
over the selection of relevant and reliable sources for
REPUTATION-BASED SELECTION OF WEB INFORMATION SOURCES
35

the analysis of interesting entities. Some work has
been already devoted to the trust of Web resources
(Artz and Gil, 2007), focusing on content and
making a distinction between content trust and entity
trust. Trustworthiness on the Web is also identified
with popularity: this equation led to the success of
the PageRank algorithm (Brin and Page, 1998), even
if it does not necessarily conveys dependable
information since highly ranked Web pages could be
spammed. To overcome this issue, new algorithms
are based on hub and authority mechanisms in the
field of Social Network Analysis (SNA) (Kleinberg,
1999). Especially when considering services such as
forums, in our approach we assume that it is
important to evaluate even a single contribution:
SNA can be used to evaluate each author’s
trustworthiness (Skopik et al., 2009).
The selection of sources providing dependable
information has been scarcely based on the
definition of methods for assessing both software
and data quality. However, the concept of reputation
is the result of the assessment of several properties
of information sources, including accuracy,
completeness, timeliness, dependability, and
consistency (Batini et al., 2009). The data quality
literature provides a consolidated body of research
on the quality dimensions of information, their
qualitative and quantitative assessment, and their
improvement (Atzeni et al., 2001). Trust-related
quality dimensions, and in particular reputation, are
however still an open issue (Gackowski, 2006).
In (Mecella et al., 2003), authors propose an
architecture that evaluates the reputation of the
different sources owned by companies involved in
the cooperative process on the basis of the quality of
the information that they exchange. In our
approach, reputation is typically referred to each
information source and represents a) an a-priori
assessment of the reputation of the information
source based on the source’s authority in a given
field and b) an assessment of the source’s ability to
offer relevant answers to user queries based on
historical data on the source collected by the broker
as part of its service. This approach is original in that
it defines reputation as a context and time dependent
characteristic of information sources and leverages
the ability to keep a track record of each source’s
reputation over time. The reputation of a source and,
more in general, the quality of the data provided, can
be the discriminating factor for the selection of the
source when multiple sources are able to offer the
same data set.
6 FINAL DISCUSSION
This paper has presented the results of an analysis
that we have conducted to identify the relevance of
data quality and reputation metrics over search
rankings. Results show that different rankings occur
when such metrics are taken into account and, more
specifically, that in absence on reputation metrics
some items can be misjudged.
The primary goal of our experiment was not to
identify lacks in the ranking strategies of current
search engines; rather we aimed at proving how the
assessment of reputation can improve the selection
of information sources. Our assumption is that the
reputation-based classification of information
sources and the assessment of the quality of their
information can help Web users to select the most
authoritative sources. This is especially relevant in
the context of the market monitoring, where Web
users retrieve and access Web resources to get an
idea about a key interest topic, but also to take some
kind of choice/decision.
The experiment described in this paper is
situated within a larger project, INTEREST
(INnovaTivE solutions for REputation based self-
Service environments), which aims at promoting
reputation as a key driver for the selection of
dependable information sources (Barbagallo et al.,
2009; Barbagallo et al., 2010). INTEREST focuses
on the definition of technologies and methodologies
to facilitate the creation of dashboards through
which users can easily integrate dependable services
for information access and analysis. The selection of
services is based on data quality and reputation.
Thanks to mashup technologies (Yu et al., 2007), the
selected services can then be flexibly composed to
construct a personal analysis environment. With
respect to traditional dashboards, characterized by a
rigid structure, INTEREST introduces: i) the
possibility to adopt sources scouted from the Web
and assessed with respect to their quality and
reputation; ii) the possibility to quickly and easily
create situational views (Balasubramaniam et al.,
2008) over interesting information, by mashing up
selected dependable services.
Our current efforts are devoted to refining the
method for reputation assessment, for example by
introducing term clustering to improve the analysis,
and by defining a global reputation index resulting
from the aggregation of the reputation metrics
proposed in this paper. We are conducting an
extensive validation of our method for reputation
assessment, which is based on the analysis of a huge
collection of contents crawled by well-know blogs
ICEIS 2010 - 12th International Conference on Enterprise Information Systems
36

and forums (e.g., Twitter). We are also conducting
studies with samples of users to prove whether the
reputation-based rankings of blogs and forums, as
deriving from our reputation metrics, are in line with
the quality of these information sources as perceived
by users. Our future work is projected toward the
creation of the INTEREST platform, in which the
fusion of reputation analysis and mashup
technologies can provide an effective environment
for information composition and analysis.
REFERENCES
Artz, D., Gil, Y., 2007. A survey of trust in computer
science and the Semantic Web. J. Web Sem. 5(2): 58-
71.
Anholt, S., 2009. Competitive Identity: The New Brand
Management for Nations, Cities and Regions.
Palgrave Macmillan, Eds.
Atzeni, P., Merialdo, P., Sindoni, G., 2001. Web site
evaluation: Methodology and case study.
DASWIS2001: International Workshop on data
Semantics in Web Information systems, Yokohama,
Japan.
Bagozzi, R. P., Yi, Y., 1988. On the evaluation of
structural equation models, Journal of the Academy of
Marketing Science, vol. 16, no. 1, pp. 74-94.
Barbagallo, D., Cappiello, C., Francalanci, C., Matera, M.,
2009. Reputation Based Self-Service Environments,
ComposableWeb 2009: International Workshop on
lightweight integration on the Web, San Sebastian,
Spain, 2009, pp.12-17.
Barbagallo, D., Cappiello, C., Francalanci, C., Matera, M.,
2010. A Reputation-based DSS: the INTEREST
Approach, ENTER: International Conference On
Information Technology and Travel&Tourism,
February 2010.
Batini, C., Cappiello, C., Francalanci, C., Maurino, A.,
2009. Methodologies for data quality assessment and
improvement. ACM Computing Surveys, 41(3).
Balasubramaniam, S., Lewis, G. A., Simanta S., Smith, D.
B., 2008. Situated Software: Concepts, Motivation,
Technology, and the Future. IEEE Software, Nov-Dec
2008, pp. 50-55.
Brin, S., Page, L., 1998. The Anatomy of a Large-Scale
Hypertextual Web Search Engine. Computer
Networks, 30(1-7): 107-117.
Chen, X., Ding, C., 2008. QoS Based Ranking for Web
Search. Proc. of International Conference on Web
Intelligence and Intelligent Agent Technology, pp.
747-750.
Chen, K., Zhang, Y., Zheng, Z., Zha, H., Sun, G., 2008.
Adapting ranking functions to user preference. Data
Engineering Workshop, ICDEW, pp.580-587.
DeStefano, D. LeFevre, J. A., 2007. Cognitive load in
hypertext reading: A review. Computers in Human
Behavior 23 (3), pp. 1616–1641.
Fornell, C., Larcker, D. F., 1981. Evaluating structural
equation models with unobservable variables and
measurement errors: Algebra and statistics. Journal of
Marketing Research, vol. 18, no. 3, pp. 383-388.
Gackowski, Z., 2006. Redefining information quality: the
operations management approach. Eleventh
International Conference on Information Quality
(ICIQ06). Boston, MA, USA, 399-419.
Gupta, S., Jindal, A., 2008. Contrast of link based web
ranking techniques. International Symposium on
Biometrics and Security Technologies (ISBAST), pp.
1-6.
Hair, J., Anderson, R., Tatham, R., Black, W., 1998.
Multivariate data analysis (5th ed.). Upper Saddle
River, New Jersey: Prentice Hall.
Jaccard, J., Choi, K. W., 1996. LISREL approaches to
interaction effects in multiple regression. Thousand
Oaks, CA: Sage Publications.
Jiang, S., Zilles, S., Holte, R., 2008. Empirical Analysis of
the Rank Distribution of Relevant Documents in Web
Search. International Conference on Web Intelligence
and Intelligent Agent Technology, pp. 208-213.
Kendall, M. G., Babington Smith, B., 1938. Randomness
and Random Sampling Numbers. Journal of the Royal
Statistical Society, 101(1), pp. 147-166.
Kleinberg, J. M., 1999. Hubs, authorities, and
communities. ACM Comput. Surv. 31(4es): 5.
Lamberti, F., Sanna, A., Demartini, C., 2009. A Relation-
Based Page Rank Algorithm for Semantic Web Search
Engines. IEEE Transactions on Knowledge and Data
Engineering, 21(1), pp. 123 – 136.
Louta, M., Anagnostopoulos, I., Michalas, A., 2008.
Efficient internet search engine service provisioning
exploiting a collaborative web result ranking
mechanism. IEEE International Conference on
Systems, Man and Cybernetics, pp. 1477-1482.
Mare, R. D., 1980. Social background and school
continuation decisions. Journal of, the American
Statistical Association, 75, pp. 295-305.
Mecella, M., Scannapieco, M., Virgillito, A., Baldoni, R.,
Catarci, T., Batini, C., 2003. The DaQuinCIS Broker:
Querying Data and Their Quality in Cooperative
Information Systems. J. Data Semantics, 1, pp. 208-
232.
Skopik, F., Truong, H. L., Dustdar, S., 2009. Trust and
Reputation Mining in Professional Virtual
Communities. International Conference on Web
Engineering, pp. 76-90.
Yu, J., Benatallah, B., Saint-Paul, R., Casati, F., Daniel,
F., Matera, M., 2007. A framework for rapid
integration of presentation components. International
Conference on the World Wide Web, pp. 923-932.
Yu, J., Benatallah, B., Casati, F., Daniel, F., Matera, M.
Saint-Paul, R., 2007. Mixup: A Development and
Runtime Environment for Integration at the
Presentation Layer. International Conference on Web
Engineering, pp. 479-484
REPUTATION-BASED SELECTION OF WEB INFORMATION SOURCES
37
