
ASSESSMENT OF THE CHANGE IN THE NUMBER
OF NEURONS IN HIDDEN LAYERS OF NEURAL NETWORKS
FOR FAULT IDENTIFICATION IN ELECTRICAL SYSTEMS
David Targueta da Silva, Pedro Henrique Gouvêa Coelho, Joaquim Augusto Pinto Rodrigues
and Luiz Biondi Neto
State University of Rio de Janeiro, FEN/DETEL
R. S. Francisco Xavier, 524/Sala 5006E, Maracanã, RJ, 20550-900, Brazil
Keywords: Computational Intelligence, Artificial Neural Network, Identification of Faults, Electrical Systems, Hidden
Layers.
Abstract: This work describes performance evaluation of ANNs (Artificial Neural Networks) used to identify faults in
electrical systems for several number of neurons in the hidden layers. The number of neurons in the hidden
layers depends on the complexity of the problem to be represented. Currently, there are no reliable rules for
determining, a priori, the number of hidden neurons, so that such number depends largely on the experience
of the practitioners who are designing the ANNs. This paper reports experiment results using neural
networks varying the number of hidden neurons to aid the neural network user to find an adequate
configuration in terms of number of neurons in the hidden layers so that ANNs be more efficient
particularly for fault identification applications.
1 INTRODUCTION
The need for assessing the performance of ANNs in
terms of the number of neurons in the hidden layers
emerged during the development of a system for
identifying faults in electrical systems. This work is
described briefly below.
The research was divided into the following
main parts: (i) study of power systems and the
problem of identification of its faults, (ii) study of
artificial intelligence and intelligent systems and (iii)
system model to support and test ANN
configurations and learning algorithms. It is not
difficult to notice the increasing use of energy as a
promoter of economic and social development. This
is essential either for large industries, banks and all
kinds of business or to homes, even the humblest of
them. There is a growing demand for high quality
energy needed to also supply an increasing number
of digital equipment.
The prompt identification of failures can help to
achieve these requirements. The operators of
electrical systems may have trouble in identifying
faults properly and make the right decisions on
corrective actions to be adopted, which could lead to
fault misidentification. The investigation of the
problem also involves interviews with experts in the
area, aiming not only to grasp the specific
knowledge about the problem but also to find the
best solution to solve it. The system modelling and
system development characterizes the system
architecture so that simulations are performed to test
the ANN configurations.
2 SYSTEM MODEL
A typical electrical substation was chosen to be
investigated as detailed in sequence.
That substation was divided into functional units
called bays. For this substation, there are five types
of bays for a total number of 19 bays. Table 1 shows
the general data for those bays, such as the number
of alarms and faults defined for each of those bays.
That is a typical problem of pattern classification,
where ANNs can be used to map groups of alarms
on failures.
309
Targueta da Silva D., Henrique Gouvêa Coelho P., Augusto Pinto Rodrigues J. and Biondi Neto L. (2010).
ASSESSMENT OF THE CHANGE IN THE NUMBER OF NEURONS IN HIDDEN LAYERS OF NEURAL NETWORKS FOR FAULT IDENTIFICATION IN
ELECTRICAL SYSTEMS .
In Proceedings of the 12th International Conference on Enterprise Information Systems - Artificial Intelligence and Decision Support Systems, pages
309-313
DOI: 10.5220/0002910203090313
Copyright
c
SciTePress
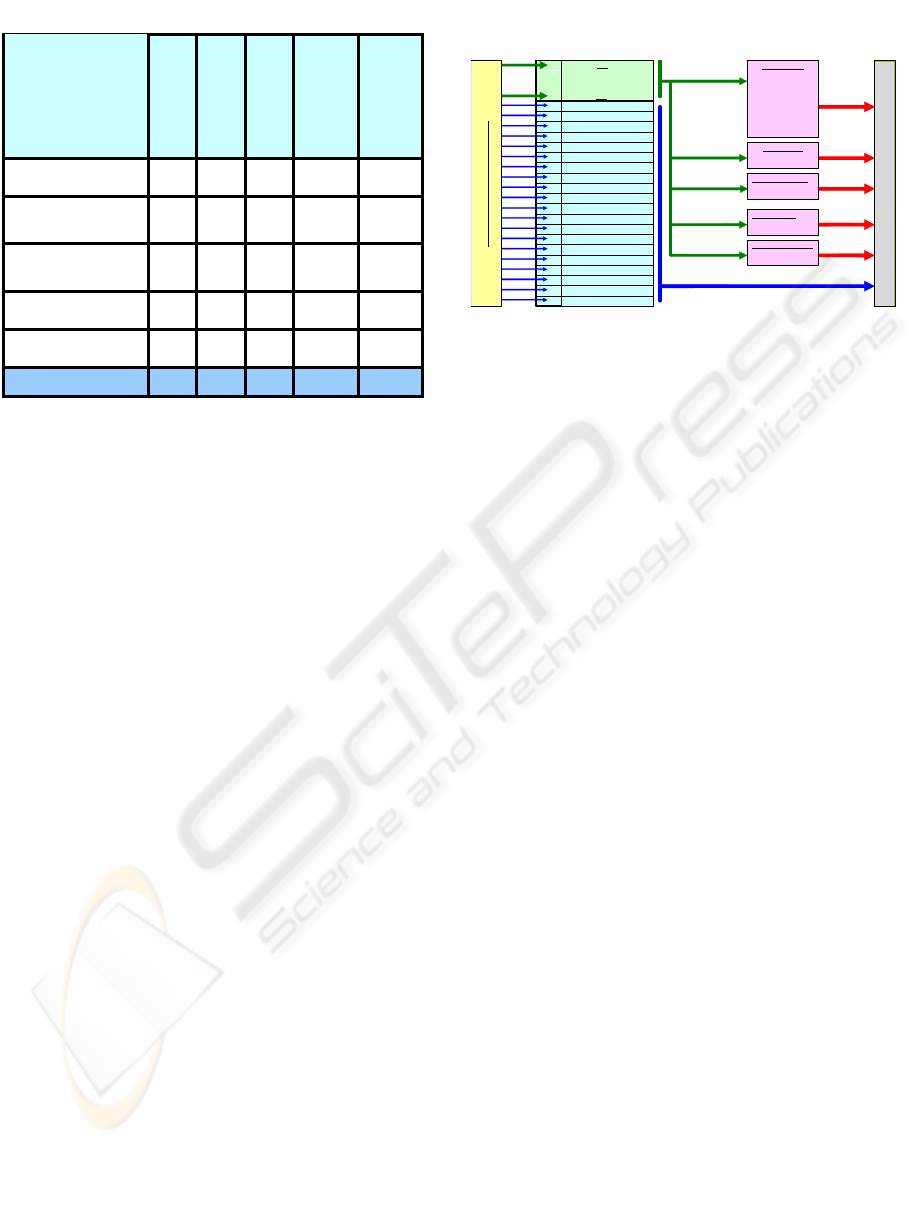
Table 1: General Data of Bays in a Substation.
Type of
BAY
Quantity.
Alarms for
a Bay
Failures
to a Bay
Total
alarms by
Ba
y
Total
failures
Ba
y
Feeder 11 16 20 176 220
Capacitor
Bank
2 19 20 38 40
General
Secondary
2 19 62 38 124
Line 2 13 32 26 64
Backward 2 67 157 134 314
TOTAL: 19 134 291 412 762
3 INTELLIGENT SYSTEM
MODELLING
Intelligent System modelling and development
involves defining the architecture and simulation
strategies that will define the necessary tests and
simulations (Silva, D.T., 2008).
The first alternative uses a single neural network
that receives all the alarms and returns their failures.
Such neural network would have 412 inputs (alarms)
and would deal with 762 faults. It resuls in a very
large neural network and would require too much
time to train it.
As the substation can be divided into functional
blocks, called bays which are repeated in other
substations, that approach was adopted in order to
characterize the system identification failures. The
adopted model comprises a set of ANNs, responsible
for identifying the faults.
The advantage of using several ANNs, one for
each functional block, or bay, will be apparent later
on.
The general system diagram is depicted in figure
1.
The identification of faults is carried out by a set of
five ANNs, each specializing in a bay of the
electrical system (Feeder, Capacitor Bank, General
Secondary Line and Backward). Each ANN has the
function to map groups of alarms into specific
failures. It is, therefore, a typical problem of pattern
classification (Biondi, 1997), where each neural
network is trained using the backpropagation
algorithm. The used patterns for training are
provided by experts, consisting of combinations of
412 alarms, for a total number of 762 faults.
Figure 1: Failure identification System diagram.
For each type of bay, two ANNs models were
considered. For the first model, the first layer had a
number of output neurons which was the same as
the number of possible failures for that bay. The
second model had a single neuron in the output.
4 NUMBER OF NEURONS IN
THE HIDDEN LAYER
The number of neurons in the input layer is
determined by the number of alarms in a bay, i.e.,
there is one neuron for each alarm and the number of
neurons in the output layer equals the number of
possible failures for a given bay, such as the case of
an ANN with multiple neurons in the output
according to the first model.
The number of neurons in the input and output
are fixed, so this paper will consider changing the
number of neurons in the hidden layers.
It should be noted that for the ANN with multiple
neurons in the output layer there are two hidden
layers and the ANN with one neuron in the output
there are three hidden layers.
In order to better organize the simulations equal
numbers of hidden layers neurons were used,
although the simulations could be easily adapted for
testing with different numbers of neurons in those
layers.
Now some simulations results are presented
involving some investigated ANNs.
Figure 2 shows a Feeder bay ANN with multiple
neurons in the output.
AL 001-176
AL 177-214
AL 215-252
AL 253-278
AL 279-412
FL 001-220
FL 221-260
FL 261-384
FL 385-448
FL 449-762
TAG’S 001-020
INTERFACE # 1
RNA BAY BCO
BCO 3
BCO 4
RNA BAY ALIM
PAR 5
PAR 22
PAR 17
PAR 11
PAR 14
PAR 8
PAR 6
PAR 15
PAR 9
PAR 7
PAR 10
RNA BAY GER. SEC.
GERAL T3
GERAL T4
RNA BAY LINH
A
LI ALC/ADR 3
LI ALC/ADR 1
RNA BAY RET
A
GUARD
A
LI ALC/ADR 3
LI ALC/ADR 1
.
.
DIGITAL SCADA DECODIFICADO
•
ALARME 001
• ALARME 412
o TAG 20 - OPERAÇÃO NORMAL
o TAG 19 - RET
A
-LI ALC/ADR 1
o TAG 18 - RET
A
-LI ALC/ADR 3
o TAG 17 - LI ALC/ADR 1
o TAG 16 - LI ALC/ADR 3
o TAG 15 - GERAL T4
o TAG 14 - GERAL T3
o TAG 13 - BCO 4
o TAG 12 - BCO 3
o TAG 11 - PAR 10
o TAG 10 - PAR 7
o TAG 09 - PAR 9
o TAG 08 - PAR 15
o TAG 07 - PAR 6
o TAG 06 - PAR 8
o TAG 05 - PAR 14
o TAG 04 - PAR 11
o TAG 03 - PAR 17
o TAG 02 - PAR 22
o TAG 01 - PAR 5
ICEIS 2010 - 12th International Conference on Enterprise Information Systems
310
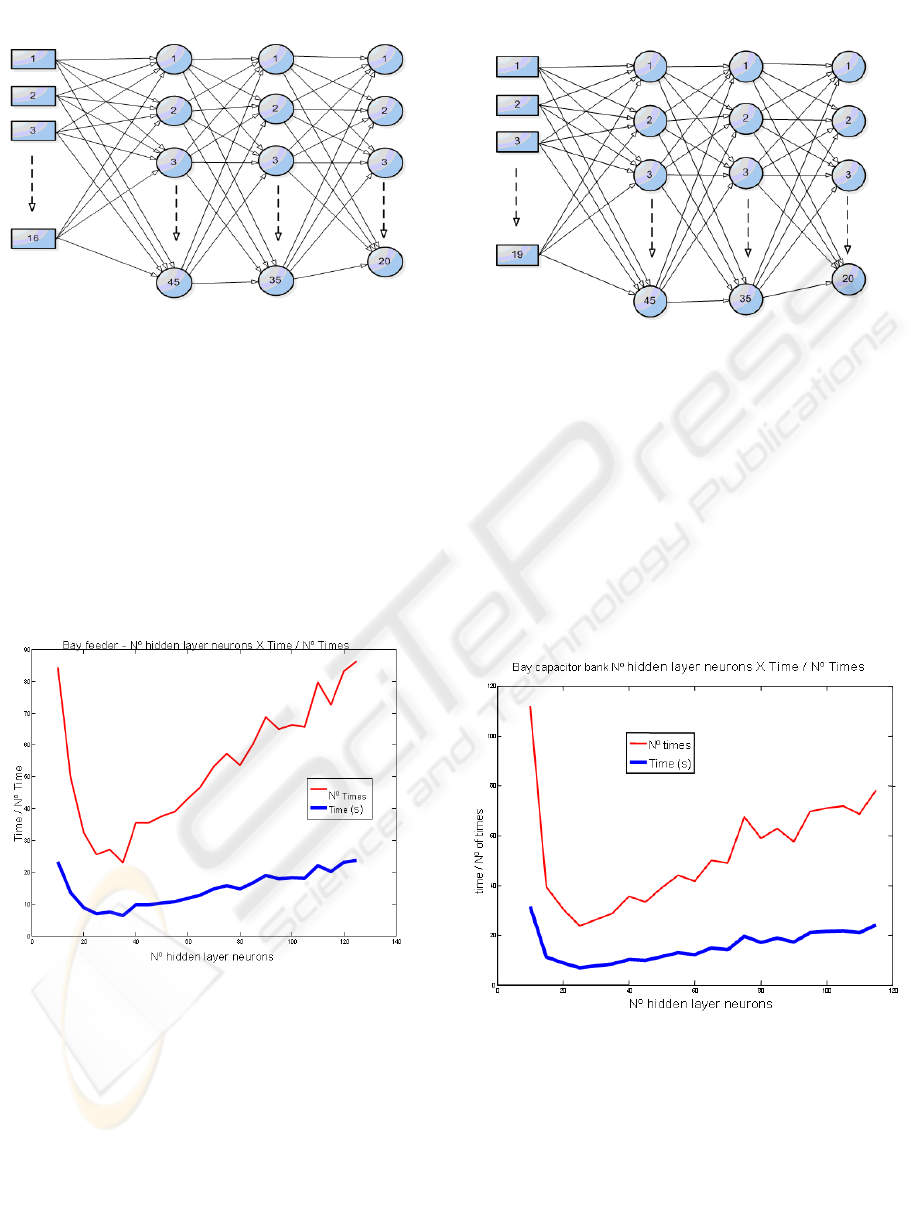
Figure 2: Feeder bay ANN with multiple neurons in the
output.
The main characteristics used in the training
simulation test for the feeder bay were:
• Learning Algorithm: Resilient;
• Minimum number of neurons in all hidden
layers: 10;
• Maximum number of neurons in the inner layers:
125;
• Number of tests for each number of neurons: 10;
• Step increase of the number of neurons in
relation to the last setting: 5;
Figure 3: Hidden layers neurons X time & epochs for
feeder bay and multiple neurons output ANN.
Figure 3 shows that the best configuration in terms
of minimum number of epochs and training time is
the one with 35 neurons in the hidden layers. The
resulting training time was about 7 seconds.
Figure 4 depicts a Capacitor bank bay ANN with
multiple output neurons.
Figure 4: Capacitor bank bay ANN with multiple neurons
in the output.
For training such neural network the simulation test
parameters were:
• Learning algorithm: Resilient
• Minimum number of neurons in all hidden
layers: 10;
• Maximum number of neurons in all hidden
layers: 115;
• Number of tests for each number of neurons: 10;
• Step increase of the number of neurons in
relation to the last setting: 5;
Figure 5: Hidden layers neurons X time & epochs for
capacitor bank bay and multiple neurons output ANN.
One can see in figure 5 that the best configuration is
the one with 25 neurons in the hidden layers and the
corresponding training time is about 7 seconds and
an average number of epochs of 23.8.
Next, a line bay ANN is considered with
multiple output neurons as shown in figure 6.
2º Hidden
Layer
1º Hidden
Layer
Epochs
Training time
Epochs
Training time
Input Layer
Alarm
1º Hidden
Layer
2º Hidden
Layer
Output
Layer
Input Laye
r
Alarms
Output
Layer
ASSESSMENT OF THE CHANGE IN THE NUMBER OF NEURONS IN HIDDEN LAYERS OF NEURAL
NETWORKS FOR FAULT IDENTIFICATION IN ELECTRICAL SYSTEMS
311
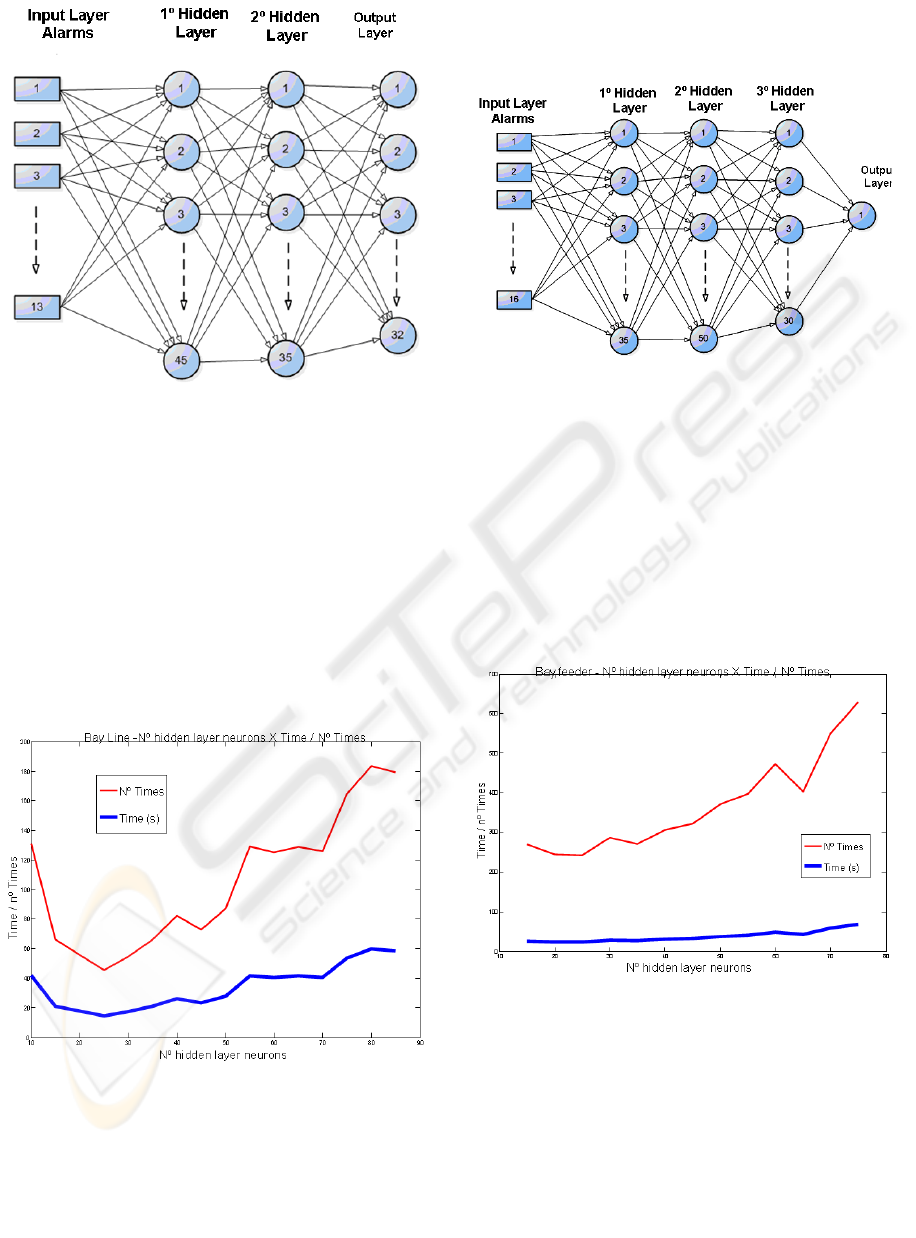
Figure 6: Line bay ANN with multiple neurons in the
output.
The main characteristics used in the training
simulation test for the line bay were:
• Learning Algorithm: Resilient
• Minimum number of neurons in all the hidden
layers: 10;
• Maximum number of neurons in all the hidden
layers: 85;
• Number of tests for each number of neurons: 10;
• Step increase of the number of neurons in
relation to the last setting: 5;
Figure 7: Hidden layers neurons X time & epochs forline
bay and multiple neurons output ANN.
Figure 7 shows that the best configuration is the one
with 25 neurons in the hidden layers. The training
time was 14.5 seconds and the corresponding
number of epochs was 45.4.
The last simulation test that was carried out
considered a feeder bay ANN with one output
neuron.
Figure 8: Feeder bay ANN with one output neuron.
For training such neural network the simulation test
parameters were:
• Learning Algorithm: Resilient
• Minimum number of neurons in all the hidden
layers: 15;
• Maximum number of neurons in all the hidden
layers: 75;
• Number of tests for each number of neurons: 10;
• Step increase of the number of neurons in
relation to the last setting: 5;
Figure 9: Hidden layers neurons X time & epochs for
feeder bay and one output neurons ANN.
It can be seen in figure 9 that the best ANN
configuration in the sense of minimum training time
is the one with 20 neurons in the hidden layers. The
corresponding training time was 23 seconds.
Concerning the number of epochs, the best ANN
with such a minimum number is the one with 20
neurons in the hidden layers which yielded 242
epochs.
Epochs
Training time
Epochs
Training time
ICEIS 2010 - 12th International Conference on Enterprise Information Systems
312

5 CONCLUSIONS
This paper presented preliminary results based on
experiments from simulations involving the training
of ANNs with different configurations in terms of
number of neurons in the hidden layers. The
applications concerned fault identification in
electrical systems. The aim of such experiments was
to search for some evidence and patterns that might
be useful for finding procedures and methods for
determining the number of neurons in the hidden
layers of feed forward ANNs. The simulation tests
indicated some regularity concerning the best
selected ANN in terms of training time.
There is some ongoing research done worth
mentioning e.g. Ostafe (Ostafe, 2005) uses a
clustering technique to help in the determination of
the optimal number of neurons in the hidden layer.
More recently Xu and Chen (Xu, 2008) proposes an
elegant way to find such an optimal number using a
complexity regularization approach for data mining
applications. They find an expression of the number
of neurons in the hidden layer which is based on the
target function which is unknown on most practical
problems. Therefore they propose to optimize a
similar such an expression to derive the number of
neurons from the observed data e.g., the training
pairs, using a complexity regularization approach.
Future research directions include to properly
select the training data and using some variations on
the optimization criteria performed by Xu and Chen
(Xu, 2008) and also combine part of the simulations
tests described in the previous section to aid in
assessing the efficiency of the optimization process.
REFERENCES
Biondi, L. N., 1997. Hybrid System for Decision Support
for Detection and Fault Diagnostics in Electrical
Networks. M.Sc. Dissertation, PUC-Rio, Rio de
Janeiro, R.J., Brazil. In Portuguese.
Silva, D. T., 2008. Decision Support System for Fault
Identification in Electrical Energy Distribution
Systems Networks Using Artificial Neural Networks.
M. Sc. Dissertation, State University of Rio de
Janeiro, R.J., Brazil. In Portuguese.
Ostafe, D., 2005. Neural Network Hidden Layer Number
Determination Using Pattern Recognition Techniques.
In Proceedings of the 2nd Romanian-Hungarian Joint
Symposium on Applied Computational Intelligence
(SACI 2005).
Xu, S., and Chen, L., 2008. A Novel Approach for
Determining the Optimal Number of Hidden Layer
Neurons for FNN’s and Its Application in Data
Mining. In Proceedings of the 5th International
Conference on Information Technology and
Applications (ICITA 2008).
ASSESSMENT OF THE CHANGE IN THE NUMBER OF NEURONS IN HIDDEN LAYERS OF NEURAL
NETWORKS FOR FAULT IDENTIFICATION IN ELECTRICAL SYSTEMS
313
