
CLASSIFICATION OF POWER QUALITY DISTURBANCES VIA
HIGHER-ORDER STATISTICS AND SELF-ORGANIZING NEURAL
NETWORKS
Juan Jos´e Gonz´alez de la Rosa, Jos´e Carlos Palomares, Agust´ın Ag¨uera
Univ. C´adiz, Electronics Area, Research Group PAIDI-TIC-168
EPSA, Av. Ram´on Puyol S/N, E-11202-Algeciras-C´adiz, Spain
Antonio Moreno Mu˜noz
Univ. C´ordoba, Electronics Area, Research Group PAIDI-TIC-168
Campus Rabanales, Ed. L. Da Vinci, E-14071-C´ordoba, Spain
Keywords: Higher-Order Statistics (HOS), Neural classifiers, Power-quality.
Abstract: This work renders the classification of Power Quality (PQ) disturbances using fourth-order sliding cumulants’
maxima as the key feature. These estimators are calculated over high-pass filtered real-life signals, to avoid
the low-frequency 50-Hz sinusoid. Four types of electrical AC supply anomalies constitute the starting grid of
a competitive layer performance, which manages to classify 90 signals within a 2D-space (whose coordinates
are the minima and the maxima of the sliding cumulants calculated over each register). Four clusters have
been clearly identified via the competitive network, each of which corresponds to a type of anomaly. Then, a
Self-Organizing Network is conceived in order to guess additional classes in the feature space. Results suggest
the idea of two additional sets of signals, which are more related to the degree of signals’ degeneration than to
real new groups of anomalies. We collaterally conclude the need of additional features to face the problem of
subclass division. The experience sets the foundations of an automatic procedure for PQ event classification.
1 INTRODUCTION
Power Quality (PQ) analysis is becoming a key factor
for the economy because equipment is highly sensi-
tive to the power line signal’s imperfections (Moreno
and et al, 2007; IE3, 1995b). As a consequence, mal-
functioning not only has to be detected, but also pre-
dicted and diagnosed, to identify the cause and pre-
vent the system from a similar shock. This is reflected
a posteriori in an increase in the amount and qual-
ity of the industrial production. The solution for a
PQ problem implies the acquisition and monitoring
of long data records from the energy distribution sys-
tem, along with a detection and classification strat-
egy, which allows the identification of the cause of
these voltage anomalies. These perturbations can be
considered as non-stationary transients, so it is nec-
essary a battery of observations to obtain a reliable
characterization. The goal of the signal processing
is to get a feature vector from the target data, which
constitute the input to the computational intelligence
modulus, with the task of classification. Traditional
measurement algorithms are mainly based in spec-
tral analysis and wavelet transforms. Complementary
second-order methods are based on the independence
of the spectral components and the evolution of the
spectrum in the time domain. Others are threshold-
based functions, linear classifiers and Bayesian net-
works (De la Rosa et al., 2009, ).
Recent works are bringing a higher-order statis-
tics (HOS) based strategy, dealing with PQ analysis
(De la Rosa et al., 2007;
¨
Omer Nezih Gerek and Ece,
2006, ), and other fields of Technology (De la Rosa
et al., 2004; De la Rosa et al., 2008, ). They are based
in the following argument. Without perturbation, the
50-Hz of the voltage waveform exhibits a Gaussian
behavior. Deviations can be detected and character-
ized via HOS; non-Gaussian processes need at least
3
rd
and 4
th
-order statistical characterization in order
to be characterized, because 2
nd
-order moments and
cumulants could be not capable of differentiate non-
Gaussian events.
Concretely, the problem of differentiating be-
tween a transient of long duration named oscillatory
183
José González de la Rosa J., Carlos Palomares J., Agüera A. and Moreno Muñoz A. (2010).
CLASSIFICATION OF POWER QUALITY DISTURBANCES VIA HIGHER-ORDER STATISTICS AND SELF-ORGANIZING NEURAL NETWORKS.
In Proceedings of the 7th International Conference on Informatics in Control, Automation and Robotics, pages 183-190
DOI: 10.5220/0002915101830190
Copyright
c
SciTePress

(within a signal period) and a short duration transient,
or impulsive transient (25 per cent of a cycle), has
been outcome under controlled conditions in (De la
Rosa et al., 2009, ), and the idea of differentiating
between healthy signals and signals with transients
was pointed out and accomplished in (De la Rosa
and Mu˜noz, 2009, ). This problem was previously
described in (Bollen et al., 2005) and matches HOS
category, in the following sense. The short transient
could also bring the 50-Hz voltage to zero instantly
and, generally affects the sinusoid dramatically. By
the contrary, the long-duration transient could be con-
sidered as a modulating signal (the 50-Hz signal is
the carrier), and is associated to load charges (Bollen
et al., 2005). Similarly, considering the statistical de-
viation from the Gaussian behavior that power dis-
turbances add to the power line, it seems appropri-
ate to launch the task of higher-order classification of
more types of electrical anomalies, also considering
the confluence of various perturbations in the same
measurement register.
The contribution of this paper consists of the ap-
plication of fourth-order central cumulants at zero
lags to characterize PQ events in the time-domain
(measuring maxima and minima values of higher-
order cumulant sequences), along with the use of
competitive layer and SOM as the classification tools.
Four different sets of signals have been a priori estab-
lished and confirmed using a competitive layer. The
first set comprises healthy sine-waves from the power
50 Hz-line. Then, we consider signals with oscil-
latory mono-frequency (long duration) transients of
relatively high amplitude; we also consider for the
second set the signals with harmonics, which dis-
tort the shape of the sine-wave producing a not very
high valued fourth-order cumulant. The third group
gathers features’ anomalies which appeared simulta-
neously in a signal, corresponding to impulsive tran-
sients (of short duration), and/or a weak sag (RMS de-
scent), and/or oscillatory high-amplitude events. Fi-
nally, signals clearly affected by high-amplitude im-
pulsive transients and/or deep sags are contained in
the fourth set. Sets ♯3 and ♯4 may be joined in one,
but signals in set ♯4 are clearly more affected and
probably by only one type of perturbation. On the
other hand, signals belonging to set ♯3 are generally
affected by several anomalies. Consequently, four
classes have been established with the possibility od
upgrading the detection towards 6 clusters.
The paper is structured as follows. The following
Section 2 explains the fundamentals of power quality
monitoring. Higher-Order Statistics are outlined then
in Section 3, to be followed by a summary on compet-
itive layers and self-organizing networks in Section .
Finally, results are presented in Section 5 and conclu-
sions are drawn in Section 6.
2 POWER-QUALITY
CHARACTERIZATION
As more and more electronic equipments enter the
residential areas and business environment, the sub-
jects related to PQ and its relationship to vulnerabil-
ity of installations is becoming an increasing concern
to the users. Particularly has arisen and increased the
need to protect sensitive electronic equipment from
damaging over-voltages. Things like lightning, large
switching loads, non-linear load stresses, inadequate
or incorrect wiring and grounding or accidents in-
volving electric lines, can create problems to sensitive
equipment, if it is designed to operate within narrow
voltage limits, or if it does not incorporate the capa-
bility of filtering fluctuations in the electrical supply
(Bollen et al., 2005; Moreno and et al, 2007; Paul,
2001).
The two main regulated aspects of PQ are the fol-
lowing:
• Technical PQ, which includes: Continuity of sup-
ply or reliability (long interruptions) and Voltage
quality (voltage level variations and voltage dis-
turbances).
• Commercial services associated to the wires (such
as the delay to get connected to the grid, etc.) as
well as commercial services for energy retail to
regulated customers.
Assessment of voltage quality and power distur-
bances involves looking at electromagnetic devia-
tions of the voltage or current from the ideal single-
frequency sine wave of constant amplitude and fre-
quency. A consistent set of definitions can be found in
(IE3, 1995b). Regulation in European countries pro-
poses to use the standard EN-50160 to define the volt-
age quality ranges. This norm actually describes the
electricity through the technical characteristics that it
has to fulfill to be considered as a compliant prod-
uct. But there are a lot of undefined aspects; besides
the fact that most of the regulator has yet to publish
the technical criteria to measure and control all the
voltage quality characteristics and decide what would
be the penalization. The fact is that the only voltage
quality aspect that is now enforced is the maximum
voltage level variation settled to ± 7 % (which is ac-
tually different to the ±10 % fixed on the EN-50160).
But even this aspect is not yet controlled and there is
not any defined procedure to determine if the limit has
been reached.
ICINCO 2010 - 7th International Conference on Informatics in Control, Automation and Robotics
184

On the other hand, the presence of disturbances
on power distribution also affect the energy efficiency
of the system. As far as energy efficiency is con-
cerned in a power distribution system, the two dom-
inant factors in PQ are its unbalanced and harmonic
distortion. In an electrical installation when single-
phase loads (especially those with non-linear charac-
teristics), are not evenly and reasonably distributed
among the three-phases of the supply, we are in the
presence of unbalance. Voltage unbalance in a three-
phase system causes three-phase motors to draw un-
balanced current. This phenomenon causes additional
power losses in conductors and motors and can cause
the rotor of a motor to overheat.
Among all categories of electrical disturbances,
the voltage sag (dip) and momentary interruption are
the nemeses of the automated industrial processes.
Voltage sag is commonly defined as any low voltage
event between 10 and 90% of the nominal RMS volt-
age lasting between 0.5 and 60 cycles. Momentary
voltage interruption is any low-voltage event of less
than 10% of the nominal RMS voltage lasting be-
tween 0.5 cycles and 3 seconds. In medium voltage
distribution networks, voltage sags are mainly caused
by power system faults. Fault occurrences elsewhere
can generate voltage sags affecting consumers differ-
ently according to their location in the electrical net-
work. Even though the load current is small compared
to the fault current, the changes in load current dur-
ing and after the fault strongly influence the voltage
at the equipment terminals. It has been discovered
that the 85% of power supply malfunctions attributed
to poor PQ are caused by voltage sag or interruptions
of fewer than one second duration. Starting large mo-
tors can also generate voltage sags, although usually
not so severe. In comparison with interruptions, volt-
age sags affect a larger number of customers and for
some customers voltage sags may cause extremely se-
rious problems. These can create problems to sen-
sitive equipment if it is designed to operate within
narrow voltage limits, or it does not have adequate
ride-through capabilities to filter out fluctuations in
the electrical supply.
Over-voltage is an RMS increase in the AC volt-
age, at the power frequency, for durations greater than
a few seconds, and can be the result of a programmed
utility operation, or the effect of an external eventu-
ality (IE3, 1995a). Under normal operating condi-
tions, the steady-state voltage is regulated by the util-
ity within a limits band accepted by the EN-50160.
Deviations from these limits are rare, and the utility
can actuate readily to correct them, if known their oc-
currence, by acting on conventional distribution tech-
nologies, such as tap-changing transformers (Moreno
et al., 2007).
However, under the typical operating conditions
of a power system there is risk of damaging due to
a momentary excess of voltage. Although by them-
selves they would be described as ”abnormal”, it is
possible to distinguish between surges and swells. A
surge is an over-voltage that can reach thousands of
volts, lasting less than one cycle of the power fre-
quency, that is, less than 16 milliseconds. A swell
is longer, up to a few seconds, but does not exceed
about twice the normal line voltage.
Power system surges, based on waveform shapes,
can be classified into ”oscillatory transients” and ”im-
pulsive transients” (IE3, 1995b; Paul, 2001) and they
are the goal of the present research work. Oscilla-
tory transient surges show a damped oscillation with
a frequency range from 400 Hz to 5 kHz or more. Im-
pulsive transient surges present a fast rise time in the
order of 1 ns-10 µs over the steady state condition of
voltage, current or both, that is unidirectional in po-
larity (primarily either positive or negative), reaching
hardly twice the peak amplitude of the signal. They
are damped quickly, presenting a frequency range
from 4 kHz to 5 MHz, occasionally reaching 30 MHz.
Categorization of electrical transients based on
waveform shapes and their underlying causes (or
events) has been studied in (Bollen et al., 2005), and
a few previous studies (De la Rosa et al., 2007;
¨
Omer
Nezih Gerek and Ece, 2006, ) using HOS for feature
extraction of electrical signals have shown the pos-
sibility of distinguish transients based on details be-
yond the second-order. In a real-life 50-Hz power
line signal, it is very common to find these transients.
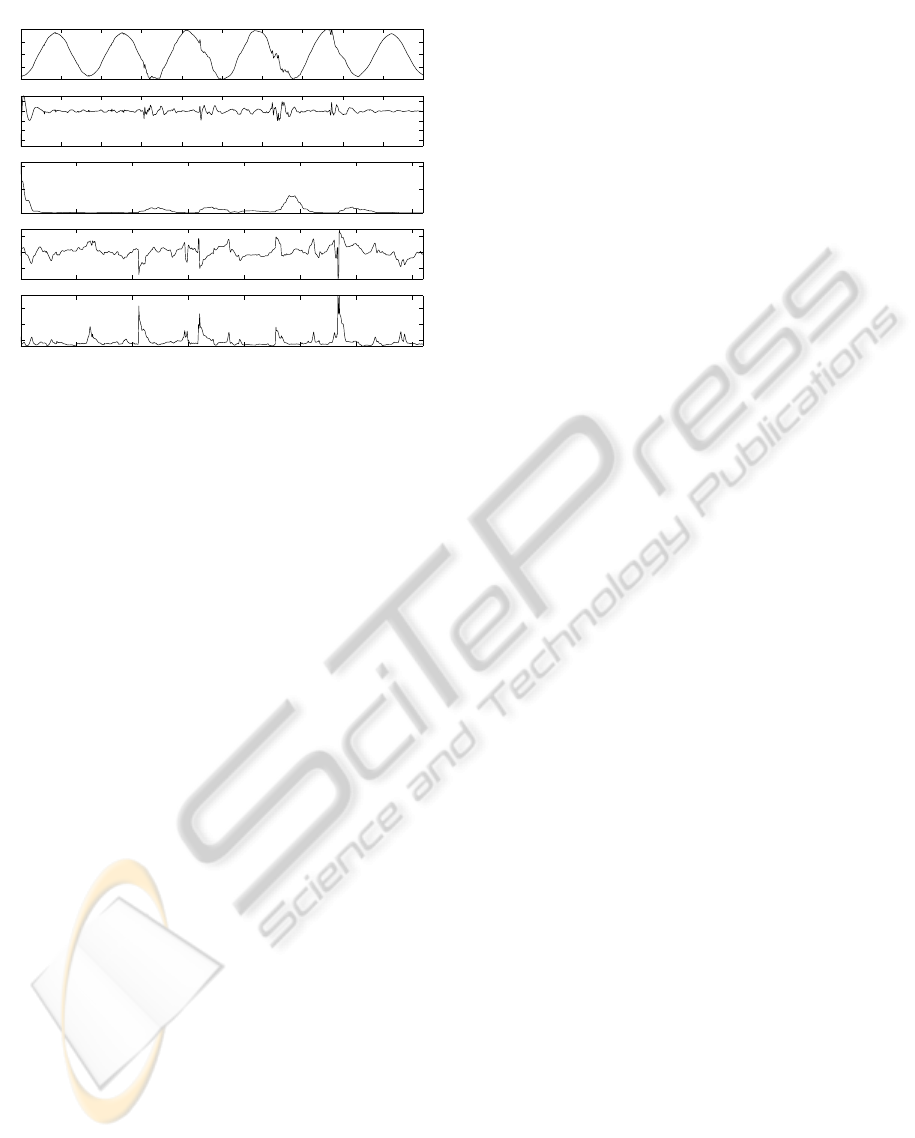
In Fig. 1 we show an example of anomalous signal,
including transients which are not classified between
short-duration and long-duration. We show the com-
putation of three higher-order time-domain statistics
in order to introduce them qualitatively. The second-
order estimator operates as an increase-of-power de-
tector, showing the bumps associated to the increase
of power, which in turn are associated to the anoma-
lies of the power-line sine wave, but the third and
fourth-order sliding cumulants have to be interpreted
further. The most intuitive procedure is to calculate
their maxima and minima.
Once the foundations of PQ have been settled
down, in the following Section we present higher-
order statistics in the time-domain in order to present
the signal processing tool, along with a basic example
which shows the performance of the statistical esti-
mators which have been used in the computation of
the cumulants. This example also motivates the use
of HOS in time-series characterization.
CLASSIFICATION OF POWER QUALITY DISTURBANCES VIA HIGHER-ORDER STATISTICS AND
SELF-ORGANIZING NEURAL NETWORKS
185
0 0.01 0.02 0.03 0.04 0.05 0.06 0.07 0.08 0.09
−0.5
0
0.5
1
Analysis of several transients
0 0.01 0.02 0.03 0.04 0.05 0.06 0.07 0.08 0.09
−0.6
−0.4
−0.2
0
0.2
Time(s)
200 400 600 800 1000 1200 1400
0.02
0.04
Second−order sliding cumulants: power bumps
200 400 600 800 1000 1200 1400
−2
0
2
Third−order sliding cumulants
200 400 600 800 1000 1200 1400
0
5
10
Number of segment
Fourth−order sliding cumulants
Figure 1: Several transients in the power line 50-Hz sine
wave, and the computation of time-domain statistics. The
signal has been previously normalized and high-pass fil-
tered in order to remain with the transients.
3 HIGHER-ORDER STATISTICS
Higher-order cumulants are used to infer new proper-
ties about the data of non-Gaussian processes (De la
Rosa et al., 2004, ). In multiple-signal processing
it is very common to define the combinational rela-
tionship among the cumulants of r stochastic signals,
{x
i
}
i∈[1,r]
, and their moments of order p,p ≤ r, given
by using the Leonov-Shiryaev formula (Nikias and
Mendel, 1993; Mendel, 1991)
Cum(x
1
,...,x
r
) =
∑
(−1)
p−1
· (p− 1)!· E{
∏
i∈s
1
x
i
}
· E{
∏
i∈s
2
x
j
}·· ·E{
∏
i∈s
p
x
k
},
(1)
where the addition operator is extended over all
the partitions, like one of the form (s
1
,s
2
,.. . ,s
p
),
p = 1, 2,· ·· ,r; and (1 ≤ i ≤ p ≤ r); being s
i
a set be-
longing to a partition of order p, of the set of integers
1,...,r.
Let {x(t)} be an rth-order stationary random real-
valued process. The rth-order cumulant is defined as
the joint rth-order cumulant of the random variables
x(t), x(t+τ
1
),..., x(t+τ
r−1
),
C
r,x
(τ
1
,τ
2
,.. . ,τ
r−1
)
= Cum[x(t),x(t + τ
1
),... ,x(t + τ
r−1
)]
(2)
The second-, third- and fourth-order cumulants of
zero-mean x(t) can be expressed via:
C
2,x
(τ) = E{x(t) · x(t + τ)} (3a)
C
3,x
(τ
1
,τ
2
) = E{x(t) · x(t + τ
1
) · x(t + τ
2
)} (3b)
C
4,x
(τ
1
,τ
2
,τ
3
)
= E{x(t)· x(t + τ
1
) · x(t + τ
2
) · x(t + τ
3
)}
−C
2,x
(τ
1
)C
2,x
(τ
2
− τ
3
)
−C
2,x
(τ
2
)C
2,x
(τ
3
− τ
1
)
−C
2,x
(τ
3
)C
2,x
(τ
1
− τ
2
)
(3c)
By putting τ
1
= τ
2
= τ
3
= 0 in Eq. (3), we obtain
γ
2,x
= E{x
2
(t)} = C
2,x
(0) (4a)
γ
3,x
= E{x
3
(t)} = C
3,x
(0,0) (4b)
γ
4,x
= E{x
4
(t)} − 3(γ
2,x
)
2
= C
4,x
(0,0, 0) (4c)
The expressions in Eq. (4) are measurements of
the variance, skewness and kurtosis of the distribu-
tion in terms of cumulants at zero lags (the central
cumulants).
Normalized kurtosis and skewness are defined as
γ
4,x
/(γ
2,x
)
2
and γ
3,x
/(γ
2,x
)
3/2
, respectively. We will
use and refer to normalized quantities because they
are shift and scale invariant. If x(t) is symmetrically
distributed, its skewness is necessarily zero (but not
vice versa); if x(t) is Gaussian distributed, its kurtosis
is necessarily zero (but not vice versa). In the exper-
imental section, results are obtained by using sliding
cumulants, i.d. a moving window in the time domain
over which to compute the each cumulant.
To show the relevance of HOS an illustrative ex-
ample is prepared. Four noise processes: Gaussian;
uniform; exponential and Laplacian, previously cat-
alogued in, and indistinguishable from the second-
order perspective, are presented in this subsection
in order to illustrate the importance of introducing
higher-order cumulants. The 4th-order cumulants are
computed according to the estimate given in (De la
Rosa et al., 2009, ). We consider a 2048-point sam-
ple register for each random set of data. The four
identical autocorrelation sequences contrast to the
fourth-order ones, where substantial differences are
observed, specially those corresponding to zero time
lags. This can be seen in Fig. 2, where the 4th-order
cumulant sequences are depicted. The theoretical val-
ues of the cumulants at zero time-lag are: 0 (Gaus-
sian), -1 (uniform), 6 (Exponential), 12 (Laplacian).
The difference between the theoretical and the exper-
imental value is due to the lack of averaging (only one
sample register is consider). The convergency of the
estimate is assured.
ICINCO 2010 - 7th International Conference on Informatics in Control, Automation and Robotics
186

−20 −15 −10 −5 0 5 10 15 20
−0.1
0
0.1
Gaussian
c
4,x
(τ
1
,0,0); τ
2
=τ
3
=0
−20 −15 −10 −5 0 5 10 15 20
−1.5
−1
−0.5
0
Uniform
−20 −15 −10 −5 0 5 10 15 20
0
2
4
6
8
Exponential
−20 −15 −10 −5 0 5 10 15 20
−5
0
5
10
15
τ
1
Laplacian
−0.075
−1.16
5.55
10.78
Figure 2: 4th-order cumulant sequences for the four noise
processes. Sample values at zero time lag are included in
each sub-figure.
4 COMPETITIVE LAYERS AND
SELF-ORGANIZING MAPS
In a competitive layer neurons distribute themselves
to recognize frequently presented input vectors. The
competitive transfer function accepts a net input vec-
tor p for a layer (each neuron competes to respond to
p) and returns neuron outputs of 0 for all neurons ex-
cept for the winner, the one associated with the most
positive element of net input. If all biases are 0, then
the neuron whose weight vector is closest to the input
vector has the least negative net input and, therefore,
wins the competition to output a 1.
The winning neuron will move closer to the input,
after this has been presented. The weights of the win-
ning neuron are adjusted with the Kohonen learning
rule (0.9 in the present case). Supposing that the ith-
neuron wins, the elements of the ith-row of the input
weight matrix (IW) are adjusted as shown in Eq. (5):
IW
1,1
i
(q) = IW
1,1
i
(q− 1)+ α
h
p(q) − IW
1,1
i
(q− 1)
i
,
(5)
where p is the input vector, q is the time instant,
and α is the learning rate. The neuron whose weight
vector was closest to the input vector is updated to
be even closer. The result is that the winning neuron
is more likely to win the competition the next time
a similar input is presented. As more inputs are pre-
sented, each neuron in the layer closest to a group of
input vectors soon adjusts its weights toward those in-
puts. Eventually, if there are enough neurons, every
cluster of similar input vectors will have a neuron that
outputs 1 when a vector in the cluster is presented,
while outputting a 0 at all other times. Thus, the com-
petitive network learns to categorize the input vectors.
Self-Organizing Maps (SOM) learn to classify
feature input vectors according to how they are
groupedin the input space. SOM differ from competi-
tive layers in that neighbor-neurons learn to recognize
neighboring sections of the input space. Thus, SOM
learn both the distribution (as do competitive layers)
and topology of the input vectors they are trained on.
Consequently, instead of updating only the winning
neuron, all neurons in its neighborhood are updated
using the Kohonen rule. The neurons in the layer of
a SOM are arranged originally in physical positions
according to a topology function. A distance function
allows the calculation of the distances between neu-
rons. Thus, for the ith neighboring neuron, in the qth
instant, we have the weight vector w, in Eq. (6):
w
i
(q) = w
i
(q− 1) + α[p(q) − w
i
(q− 1)]. (6)
Thus, when a vector is presented, the weights of
the winning neuron and its closest neighbors move to-
ward. Consequently, after many presentations, neigh-
boring neurons will have learned vectors similar to
each other.
5 EXPERIMENTAL RESULTS
As conveyed in previous sections, the experiment
comprises two phases. The feature extraction, and
first stage, is based on the calculation of the max-
ima and minima of the 4th-order central cumulants
at zero lags for each data recording; i.d., each signal
is characterized in a 2-D space by a vector, whose co-
ordinates correspond to the local maxima and min-
ima of the 4
th
-order central cumulants. A number
of 90 different measured power-line signals were se-
lected, containing different PQ anomalies. Secondly,
the classification stage (on the 90 feature vectors)
is based on the application of ANN as classification
tools in a twofold frame. The mission of the competi-
tive layer consists of confirming the existence of four
different sets of signals’ classes (a priori established
in the research). Additionally, the SOM network is
conceived to guess additional possible classes and, in
case of finding out more, determine their nature and
relationship with the firstly proposed four groups of
features.
Each cumulant is computed over 50 points; this
window’s length (50 points) has been selected nei-
ther to be so long to cover the whole signal nor to be
very short to loose information. The algorithm calcu-
lates the cumulant over 50 points, and then it jumps to
the following starting point (next 50-point overlapped
CLASSIFICATION OF POWER QUALITY DISTURBANCES VIA HIGHER-ORDER STATISTICS AND
SELF-ORGANIZING NEURAL NETWORKS
187
group); as a consequencewe have 98 per cent overlap-
ping sliding windows (49/50=0.98). Then each com-
putation over a window (called a segment) outputs a
4
th
-order cumulant.
Besides, each 4th-order cumulant, Cum
n,x
[i], as-
sociated to the ith computation segment has been nor-
malized by (Cum
2,x
[i])
2
, in order to obtain categoriza-
tion results associated to the shape of the sliding cu-
mulants. This gives a real statistical characterization.
If the cumulants are not normalized, the maxima and
minima also gather information regarding the abso-
lute value of the cumulants. The higher-order (n>2)
normalized cumulants are the skewness and the kur-
tosis.
Before the computation of the biased cumulants,
two pre-processing actions have been performed over
the sample signals. First, they have been normalized
because they exhibit very different-in-magnitudevolt-
age levels. This disparity of voltage levels cannot in-
fluence the results of the categorization. Secondly, a
high-pass digital filter (5th-order Butterworth model
with a characteristic frequency of 150 Hz) eliminates
the low frequency components which are not the tar-
gets of the experiment.
Once filtered, each signal contains one or more
types of PQ events. Four different sets of signals
have been a priori settled down empirically, based
on the qualitative human knowledge, and then con-
firmed using a competitive layer. The first set com-
prises healthy sine-waves from the power 50 Hz-line.
Then, we consider signals with oscillatory mono-
frequency (long duration) transients of relatively high
amplitude; we also consider for the second set signals
with harmonics, which distort the shape of the sine-
wave producing a not very high valued fourth-order
cumulant. The third group gathers features’ anoma-
lies which appeared simultaneously in a signal, corre-
sponding to impulsive transients (of short duration),
and/or a weak sag (RMS descent), and/or oscillatory
high-amplitude events. Finally, signals clearly af-
fected by high-amplitude impulsive transients and/or
deep sags are contained in the fourth set. Sets ♯3
and ♯4 may be joined in one, but signals in set ♯4 are
clearly more affected and probably by only one type
of perturbation. On the other hand, signals belonging
to set ♯3 are generally affected by several anomalies.
Consequently, four classes have been established with
the possibility of upgrading the detection towards 6
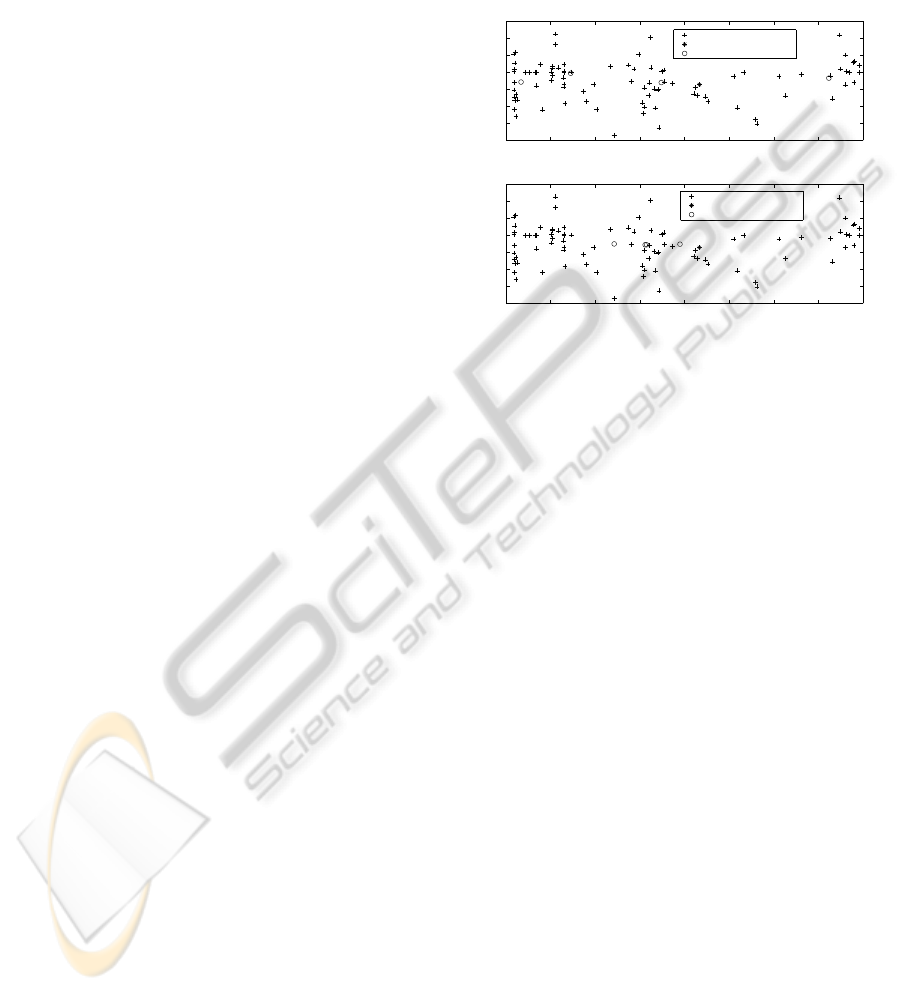
clusters. The limits for the four classes’ intervals, in
units of cumulants maxima are: [0,7], [7,12], [12,20],
[20,40]. These classes can be appreciated in Fig. 3, in
the upper sub-graph, for the competitive layer train-
ing results. The lower subgraph in Fig. 3, shows
the results of applying the SOM network and can be
seen the shifting phenomenon that occurs for the fi-
nal weights vector after the training stage of the NNT
over 50 epochs. This result conveys the idea of the
SOM network used to refine the classification, more
than performing the coarse sub-divisionin anomalies’
subclasses.
0 5 10 15 20 25 30 35 40
−1.8
−1.75
−1.7
−1.65
−1.6
−1.55
−1.5
−1.45
Cumulant maxima
Cumulant minima
Competitive learning. Clusters: 4
th
−order cumulants
:measured vector
:initial neuron weight vector
:final neuron weight vector
0 5 10 15 20 25 30 35 40
−1.8
−1.75
−1.7
−1.65
−1.6
−1.55
−1.5
−1.45
Cumulant maxima
Cumulant minima
Self−Organizing Map. Clusters: 4
th
−order cumulants
:measured vector
:initial neuron weight vector
:final neuron weight vector
Figure 3: Four clusters for 4 types of signals. A randtop
2 × 2 topology has been selected over 50 epochs training.
Upper graph: competitive layer performance. Down graph:
SOM performance.
The separation between classes (inter-class dis-
tance) is well defined in the 2-D feature graph for the
competitive layer. Consequently, the four types of PQ
events are clustered. The correct configuration of the
clusters is corroborated during the simulation of the
neural network, in which we have obtained an approx-
imate classification accuracy of 95 percent. During
the simulation, new signals (randomly selected from
our data base) were processed using this methodol-
ogy. The accuracy of the classification results in-
creases with the number of data. To evaluate the con-
fidence of the statistics a significance test has been
conducted. As a result, the number of measurements
is significantly correct.
An attempt to classify signals according a 6-
cluster pattern has been developed. The limits for the
four classes’ intervals, in units of cumulants maxima
are: [0,2], [2,7], [7,12], [12,20], [20,30], [30,40]. The
new proposed intervals (added to the four classes pro-
posal) are related to graded anomalies. The training
results are displayed in Fig. 4, conveyingthe idea that,
new classes are not really new anomalies.
In fact, despite the fact that the competitive layer
manages to classify the signals into 6 classes (we
force it), when we apply SOM networks, due to the in-
fluence of the close neighbor neurons, the final weight
vectors are shifted or moved to new positions, de-
pending on the geometry of the network (rand-to,
hex-top). This clearly confirms the idea of a graded
ICINCO 2010 - 7th International Conference on Informatics in Control, Automation and Robotics
188

0 5 10 15 20 25 30 35 40
−1.8
−1.7
−1.6
−1.5
Cumulant minima
Competitive learning. Clusters: 4
th
−order cumulants
0 5 10 15 20 25 30 35 40
−1.8
−1.7
−1.6
−1.5
Cumulant minima
SOM−randtop. Clusters: 4
th
−order cumulants
0 5 10 15 20 25 30 35 40
−1.8
−1.7
−1.6
−1.5
Cumulant maxima
Cumulant minima
SOM−hextop. Clusters: 4
th
−order cumulants
Figure 4: Six clusters for 6 possible types of signals after 50
epochs training. A 2 × 3 topology has been selected. Upper
graph: competitive layer performance. Middle graph: SOM
performance for a rand-top topology. Down graph: SOM
performance for an hex-top topology.
anomaly, because the weight vectors are not located
in the same position for both types of network’s ge-
ometry.
6 CONCLUSIONS
In this paper an automatic procedure to classify
electrical PQ anomalies has been proposed. The
method comprises two stages. The first includes pre-
processing (normalizing and filtering) and outputs the
2-D feature vectors, each of which coordinate cor-
responds to the maximum and minimum of the cen-
tral 4th-order cumulants. The second stage is based
in computational intelligence and uses a competitive
layer to confirm the existence of 4 classes, related
to the different groups of anomalies. Then a SOM
network confirms that newly added classes (proposed
empirically) are not really new. New sub-divisions
are related to degree of the degree of the anomaly.
The geometry of the SOM network confirm this fact,
moving the final weight vectors to different positions.
Future work is designed to deal with a great number
of signals (more than 90), trying to guess more classes
with the aim of generalizing the method.
ACKNOWLEDGEMENTS
The authors would like to thank the Spanish Min-
istry of Science and Innovation for funding the re-
search project TEC2009-08988. Our unforgettable
thanks to the trust we have from the Andalusian Gov-
ernment for funding the Research Unit PAIDI-TIC-
168 in Computational Instrumentation and Industrial
Electronics.
REFERENCES
(1995a). IEEE Guide for service to equipment sensitive
to momentary voltage disturbances. Technical Report
IEEE Std. 1250-1995, The Institute of Electrical and
Electronics Engineers, Inc.
(1995b). IEEE Recommended practice for monitoring
electric power quality. Technical Report IEEE Std.
1159-1995, The Institute of Electrical and Electronics
Engineers, Inc.
Bollen, M. H. J., Styvaktakis, E., and Gu, I. Y.-H.
(2005). Categorization and analysis of power sys-
tem transients. IEEE Transactions on Power Delivery,
20(3):105–118.
Mendel, J. M. (1991). Tutorial on higher-order statistics
(spectra) in signal processing and system theory: The-
oretical results and some applications. Proceedings of
the IEEE, 79(3):278–305.
Moreno, A., Flores, J., Oterino, D., and De la Rosa, J.
J. G. (2007). Power line conditioner based on ca pwm
chopper. In ISIE 2007, Proceedings of the 2007 IEEE
International Symposium on Industrial Electronics,
pages 2454–2456, June 2007.
Moreno, A. and et al (2007). Mitigation Technologies in a
Distributed Environment. Power Systems. Springer-
Verlag, 1 edition.
Nikias, C. L. and Mendel, J. M. (1993). Signal process-
ing with higher-order spectra. IEEE Signal Processing
Magazine, pages 10–37.
¨
Omer Nezih Gerek and Ece, D. G. (2006). Power-
quality event analysis using higher order cumulants
and quadratic classifiers. IEEE Transactions on Power
Delivery, 21(2):883–889.
Paul, D. (2001). Low-voltage power system surge overvolt-
age protection. IEEE Transactions on Industry Appli-
cations, 37(1):223–229.
De la Rosa, J. J. G., Lloret, I., Puntonet, C. G., and G´orriz,
J. M. (2004). Higher-order statistics to detect and
characterise termite emissions. Electronics Letters,
40(20):1316–1317. Ultrasonics.
De la Rosa, J. J. G., Lloret, I., Puntonet, C. G., Piotrkowski,
R., and Moreno, A. (2008). Higher-order spectra mea-
surement techniques of termite emissions. a charac-
terization framework. Measurement (Ed. Elsevier),
41(1):105–118. Available online 13 October 2006.
De la Rosa, J. J. G., Moreno, A., and Puntonet, C. G. (2007).
A practical review on higher-order statistics interpre-
tation. application to electrical transients characteri-
zation. Dynamics of continous discrete and Impul-
sive Systems-Series B: Applications and Algorithms,
14(4):1577–1582.
CLASSIFICATION OF POWER QUALITY DISTURBANCES VIA HIGHER-ORDER STATISTICS AND
SELF-ORGANIZING NEURAL NETWORKS
189

De la Rosa, J. J. G. and Mu˜noz, A. M. (2009). Higher-
order characterization of power quality transients
and their classification using competitive layers.
Przega¸d Elektrotechniczny-Electrical Review, 10(Is-
sue 85):284–289.
De la Rosa, J. J. G., Mu˜noz, A. M., Gallego, A., Pi-
otrkowski, R., and Castro, E. (2009). Higher-order
characterization of power quality transients and their
classification using competitive layers. Measurement
(Ed. Elsevier), 42(Issue 3):478–484.
ICINCO 2010 - 7th International Conference on Informatics in Control, Automation and Robotics
190
