
IMPROVEMENT OF WIRELESS NETWORK PERFORMANCE
BY POLARISATION DIVERSITY
Simulation from Measurement Results at only One Polarisation
Iñigo Cuiñas and Manuel G. Sánchez
Dept. Teoría do Sinal e Comunicacións, Universidade de Vigo, rúa Maxwell, s/n, 36310 Vigo, Spain
Keywords: Diversity Techniques, Polarisation, Radio Channel, Measurements, Wireless Network.
Abstract: The use of polarisation diversity techniques in reception could be adequate to improve the performance of
the wireless networks operating in deep multipath fading environments. This paper explores this possibility,
and presents a procedure to estimate the received cross-polarised power from wide band measurements
performed at just one polarisation. Three different strategies have been tested, and the results are presented
and analysed, detecting improvements even when the multipath is low in the channel. In highly multipath
rooms, the improvement in terms of received power reaches 21%.
1 INTRODUCTION
The deployment of wireless local area networks is
determined, in most situations, by the strong
multipath effect that could degrade the performance
of the complete communication system. This
multipath effect appears as frequency selective fast
fading events along the receiver path, when it is
moved; or as very low coverage at some locations
that could coincide with receiver position. In both
situations, the connection possibilities of the
network nodes may be reduced or even unavailable.
The multipath is present in most of the
environments where a radio communication system
is installed. However, it is at indoor scenarios where
the effects of multipath resulted to be more
hazardous for the performance of the system. This is
the reason why different indoor environments have
been used to check the proposal of this paper.
The work in this paper is centred in the 5.8 GHz
band, one of the assigned to wireless networks
(Dutta-Roy, 1999) (IEEE802.16, 2003) (Eklund et
al, 2002). Results of several measurement
campaigns performed in both line of sight (LoS),
non LoS (NLoS), and obstructed LoS (OLoS) indoor
environments have been used as a basis to check the
options of implementing a solution to reduce the
multipath consequences. These data are radio
channel responses, with transmitters at fixed
locations and receivers measuring along linear paths,
as explained in the second section. As we get
complex responses, we can analyse the multipath
effect, and we can try to reduce the influence of their
costs.
Among the various procedures that have been
tested to mitigate the multipath consequences,
different diversity techniques have been proposed.
The general solution of such techniques is to provide
two different propagation paths, with almost
uncorrelated received signals. Thus, the alternate use
of both signals, or the combination between them,
provide a final signal with better relation SNR than
that obtained with only one standard propagation
path.
Diversity techniques could be applied following
several strategies: frequency, space, time, angle,
polarisation, and hybrids that combine some of the
previously indicated (Dietrich et al, 2001)
(Turkmani et al, 1995).
Among the diversity techniques, the polarisation
diversity is analysed along this paper: two
orthogonally polarised signals at the same frequency
are used as inputs in the diversity receiver. In this
case, the pair of propagation paths is provided by the
pair of orthogonal polarisations. This technique has
been selected because the indoor environments
presents both multipath phenomenon and
depolarisation by transmission and reflection on the
walls, ceiling, floor, and so on. Thus, a certain
percentage of the transmitted signal would arrive the
115
Cuiñas I. and G. Sánchez M. (2010).
IMPROVEMENT OF WIRELESS NETWORK PERFORMANCE BY POLARISATION DIVERSITY - Simulation from Measurement Results at only One
Polarisation.
In Proceedings of the International Conference on Wireless Information Networks and Systems, pages 115-122
DOI: 10.5220/0002929001150122
Copyright
c
SciTePress
receiver orthogonally polarised. Moreover, the
spectrum consumption is reduced compared to
frequency diversity, as no new bands are occupied
by the second propagation path. Depending on the
amount of depolarised signal, the application of
polarisation diversity at reception could be more or
less advantageous.
The depolarisation indexes depends on the
building material of the wall, specifically on the
electromagnetic behaviour of the different
constructive elements, as previously studied in
(Cuiñas et al, 2009). Results presented in that paper
have been applied in the computation of the
improvement by polarisation diversity. The
information related to depolarisation is the aim of
the third section.
The computation procedure begins with the data
provided by the wide band measurement campaign,
which represent the channel response in just one
linear polarisation. Based on the depolarisation
indexes induced by each reflection or transmission
phenomena, the cross-polarised signal could be
obtained by analysing separately each multipath
contribution. The actual copolar contribution and the
synthesised cross-polar one are then the inputs of the
diversity device, which provides the combination of
both contributions. All the procedure to obtain the
final signal is explained in detail along section
fourth.
Three different strategies are then applied to the
couple of signals to be combined into the final
result: sum, maximum and average diversity. The
performance of the application of such strategies are
related and analysed in section five.
The paper is organised, then, into six sections.
The second section is devoted of the measurements,
and the third one is focused on the fundamentals of
depolarisation indexes. Sections four and five are
centered in the results: the fourth on the way to
compute them, and the fifth in the analysis. Finally,
the sixth section summarises the conclusions.
2 MEASUREMENTS
A large wide band measurement campaign was
designed with the aim of obtaining the co-polar
response of the radio channel in several indoor
environments, both LoS, and OLoS or NLoS. The
campaign involved five different environment
configurations. The band of interest is centred in 5.8
GHz, as it is focused on propagation aspects for
wireless networks.
The measurement system was based on a vector
network analyser (VNA). The wide band condition
of the measurements is a key factor in this work, as
it allows the transformation to time domain and,
once moving to time, also the identification of
different multipath contributions. These
contributions could then be individually considered
when processing the cross-polar response of the
channel.
Along the following subsections, the setup used
during the measurements, the environments where
the experiments were performed, and the applied
procedure are described.
2.1 Measurement Setup
As previously commented, the measurement system
is based on a VNA Agilent 8510-C, which can
perform measurements up to 50 GHz, so far away
our needing. Both transmitting and receiving
antennas were connected to the ports 1 and 2 of the
VNA, which acts as signal generator and as receiver.
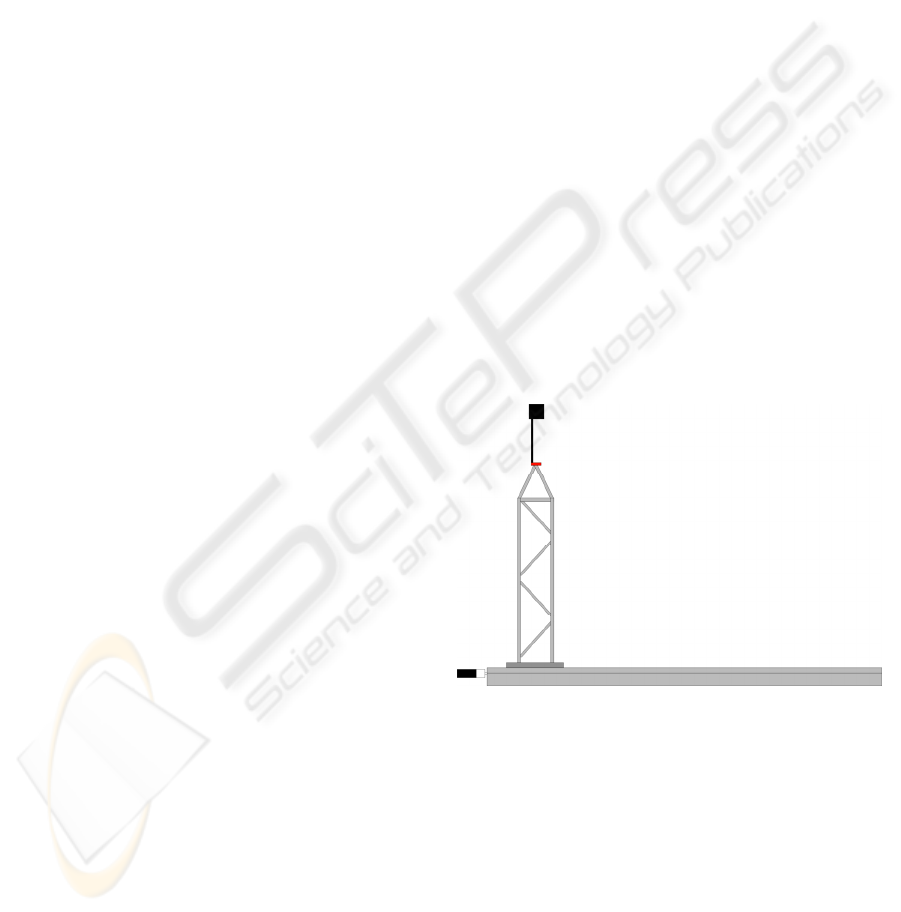
The transmitter end was placed in static locations
at each environment, whereas the receivin antenna
was installed on the top of a engineered mast, which
moved the receiver along a linear track, by means of
a neverended screw. Figure 1 shows the setup for the
receiver.
Figure 1: Receiver setup.
This positioning system, which consists of a 2.5
meter long linear table with a millimetre screw along
it, improves the precision of the positioning
compared to moving the antenna by hand.
Both antennas, Electro Metrics EM-6865,
present omni-directional radiation patterns. This
kind of pattern is interesting in order to get all the
multipath contributions with approximately the same
antenna gain, when dealing with receiver end. And
this pattern is also important in the transmitter, to
generate the maximum amount of multipath
components.
WINSYS 2010 - International Conference on Wireless Information Networks and Systems
116
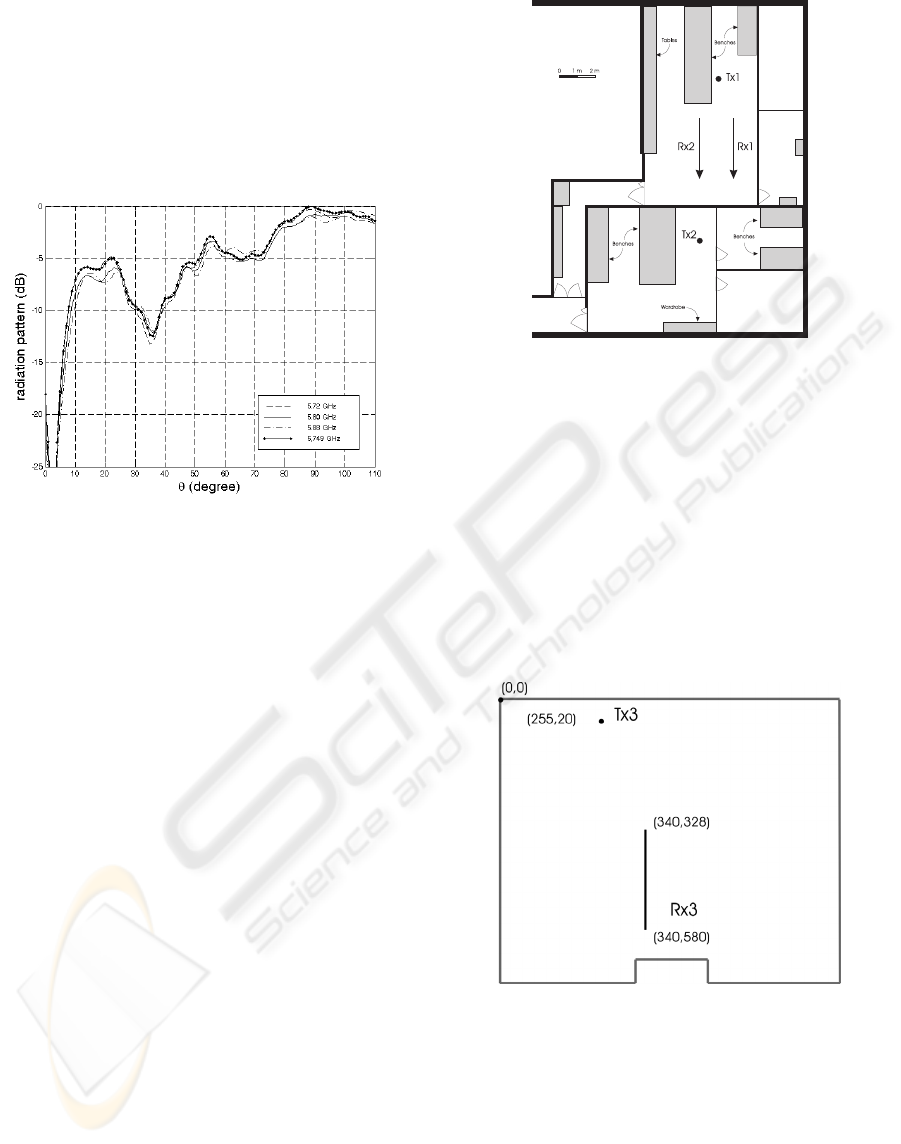
The radiation pattern of such antennas was measured
within the anechoic chamber of the Radio Systems
Research Group, being the 3 dB beam width larger
than 50 degree around the horizontal plane, in
elevation, at 5.8 GHz. Whereas, the azimuth
radiation pattern resulted to be aproximately
omnidirectional. Figure 2 depicts the radiation
pattern in elevation.
Figure 2: Radiation patttern at 5.8 GHz, in elevation.
2.2 Indoor Environments
Various series of indoor radio channel frequency
response were measured in five different
environments, some in LoS condition, one in NLoS
and the other in OLoS situation. The measurements
were taken in research laboratories, with both
computers and electronic equipment. The furniture,
when it is present, is the typical of this kind of
rooms: office tables and chairs, and laboratory
benches. The positions of transmitter and receiver
are depicted at Figures 3, 4 and 5, at different rooms.
During the measurement campaign, the transmitter
was fixed at positions Txn, being n a natural number
between 1 and 5 devoted to the five environments,
and the receiver was moved along the lines labelled
as Rxn.
The five environments was selected trying to
represent a great variety of rooms: we can compare
results at large and small rooms, at furnished and
empty places, at square and rectangular spaces, in
LoS and NLoS conditions, and so on.
The points and paths labelled as "1" correspond
to LoS situation within a large room (more than 100
square meter) and the labelled as "2" to NLoS within
the previously commented room and an adjacent
saloon. Both plans can be observed at figure 3. The
wall that obstructs the propagation channel between
both antennas in the second situation is made of
bricks and concrete.
Figure 3: Map of the measured environments. LoS is
defined as situation 1, and OLoS as situation 2.
The walls at both rooms are built by bricks and
concrete, except the fine line parallel to Rx1, which
is made of chip wood, and the upper wall (opposite
to the place where the measurements took place) that
contains a large window.
Figure 4 depicts the third environment, which is
again a LoS situation in a smaller square room, with
approximately 45 square meters.
The walls of such room are also brick made,
except the wall opposite to the transmitter, which
contains a large window.
Figure 4: Map of the third measurement environment
(dimensions in centimeter).
Finally, figure 5 depicts the situation for both fourth
and fifth environments. Both are placed in a long
room of 36 square meters. Whereas the fourth
environment consists of a completely empty room,
with perfect LoS conditions, the fifth consists of a
furnished office room, in OLoS conditions. When
furnished, office elements were placed within the
radio channel: desks, chairs, closets, etc.
IMPROVEMENT OF WIRELESS NETWORK PERFORMANCE BY POLARISATION DIVERSITY - Simulation from
Measurement Results at only One Polarisation
117

Figure 5: Map of the fourth and fifth measurement
environment.
This environment is more complicated: both North
and South walls are made of brick, the West wall is
made of chip wood in its North half, and brick the
South half, and the East wall is brick constructed,
but it contains a window.
2.3 Measurement Procedure
The transmitting antenna was kept stationary at a
height of 1.8 meter. This location guaranteed that the
radiating element was approximately equidistant
from floor and ceiling.
The receiving antenna was moved along 2.5
meter long linear paths by means of the automatic
positioner. Data were taken every one-eighth of a
wavelength (Dossi et al, 1996), which represent a de
facto standard when measuring radio channels, as
adjacent samples are far enough to be uncorrelated
and they are near enough to keep all fade event.
At each position, complex frequency responses
have been measured in a 160 MHz band around 5.8
GHz, with a resolution of 200 kHz, due to the 801
points in the frequency scan. As a consequence, the
sounder resolution in the delay domain is 6.25 ns,
while the maximum measurable delay is 5 μs.
The measurements were taken following a
procedure “measure-move-stop-measure-...” in order
to avoid Doppler effects within the data.
3 DEPOLARISATION
Indoor environments typically present large
multipath phenomena, which are the main trouble
when planning a wireless network. However, the
depolarisation induced by transmission of waves
across the walls (or by reflection on the walls) is not
commonly taken into account during the planning
procedure. And it could be useful to improve the
performance of the receiving signal if a polarisation
diversity technique is implemented at the reception
end.
This section deals with the fundamentals of
depolarisation and the depolarisation indexes used to
processing the results.
3.1 Depolarisation Phenomenon
A phenomenon associated to reflection, the
depolarisation that could be generated when a wave
beats a flat obstacle, appears to be not so fine
defined and modelled as the reflection itself. This is
probably because typical planning tools, as ray-
tracing, were initially created to be used at
frequencies corresponding to cellular phone or
television broadcasting, at which the typical
obstacles (walls) are electrically flat enough to
provide strong specular reflections.
At higher frequencies, the electrical size of a
given obstacle becomes larger. At 5.8 GHz, as an
example, some simulation tools could not work as
well as expected, because when a wave reaches an
obstacle, several reflection paths are generated in
any directions, not only the specular direction
(Cuiñas et al, 2007). And moreover, the obstacle
depolarises the wave in a certain percentage, which
is not commonly considered in such prediction tools.
3.2 Depolarisation Indexes
The depolarisation index, for any material, at any
angle of incidence and any polarisation of the
transmitted waves is the fraction of the power of this
wave that is received in the orthogonal polarisation.
From this definition, depolarisation indexes may be
computed by means of a matrix procedure (Cuiñas et
al, 2009).
The depolarisation indexes for the reflection
mechanism, computed in the specular direction, are
summarized in table 1. The values depend on the
polarisation of the incident wave, which is denoted
by “h” when it is horizontal and “v” when vertical.
The specular situation is adequate to define very
good reflectors, which reflect most of the incident
wave towards the opposite direction, being the
normal to the surface the axis of symmetry.
The results of table 1 indicate that brick wall
provides reduced depolarised waves compared to the
co-polar reflected waves in the specular direction.
The other considered materials provide depolarised
waves up to 9.8% compared to the co-polar one.
But when a more complex analysis is expected,
as it is the situation of the present paper, all
scattering directions have to be considered, and not
just specular one, because the reflector could be
randomly located and oriented.
WINSYS 2010 - International Conference on Wireless Information Networks and Systems
118

Table 1: DI (%) induced by reflection, in the specular
direction of observation.
Material
Incidence
angle (deg)
DIh DIv
Brick wall
10 0.31 % 0.48 %
20 0.66 % 0.19 %
30 0.67 % 0.65 %
40 0.72 % 0.75 %
Chip
wood
10 4.57 % 4.66 %
20 9.80 % 8.20 %
Stone and
concrete
facade
10 2.12 % 1.57 %
20 5.31 % 1.27 %
30 1.80 % 3.60 %
40 5.27 % 3.74 %
50 9.27 % 8.38 %
With this aim, median depolarisation indexes for
each material at all pair of angles of incidence and
observation are provided in table 2.
Table 2: Median DI (%) induced by reflection.
Material DIh DIv
Brick wall 23% 30%
Chip wood 18% 18.5%
Stone and concrete facade 4.5% 4%
Once the complete (180 degree) observation arc, not
just the specular angles, is introduced, the
depolarisation indexes grow, and differences
between incident polarisations also appear in the
brick wall case. The brick wall is the more non
isotropic material among the considered, as it
presents a clearly oriented structure, whereas the
chip wood panel and the stone and concrete facade
are the result of the solidification of a mass, which is
expected to present a more isotropic behaviour. The
high median values of depolarisation indexes
indicate that high depolarised waves could be
generated when several scatterers are present in an
environment, which is the case of indoor scenarios.
Furthermore, the transmission mechanism across
walls induces depolarisation. In this case, and
focused on the environments under test, the interest
is mainly the depolarisation by transmission across a
brick wall with normal incidence. The measured
value for DI at such situation was 9.4 %, considering
transmission with vertical polarisation.
4 PROCESSING
As measurements have been done following a wide
band scheme, information about the multipath
components can be obtained from the outcomes.
Knowing the multipath scheme, or the power-delay
profile (PDP) in the co-polar installation, it is
possible to compute a synthetic mirror (another
PDP) in the cross-polar domain.
Then, each couple of PDPs (co-polar and cross-
polar) could be the input of a diversity block, which
provides a new received signal with better
performance than just the co-polar one.
The following subsections contain the
computation of these cross-polar PDPs as well as the
results of applying different diversity techniques at
the reception end.
4.1 Effect of the Multipath in the Total
Received Power
The receiving antenna at each measuring location is
reached by the direct ray, which links the
transmitting and the receiving antennas following
the shortest path. But that antenna is also reached by
several contributions coming from paths generated
by reflections on the walls and, perhaps,
transmissions across some wall. The received power
from each contribution, associated to the time delay
relative to the direct ray arrival time, construct the
PDP. This profile defines the multipath environment
at each reception location.
Commonly, this PDP is shaped by the antenna
pattern. In this case, with azimuth omnidirectional
antennas, most of the PDP is due to the multipath,
and only a few part could be defined by the
elevation pattern of the antenna. Consequently, the
PDP used along this work could be assumed as the
product of the environments where the
measurements were performed.
4.2 Computation of Cross Polar
Received Power
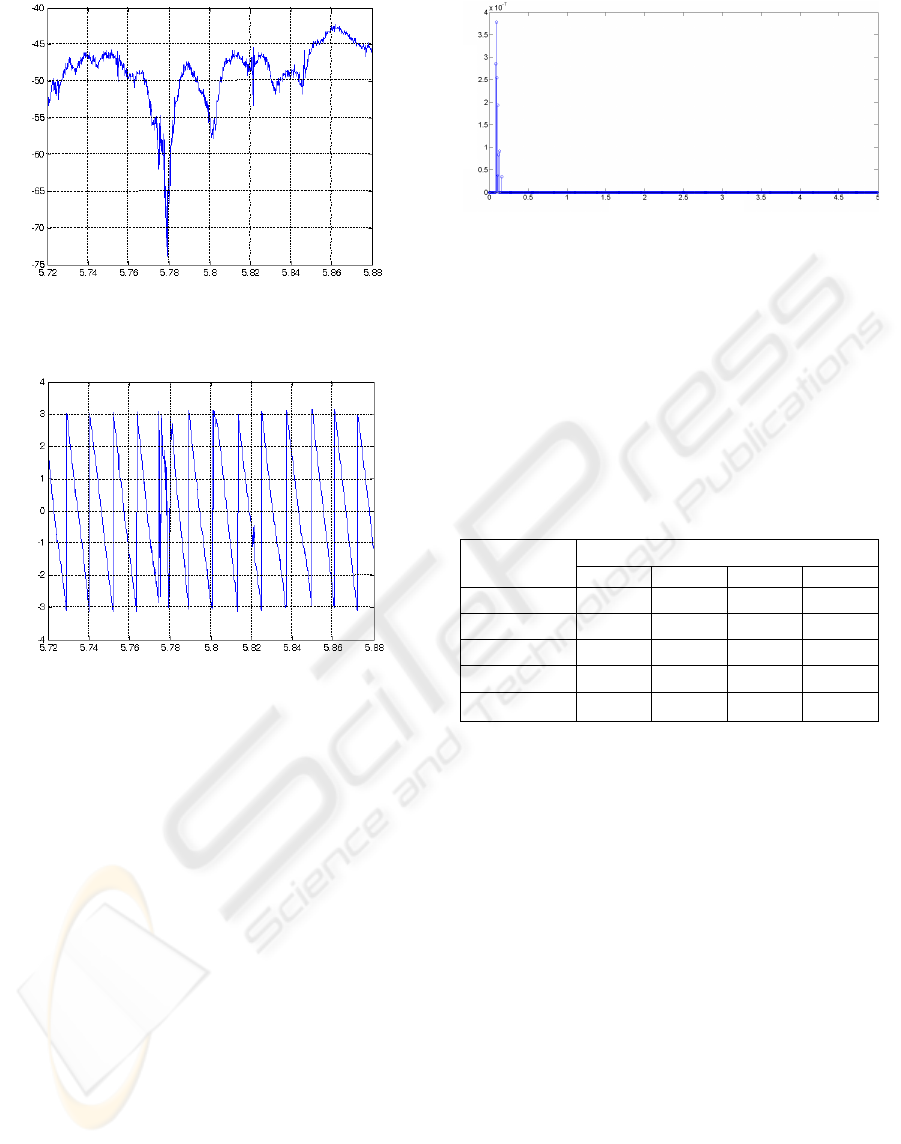
The measurement outcomes are complex frequency
responses between 5.72 and 5.88 GHz, and they
have a shape as depicted in figures 6 and 7, which
contain the amplitude and the phase respectively.
If only waves following the direct path arrived
the receiving antenna, the amplitude of the
frequency response would be approximately flat. In
fact, it would be locally flat, but it would be smaller
at higher frequencies than at lower. The behaviour of
the phase would be expected to be linear. Evidently,
if we observe figures 6 and 7, the amplitude is not
flat and the phase is not linear, which indicates the
presence of multipath components.
IMPROVEMENT OF WIRELESS NETWORK PERFORMANCE BY POLARISATION DIVERSITY - Simulation from
Measurement Results at only One Polarisation
119
Frequency (GHz)
R
e
c
e
i
v
e
d
p
o
w
e
r
r
e
l
a
t
e
d
t
o
t
r
a
n
s
m
i
t
t
e
d
(
d
B
)
Figure 6: Example of the amplitude of the complex
frequency response.
Frequency (GHz)
P
h
a
s
e
(
r
a
d
)
Figure 7: Example of the phase of the complex frequency
response.
Applying an inverse fast Fourier transform to each
complex frequency response, this can be turned to
the time domain, with a resolution of 6.25 ns
between adjacent samples. Figure 8 depicts an
example.
At this time response, the different contributions
after one, two, three, or more reflections can be
identified, using an inverse ray tracing procedure.
Once the contributions have been classified in terms
of the number of reflections on the walls before they
reach the receiving antenna, the orthogonal
contributions at each delay can be computed.
Firstly, the path followed by each multipath
contribution has to be identified, and the walls that
generated each reflection or transmission mechanism
have to be categorised. Depending on the material
that constitutes the wall, the angle of incidence and
the frequency, a total depolarisation index (TDI) can
be obtained. Mean values, used along computation,
are summarised in table 3.
Delay (microseconds)
R
e
c
e
i
v
e
d
p
o
w
e
r
r
e
l
a
t
e
d
t
o
t
r
a
n
s
m
i
t
t
e
d
Figure 8: Example of time response.
The direct path contribution TDI needs a
supplementary comment. In LoS conditions, this
TDI depends on the depolarisation induced by both
antennas. In NLoS conditions, and additional
depolarisation due to the transmission across the
wall separating both rooms has to be considered.
When dealing with OLoS (furnished) environments,
we decided to take into account only the effect of the
antennas.
Table 3: Mean TDI (%) at different environments.
Environment Multipath contribution
Direct 1 ref 2 ref 3 ref
1, LoS 1.8 0.75 1.5 24.6
2, NLoS 9.4 15.8 24 32.2
3, LoS 1.8 0.75 1.5 24.6
4, LoS 1.8 8.2 16.4 24.6
5, OLoS 1.8 8.2 16.4 24.6
If the total power ariving the receiver antenna at
each time delay represents 100%, the co-polar
contribution would be (100-TDI)%. The collection
of co-polar contributions represent the measured
PDP, which is the basis to compute the cross-polar
PDP. Obviously, the cross-polar contributions at
each delay would be TDI %.
Consequently, the procedure to compute the
cross-polar contribution is:
1. Compute the co-polar PDP from the measured
frequency response.
2. Calculate the total power at each delay, based on
the correspondent TDI.
3. Obtain the cross-polar power at each delay.
4. Combine the collection of delays to obtain the
cross-polar PDP.
4.3 Polarisation Diversity at Reception
Once the co-polar and cross-polar PDPs have been
computed at each receiving location, different
polarisation diversity technique schemes have to be
WINSYS 2010 - International Conference on Wireless Information Networks and Systems
120
applied to each couple of data.
The three tested combination schemes are:
1. Sum, where the final signal could be the sum of
both input signals.
2. Mean, where the final signal is the average of
both inputs.
3. Switching, where the diversity device swicths
between both channels in order to get the
maximum at each instant.
After application of these diversity schemes at all
the receiving locations, the results are prepared to be
analysed.
5 RESULTS ANALYSIS
The application of diversity techniques provides
improvements in the received power signal. Among
the three considered schemes, the combination by
sum appears to perform better than the other pair,
and it offers enhancements as summarised in table 4.
Table 4: Estimation of the mean improvement by
polarisation diversity at different environments.
Environment Improvement (%)
1, LoS 17.89
2, NLoS 23.29
3, LoS 10.18
4, LoS 18.51
5, OLoS 21.23
Considering each environment separately, the
maximum improvement receiving location, the
minimum, the mean and the range of improvements
along the receiving path can be analysed.
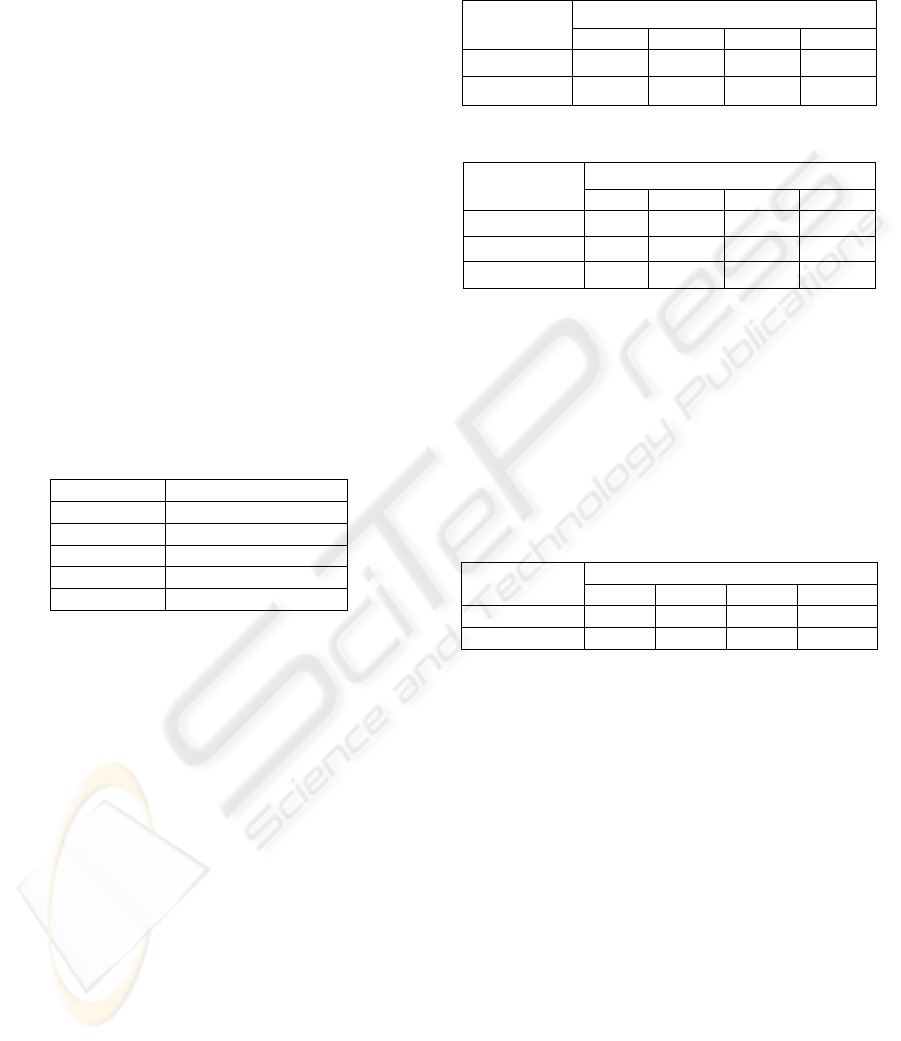
Table 5 contains the data for the environments 1
and 2, which allows the comparison between LoS
and NLoS situations within similar rooms. The
improvement in terms of received power appears to
be larger when there is no line of sight between
transmitter and receiver, with a mean of 23.29%.
Analysing the maximum and minimum
improvements, the application of polarisation
diversity appears to be more advantageous in NLoS
conditions: the enhancement is, at some points, only
2% in LoS conditions.
Table 6 makes available the data to compare the
effect of polarisation diversity at reception as a
function of the size of the indoor environment, in
LoS conditions (environments 1, 3, and 4). The first
comment is that improvements are detected at every
room, but the performance of the networks installed
in large, and even long, rooms appears to be more
enhanced than in small rooms. Besides, the receiving
locations where less enhancement has been detected
present values under 4%.
Table 5: Comparison between LoS and NLoS.
Environme
nt
Improvement (%)
Mean Max. Min. Range
1, LoS 17.89 32.28 2.00 30.28
2, NLoS 23.29 37.23 10.38 26.85
Table 6: Comparison among different size rooms.
Environment Improvement (%)
Mean Max. Min. Range
1, large 17.89 32.28 2.00 30.28
3, small 10.18 31.94 1.60 30.34
4, long 18.51 56.04 3.46 52.58
Table 7 contains the comparison between furnished
(OLoS) and empty (LoS) environments
performance. Both data come from the same room,
but changing the contents. In presence of furniture,
the polarisation diversity technique works better, as
it provides larger signal enhancements, even
although no obstacles block the line of sight between
transmitting and receiving antennas.
Table 7: Comparison between empty (LoS) and furnished
(OLoS) situations.
Environment Improvement (%)
Mean Max. Min. Range
4, LoS 18.51 56.04 3.46 52.58
5, OLoS 21.23 32.01 5.28 32.01
6 CONCLUSIONS
The improvement in the performance of wireless
networks by polarisation diversity has been
estimated from radio channel measurements in the
5.8 GHz band. Measurements at only one
polarisation were carried out. The cross-polar
responses of the channels have been computed from
these co-polar data, using depolarisation indexes.
The newness of the proposal is the analysis of
polarisation diversity at several scenarios based in
just one polarisation measurements.
Although three possible strategies for
implementing the polarisation diversity have been
taken into account, the main improvements were
provided by combination by sum scheme.
The presence of obstacles (when dealing with
obstructed line of sight situations), and mainly the
absence of line of sight (NLoS situations), leads to
IMPROVEMENT OF WIRELESS NETWORK PERFORMANCE BY POLARISATION DIVERSITY - Simulation from
Measurement Results at only One Polarisation
121

larger improvements in the performance provided by
the polarisation diversity. Even in LoS situations, the
improvements are noticeable. They are over 23% in
terms of power at NLoS environments, but the
minimum mean improvement has been estimated in
10%, which are interesting values for planning.
The proposal of using polarisation diversity in
reception could be of interest for network designers,
mainly in such environments where fading due to
multipath is especially deep.
ACKNOWLEDGEMENTS
This work has been supported by the Autonomic
Government of Galicia (Xunta de Galicia), Spain,
through Project PGIDIT 08MRU002400PR.
The authors would also like to acknowledge
Eduardo Cebrián Martínez de Lagos, Mr. Juan
Aguilera, and Mr. José Manuel Prado for their help
during the measurement campaigns, as well as Mr.
José Carlos Fernández Ribao for his help during the
data processing.
REFERENCES
Cuiñas, I., Martinez, D., Sanchez, M.G., Alejos, A.V.,
2007. “Modelling and measuring reflection due to flat
dielectric surfaces at 5.8 GHz”, IEEE Transactions on
Antennas and Propagation, vol. 55, no. 4, pp. 1139-
1147.
Cuiñas, I. Sanchez, M.G., Alejos, A.V., 2009.
“Depolarisation due to scattering on walls in the 5
GHz band”, IEEE Transactions on Antennas and
Propagation, vol. 57, no. 10, pp. 2934-2939.
Dietrich, C.B., Dietze, K., Nealy, J.R., Stutzman, W.L.,
2001. “Spatial, Polarization, and Pattern Diversity for
Wireless Handheld Terminals”, IEEE Transactions on
antennas and propagation, vol. 49, no. 9.
Dossi, L., Tartara, G., Tallone, F., April 1996. "Statistical
Analysis of Measured Impulse Response Functions of
2.0 GHz Indoor Radio Channels", IEEE Journal on
Selected Areas in Communications, vol. 14, no. 3,
pp.405-410.
Dutta-Roy, A., December 1999. "Networks for Homes",
IEEE Spectrum, pp.26-33.
Eklund, C., Marks, R.G., Stanwood, K.L., Wang, S., 2002.
“IEEE Standard 802.16: A technical overview of the
WirelessMAN air interfaces for broadband wireless
acces”, IEEE Communications Magazine, vol. 40, no.
6, pp.98-107.
IEEE Standard 802.16a-2003, IEEE Standard for Local
and metropolitan area networks — Part 16: Air
Interface for Fixed Broadband Wireless Access
Systems — Amendment 2: Medium Access Control
Modifications and Additional Physical Layer
Specifications for 2-11 GHz.
Turkmani, A. M. D., Arowojolu, A. A., Jefford, P. A.,
Kellett, C.J., 1995. “An Experimental Evaluation of
the Performance of Two-Branch Space and
Polarization Diversity Schemes at 1800 MHz”, IEEE
Transactions on Vehicular Technology, vol. 44, no. 2.
WINSYS 2010 - International Conference on Wireless Information Networks and Systems
122
