
IMPACT OF DIFFERENT BIT RATES ON PERFORMANCE
CHARACTERISTICS OF INDUSTRIAL WLAN SOLUTIONS
André Schimschar and Lutz Rauchhaupt
Institut für Automation und Kommunikation e.V. Magdeburg, Werner-Heisenberg-Str. 1, Magdeburg, Germany
Keywords: Communication Systems, Performance Analysis, Reliability Analysis, Transmission Characteristics.
Abstract: Wireless communication is already widely used in industrial automation applications. Many solutions are
available which consider industrial related requirements more or less. Thus, reliability and performance with
respect to the specific requirements are the main concerns of industrial automation system users. Some of
the wireless solutions base on the well-known Wireless LAN. The development of IEEE 802.11 was driven
by the demand on highest possible data rates e.g. for video streaming applications. This paper proves
whether the increased bit rates are appropriate to the requirements of industrial automation applications. A
test methodology is introduced which can be used to get the necessary characteristic parameters with respect
to the application field - industrial automation. The impact of bit rates on packet loss probability and
therefore on the performance is analysed. Together with the transmission time for a successful transmission
with one attempt a cost function has been developed. It shows for WLAN solutions, that the highest bit rate
is not adequate to meet the reliability and performance requirements of industrial automation applications.
1 INTRODUCTION
Wireless communication technologies are widely
spread in daily life. The price of wireless products is
thereby the main design aspect with respect to the
consumer market. Reliability is one of the minor
design goals. Therefore, almost everyone has had
negative experiences with such technologies and has
developed concerns regarding the usage of wireless
in industrial communication.
Also the most popular wireless communication
technology WLAN, which uses the probabilistic
media access control CSMA/CA, has disadvantages
concerning time behaviour and reliability of packet
transmissions. With setting up the bit rate the end-
user has to find a trade-off between transmission
time and loss probability of transmitted packets.
Following the common sense the user takes a high
bit rate for fast transmissions or a low bit rate for a
high reliability of communication.
In this paper a test methodology is described
which allows the investigation of wireless solutions
with respect to industrial automation application
requirements and conditions. This approach is used
to define appropriate test conditions and to set-up a
test system in order to investigate the influence of
different bit rates on performance and reliability.
The transmission time is measured and the
number of retransmission is investigated.
Furthermore the loss probability is derived from the
number of retransmission. Finally, a cost function
has been developed in order to provide a guideline to
find an appropriate trade-off between performance
and reliability.
The paper is structured as follows. In chapter 2
the test methodology is presented and the main
important influencing parameters are discussed and
its values are defined. In chapter 3 the characteristic
values are introduced which have been used for the
investigations and the test system and its
components are explained. The test results are
discussed in chapter 4. The cost function is derived
in chapter 5 and the conclusions out of it are
presented in chapter 6.
2 TEST METHODOLOGY
AND CONDITIONS
Because of the special requirements and conditions
of industrial automation applications a test
methodology has been developed by the authors (see
Rauchhaupt, L., Krätzig, M., 2008.). It considers the
387
Schimschar A. and Rauchhaupt L. (2010).
IMPACT OF DIFFERENT BIT RATES ON PERFORMANCE CHARACTERISTICS OF INDUSTRIAL WLAN SOLUTIONS.
In Proceedings of the 7th International Conference on Informatics in Control, Automation and Robotics, pages 387-394
DOI: 10.5220/0002942203870394
Copyright
c
SciTePress
application field, but is independent of a certain
wireless technology. All relevant influencing
parameters are taken into account (see Gnad, A.,
Krätzig, M., Rauchhaupt, L., Trikaliotis, S., 2008).
These parameters are configured well-directed or if
not possible documented. Here only the main
important influencing parameters are described
because of the limited space.
The focus lies on the impact of different bit rates
on the performance and reliability of WLAN
solutions. For WLAN systems according to
IEEE 802.11 this is related implicitly to the physical
layer coding and modulation schemes as discussed
later on.
Although the WLAN implementation (hardware
and software) has a noticeable influence on the time
behaviour (see e.g. Rauchhaupt, L., Krätzig, M.,
2008, Rauchhaupt, L., 2009) it is not considered
here. However, an industrial WLAN solution was
selected which provides the best performances in
terms of jitter of the transmission time (i.e. span) and
in terms of minimum outliers which means in
number and in value.
Also interferences of other wireless systems are
not considered. They are well investigated as
described e.g. in ZVEI, 2009.
Thus, a simple point-to-point topology is used
for the investigations consisting of a WLAN access
point and one client. The attenuation between the
two devices was 60 dB which is according to about
10 m line of sight. The WLAN channel 1 (2412
MHz) was chosen.
The test packets have been generated by the
client. They had a user data length of 64 octets
which is the minimum length for an Ethernet packet
and a typical length in Ethernet based automation
applications.
In previous investigations the dependency of the
performance from the value of the transmit time
interval became obvious. Therefore in these tests the
client generated the test packets with a random
transmit time interval between 15 ms and 25 ms.
The random generation is based upon a uniform
distribution function.
The sample size of each test case was 30,000
packet transmissions which resulted in test durations
of about 10 minutes.
NOTE: With the chosen implementation a bit
rate of 5.5 MBit/s was not adjustable. When this bit
rate has been configured the WLAN system showed
the same behaviour as for automatic bit rate control
mode. Therefore, the bit rate 5.5 MBit/s is not
considered here.
3 CHARACTERISTIC
PARAMETERS AND
TEST SYSTEM
The analysis of literature concerning the usage of
characteristic parameters to describe and assess
communication behaviour has shown that there are
remarkable differences. Moreover, the definitions
come mostly from the application field of Ethernet,
Internet or telecommunication which does not fit to
the application field of industrial automation (e.g. in
(EN 61491, 1999), (EN 61209, 200)).
Test Consumer
Test Consumer
comm.ind
Test Producer
Test Producer
comm.req
Wireless System
under Test
Communication
Module
Communication
Module
transmission
delay
Communication
Interface
Communication
Interface
Figure 1: Definition of the transmission delay.
That is why it was necessary to find appropriate
definitions. The following characteristic parameters
are proposed to assess wireless communication
systems with respect to industrial automation
applications:
Transmission time
Update time
Response time
Data throughput
Packet loss rate
Residual error rate
Activation time after energy saving mode
Energy requirements
It has to be mentioned that it is not required nor
recommended to use all parameters at the same time
to characterise a communication solution for a
certain application. The definitions of the listed
characteristic parameters can be found in (VDI/VDE
2185, 2007).
In this paper we focus on the transmission time.
It is related to event driven applications. For
example when a work piece reaches a certain
position in order to be machined or when a fluid
reaches a defined level in a tank. In these cases it is
of interest as to how long it takes to transfer the
information from sensor to the control unit e.g.
programmable control logic (PLC). The appropriate
characteristic parameter of a communication system
to assess its behaviour is the transmission time.
ICINCO 2010 - 7th International Conference on Informatics in Control, Automation and Robotics
388

The definition of transmission time is based on a
producer consumer model as shown in Figure 1. It is
the time duration from the beginning of the handing
over of the first user data byte of a packet at the
communication interface in the test producer, up to
the handing over of the last user data byte of the
same packet at the communication interface at the
test consumer. It may be necessary to transmit
several telegrams between the communication
modules e.g. for acknowledgment. Furthermore,
network elements such as base stations may be
involved in the communication producing additional
delays. All these delays are covered by the
transmission time.
In order to assess the reliability the retry rate is
analysed. It is defined as the number of WLAN
packets that are necessary to transmit the content of
one generated test packet.
The system under test implements a widely used
radio technology - Wireless LAN and its application
interface is very common - Ethernet. Therefore,
standard measurement equipment can be used to
implement the above mentioned test methodology.
Ethernet
Tester
Access Point
(Consumer)
Client
(Producer)
Ethernet Ethernet
Power
Splitter
Dynamic
Attenuation
Antenna Cabel
Power
Splitter
56 dB
WLAN Packet
Analyser
3 dB 3 dB
20 dB
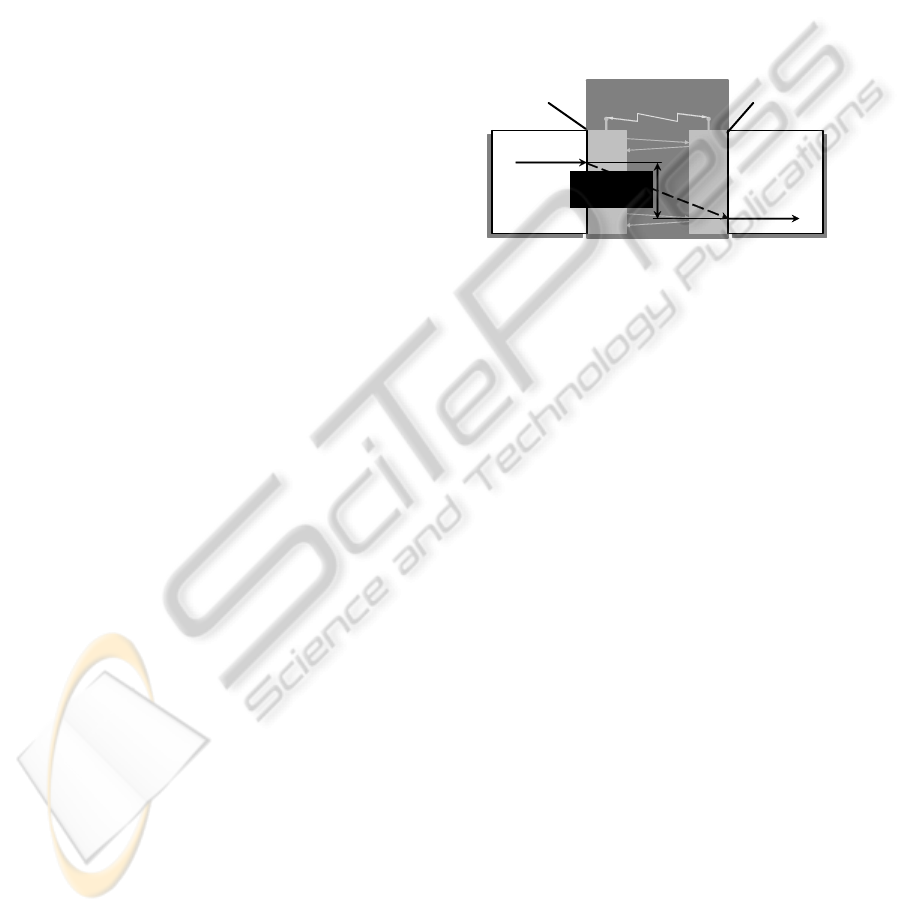
Figure 2: Test architecture.
The test architecture is shown in Figure 2. The
devices under test (WLAN client and WLAN access
point) are put into separate radio proof enclosures.
The test boxes achieve an attenuation of 90 dB
against the outer environment. The radio interfaces
of access point and client are connected by an
antenna cable. It is led via a power splitter and a
dynamically changeable attenuator. This approach
excludes interferences to the radio communication.
The dynamic attenuation has been configured to
a constant value of 57 dB. Together with the
attenuation of splitter and antenna cable the total
attenuation is 60 dB as specified for the test cases.
Besides the relevance of this value for automation
applications it has been shown that in this way the
transmit signal is low enough to avoid an
overmodulation and high enough to be unaltered.
The second output of the power splitter is connected
to another static attenuation of 56 dB in order to
connect a WLAN packet analyser. A second power
splitter is used in order to provide the signals to two
channels of the WLAN packet analyser. This
increases the reliability of the packet monitoring.
The total attenuation between client and WLAN
analyser is 62 dB. The total attenuation between
access point and analyser is more than 133 dB. Thus
the analyser captures only the packets transmitted by
the client.
The test packets are generated by an Ethernet
tester which transfers the data to the WLAN client.
As mentioned before the user data length is 64
octets. The generated packets are compliant to
PROFINET-IO telegrams. The advantage is the
specific frame type and content which simplifies the
identification of packets during analysis.
The packets transferred by the WLAN client are
monitored by WLAN analyser. If the packets are
successfully received by the WLAN access point
they are transferred to the Ethernet tester and are
monitored there also.
During analysis in a first step the user data
packets are filtered out of the packets monitored by
the WLAN analyser. Since every user data packet
can be identified by a unique payload it can be found
within the user data packets monitored by the
WLAN analyser. If a user data packet is listed more
than ones it means retries has been initiated by the
WLAN client because of missing
acknowledgements. This way the retry rate can be
calculated.
In addition a timestamp is included within the
user data. With help of this timestamp the Ethernet
tester is able to calculate the transmission time for
every successfully received packet.
4 TEST RESULTS
4.1 Transmission Delay
The measured transmission time consists of random
and constant components (see also Rauchhaupt, L.,
Krätzig, M., 2008.). Examples for constant
components are the frame spacing times or the
signal propagation delay on the wireless medium.
These components have the same values in every
measurement of a sample. The random nature of the
transmission time is being caused by latency of
application interface and implementation, by the
IMPACT OF DIFFERENT BIT RATES ON PERFORMANCE CHARACTERISTICS OF INDUSTRIAL WLAN
SOLUTIONS
389
technology variable, the number of packet retries
and the time allocation for additional connections.
Therefore, stochastic methods are required in
order to analyse the measurement results. Statistic
parameters such as mean value, median, standard
deviation, 95%-percentile (p95), maximum and
minimum value of a test case can be analysed.
0
0.5
1
1.5
2
2.5
3
3.5
4
4.5
5
0 102030405060
Bit ra te [MBit/s]
Transm ission delay [m s]
Max 1st attempt
Mean value
Max with retries
DSSS
OFDM
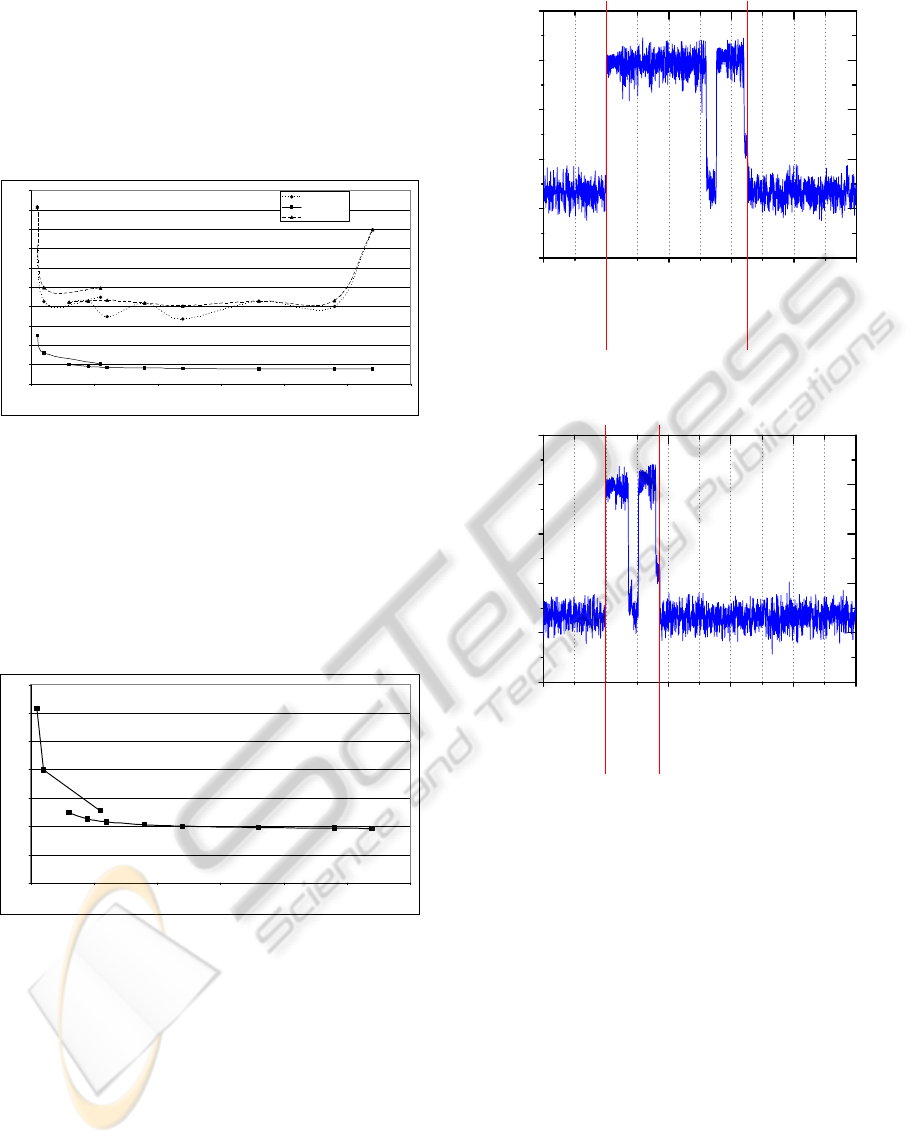
Figure 3: Transmission time for first attempt and including
all retries.
In Figure 3 then mean value of the transmission
time including all packets retries is depicted.
Furthermore the maximum transmission time values
out of all value which are received after the first
attempt is shown as well as the maximum
transmission time values of all successfully received
packets.
0
0.2
0.4
0.6
0.8
1
1.2
1.4
0 102030405060
Bit ra te [MBit/ s]
Transmission delay [ms]
DSSS
OFDM
Figure 4: Delay for transmissions without retries.
The first result is that the maximum values for a
certain bit rate are almost the same independent how
often a packet is retransmitted. Since there is no
contention on the medium it can be concluded that
the maximum values of the transmission time are
determined in the first line by the implementation
including interfaces from and to Ethernet.
The second result is that the value of the outliers
increases dramatically for 54 Mbit/s, while the mean
value is similar to all other bit rates.
0 100 200 300 400 500
-80
-70
-60
-50
-40
-30
Level [dBm]
Time [µs]
240 µs at 6 MBit/s
Figure 5: Medium utilisation time at 6 Mbit/s.
0 100 200 300 400 500
-80
-70
-60
-50
-40
-30
Level [dBm]
Time [µs]
190
µ
s at 54 MBit/s
Figure 6: Medium utilisation time at 54 Mbit/s.
Since the influence of the number of
retransmissions is not very significant in Figure 4
only the mean values of the transmission time are
depicted for those packets which are received at the
first transmission attempt.
The diagram shows that at low bit rates the
differences between the neighbouring values are
high. The differences become smaller with higher bit
rates. However, from 12 Mbit/s on the increase of
the mean values is very low. The reason for that
behaviour is the time for a packet on the medium.
Figure 5and Figure 6 show the signal power level
of a WLAN data packet and an acknowledge frame
during transmission on the medium. It can be seen
that the increase of the bit rate by 9 (from 6 Mbit/s
to 54 Mbit/s) causes only a decrease of the medium
utilisation time by about 1.3 (from 240 µs to 190
µs). The reason is that because of the backward
ICINCO 2010 - 7th International Conference on Informatics in Control, Automation and Robotics
390
compatibility of the WLAN standard parts of a
packet are transferred with 1 Mbit/s or 2 Mbit/s.
With 64 octets user data only this aspect has
remarkable influence on the transmission time.
0
0.2
0.4
0.6
0.8
1
1.2
1.4
0 102030405060
Bit ra te [MBit/s]
Media utilization [ms]
DSS S
OFDM
Figure 7: Media utilization time for different bit rates.
Figure 7 illustrates the medium utilisation time
over the bit rate. As shown in Figure 5and Figure 6
the medium utilisation time is defined as time
duration from the beginning of a data packet
transmission up to the end of the related
acknowledgement. Retransmissions are not
considered. The curves in Figure 4 and Figure 7
show a similar characteristic. This underlines the
influence of the medium utilisation time on the
transmission time.
In addition the curves in Figure 7 indicate also
another effect. The WLAN standard IEEE 802.11
specifies different coding and modulation schemes
as listed in Table 1.
Table 1: Overview of the transmission method and
modulation for each data rate.
Data rate Method Modulation
1 MBit/s DSSS DBPSK
2 MBit/s DSSS DQPSK
5.5 MBit/s DSSS DQPSK
6 MBit/s OFDM BPSK
9 MBit/s OFDM BPSK
11 MBit/s DSSS DQPSK
12 MBit/s OFDM QPSK
18 MBit/s OFDM QPSK
24 MBit/s OFDM 16 QAM
36 MBit/s OFDM 16 QAM
48 MBit/s OFDM 64 QAM
54 MBit/s OFDM 64 QAM
Theses schemes are related to the configurable
bit rates. In particular the coding scheme Direct
Sequence Spread Spectrum (DSSS) and Orthogonal
Frequency Division Multiplex (OFDM) have
different impacts on the medium utilisation time.
Therefore, the curves are separated for theses coding
schemes in Figure 3, Figure 4 and Figure 7.
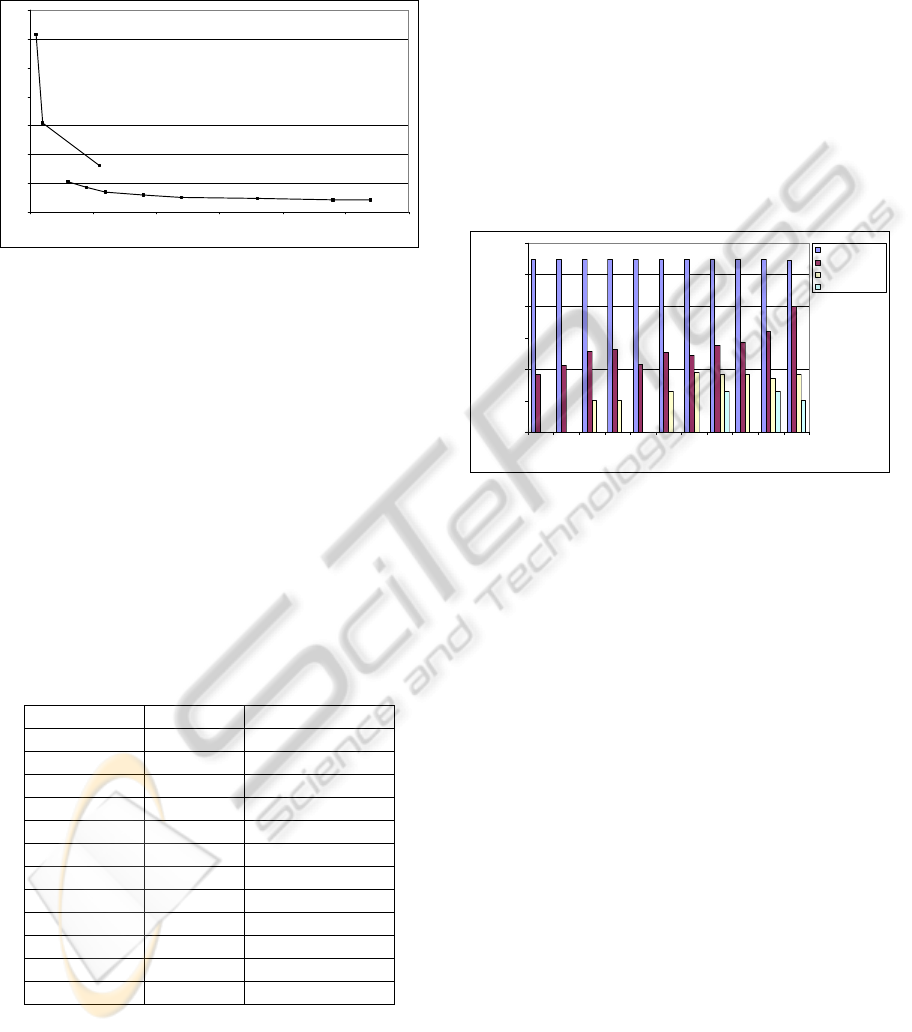
4.2 Number of Retransmissions
The bar chart in Figure 8 depicts the number of
packet transmissions needed for a correct reception
by the access point. A logarithmic scale is chosen
for the number of transmissions in order to see the
small number of retransmissions. The interesting
fact of this picture is that while using bit rates
related to DSSS coding the maximum number of
retransmission is one. Obviously this coding scheme
is more robust than OFDM.
0.1
1
10
100
1000
10000
100000
1 2 6 9 11 12 18 24 36 48 54
Bit rate [Mbit/s]
Number of packets
1. Transmission
2. Transmission
3. Transmission
4. Transmission
Figure 8: Number of packet retransmissions over bit rate.
For all bit rates related to DSSS the entire
number one retransmission is about ten. In test cases
with bit rates related to OFDM coding a number of
packet transmissions with at least two
retransmissions can be noticed. Especially for higher
bit rates also up to four retransmissions can be seen.
The diagram in Figure 9 illustrates the total
number of PROFINET-IO packet transmissions sent
by the WLAN client via the medium. This means the
transmission of all data packets including all
retransmissions. Figure 9 shows almost constant
values for DSSS bit rates. They are concentrated
next to the lower limit of 30000 packets. The OFDM
bit rates do not have such a constant behaviour.
However, for low OFDM bit rates only little
differences exist. At higher bit rates the number of
packet transmission increases. Especially for 54
Mbit/s the number of required transmission is
remarkable high. For this bit rate 31000 WLAN
packets are required to transmit 30000 Ethernet
packets. This results in a retry overhead of about 3.3
percent.
IMPACT OF DIFFERENT BIT RATES ON PERFORMANCE CHARACTERISTICS OF INDUSTRIAL WLAN
SOLUTIONS
391

29800
30000
30200
30400
30600
30800
31000
31200
0 102030405060
Bit rate [MBit/s]
Sum of transmitted packets
OFDM
DSSS
Figure 9: Total number of packet transmissions.
4.3 Loss Probability
Based on the discussion of retransmissions the loss
probability shall be determined. Out of the results
shown in Figure 8 a geometric distribution is
assumed. The geometric distribution deals with the
number of independent trials required for a single
success. A famous example of this distribution is
tossing a coin until it lands on heads.
The formula given in equation 1 describes the
expectation value E(X) of required transmissions for
each bit rate. Whereas N is the sample size, i is the
indicator of the transmission attempt and k
i
is the
frequency of an attempt within a test case.
()
ik
N
XE
n
i
i
⋅⋅=
∑
=1
1
(1)
N in formula 1 has not been calculated as shown in
equation 2 since the sample size is well known for
the test cases.
∑
=
=
n
i
i
kN
1
(2)
The estimation of the success probability p of a
packet transmission is equivalent to the reciprocal of
the expectation value E(X) of required transmissions
(Formula 3).
()
XE
p
1
ˆ
=
(3)
With the well-known equation 4 it is easy to get the
loss probability out of the success probability.
pq
ˆ
1
ˆ
−=
(4)
Figure 10 illustrates the loss probability for
different bit rates, which has been calculated with
the last-mentioned equations. In this picture we
differentiate again between DSSS and OFDM
method. The diagram is similar to the one of Figure
9. The only difference is the normalised ordinate.
Additionally, the figure presents low loss
probabilities for DSSS bit rates. On the other hand
values for OFDM bit rates are essentially higher.
However, for a wide range the values are almost
constant. Furthermore, the abovementioned extreme
value at 54 MBit/s exists also in this figure. In
summary the diagram underlines the results
concerning the robustness of DSSS coding scheme.
OFDM bit rates are not recommended with respect
to a robust communication.
0
0.005
0.01
0.015
0.02
0.025
0.03
0.035
0 102030405060
Bit ra te [MBit/s]
Loss probability
OFDM
DSS S
Figure 10: Loss probability for different data rates.
5 COST FUNCTION
In order to consider all the above mentioned aspects
for the assessment of a wireless system a cost
function has been developed. It is a trade of between
(a high) transmission time and (a low) loss
probability. Therefore the values of the transmission
time measured in section 4.1 and the loss probability
values calculated in section 4.3 are used. For further
discussions the cost function shall depend on the bit
rate. In addition the values should not have a
dimension unit.
Therefore, the mean values of the transmission
time for packets without retransmissions are used.
Thus the influence of retransmissions on the time
behaviour is avoided. In order to get values free of
dimension units the transmission time values are put
in a ratio to the shortest transmission time mean
value. This value belongs to a bit rate of 54 MBit/s.
Thus the value of bit rate 54 MBit/s is assigned to
the ratio of one in the cost function. All other bit
rates have values greater than one. The ratio for 1
MBit/s is the highest and is almost three times
greater than for the reference bit rate.
The second part of the cost function is the loss
probability. It is multiplied by the transmission time
ratio. The complete formula is given in equation 5.
ICINCO 2010 - 7th International Conference on Informatics in Control, Automation and Robotics
392

()
1
ˆ
() ()
(54 / )
1
tDR
TD
CDR qDR
tMBits
TD
=⋅
(5)
The cost for different bit rates is illustrated in the
diagram of Figure 11.
0.005773444
0.000617575
0.001798285
0.00162177
0.000747109
0.000899086
0.001564179
0.002632732
0.002842077
0.031164218
0.001415751
0
0.005
0.01
0.015
0.02
0.025
0.03
0.035
0 102030405060
Bit ra te [MBit/s]
Cost
Figure 11: Cost function of WLAN packet transmissions.
The diagram shows a general trend. The cost
values increase with higher bit rates. This means
better communication behaviour can be expected
with lower bit rates.
Taking a deeper look to the cost function the
minimum is visible at 11 MBit/s. As in the figures
before this diagram also offers the maximum at
54 MBit/s.
Bit rates lower than 24 MBit/s are almost in the
same range of values. However, there is no constant
increasing of cost values with higher bit rates. At bit
rates greater or equal than 24 MBit/s the trend of the
cost function rises noticeably.
6 CONCLUSIONS
The focus of this paper was the investigation of the
influence of bit rates on the reliability and
performance of WLAN systems with respect to
industrial automation applications. Thus the test
setup and the values of the influencing parameters
reflect the communication requirements of this
application field.
A first result of the measurements is the
confirmation of the generally way of thinking.
Higher bit rates cause shorter transmission time
values. On the contrary lower bit rates cause less
packet retransmissions. However, in the context of
industrial automation a more detailed look at the
results is necessary.
Thus there is an important finding, that there are
differences between the coding schemes DSSS and
OFDM. Obviously DSSS shows a more robust
behaviour than OFDM. DSSS is included in IEEE
802.11 b. In contrast IEEE 802.11 g uses OFDM in
favour. However, in order to be compatible with
IEEE 802.11 b devices IEEE 802.11 g also supports
bit rates using DSSS. With this background the user
can choose DSSS for more reliable connections or
OFDM for faster transmissions.
Another result is that the maximum values of the
transmission time are more influenced by the
implementation than by the number of
retransmissions. Thus optimisation potential of the
WLAN implementation can be detected using the
presented test approach. In fact there are remarkable
differences between industrial WLAN solutions as
investigated by the authors in other tests projects.
However, also the retransmissions play an
important role when a congested medium is taken
into account what was excluded in the given
investigations.
Therefore a cost function was introduced that
opens the possibility to consider transmission time
and required retransmissions for a successful
communication. It can help to find the appropriate
trade-off between a fast and a reliable wireless
connection. As shown in Figure 11 a transmission
with 11 MBit/s has the lowest cost value and is
therewith the best trade-off with respect to
considered application field. Also other bit rates of
the IEEE 802.11 b specification, which uses DSSS
and the corresponding modulations, showed an
appropriate behaviour. The worst behaviour offer
transmissions with 54 MBit/s. This fact disagrees
with the popular opinion that a high bit rate is the
best solution real-time automation applications. In
addition the investigations show that even the
medium utilisation with 54 Mbit/s is the highest
because of the retransmissions. This is an important
outcome with respect to the required efficient
spectrum use in order to support coexistence
between wireless systems.
Other interesting points of the explained
measurements are the lower costs of 12 Mbit/s and
18 MBit/s in comparison to 6 Mbit/s and 9 Mbit/s.
The rates of 24 Mbit/s and 36 MBit/s are also
acceptable.
As a conclusion the best bit rates for industrial
automation applications are the ones of the IEEE
802.11 b specification. With the focus on fast
transmissions bit rates between 12 Mbit/s and 36
MBit/s could be chosen. The bit rates 6 Mbit/s, 9
Mbit/s, 48 Mbit/s and 54 MBit/s should be avoided.
IMPACT OF DIFFERENT BIT RATES ON PERFORMANCE CHARACTERISTICS OF INDUSTRIAL WLAN
SOLUTIONS
393

REFERENCES
EN 61491, 1999. Electrical equipment of industrial
machines– Serial data link for real-time
communication between controls and drives
EN 61209, 2000. Maritime navigation and
radiocommunication equipment and systems-
Integrated bridge systems (IBS)- Operational and
performance requirements, methods of testing and
required test results
VDI/VDE-Guideline 2185, 2007. Radio based
communication in industrial automation
Dzung, D., Apneseth, C., Endresen, J., Frey, J.-E., 2005.
Design and Implementation of a Real-Time Wireless
Sensor/Actuator Communication System, 10.1109/
ETFA.2005.1612710, Volume: 2, pp. 10 – 19, ISBN:
0-7803-9401-1
Siemens, 2007. Industrial mobile communication, Siemens
AG, Order No. 6ZB5530-1AM02-0BA2
Rauchhaupt, L., Krätzig, M., 2008. How to Assess
Reliability of Industrial Wireless Solutions, 5th
International Conference on Informatics in Control,
Automation and Robotics (IFAC), 11-15 May, 2008,
Funchal, Madeira, In: Proceeding , Volume 1 Robotics
and Automation, Pages 122-130, ISBN: 978-
989-8111-31-9, CD
Rauchhaupt, L., 2009. Radio Technology for Real-Time
Application - The flexWARE Project, ETSI Wireless
Factory Starter Group Meeting N° 1, ETSI, Sophia
Antipolis, France, 20 - 21 October 2009, In:
http://portal.etsi.org/docbox/Workshop/2009/200910_
WIFA [access 24.10.2009]
Gnad, A., Krätzig, M., Rauchhaupt, L., Trikaliotis, S.,
2008. Relevant Influences in Wireless Automation, 7th
IEEE International Workshop on Factory
Communication Systems, COMMUNICATION in
AUTOMATION (WFCS 2008), May 20-23, 2008,
Dresden, Germany, ISBN: 978-1-4244-2350-7, CD
ZVEI, 2009. Coexistence of Wireless Systems in
Automation Technology - Explanations on reliable
parallel operation of wireless radio solutions.
Frankfurt, Germany, 2009, https://www.zvei.org/
fileadmin/user_upload/Fachverbaende/Automation/Pu
blikation/ZVEI_Coexistence_of_Wireless_Systems_in
_Automation_Technology.pdf, [access 01.02.2010]
Trsek, H., 2008. Reproduzierbare Leistungsmessung und
Konformitäts/Interoperabilitätstests von IEEE 802.11
WLAN Implementierungen. 10th Wireless Techno-
logies Congress, Bochum, Germany
ICINCO 2010 - 7th International Conference on Informatics in Control, Automation and Robotics
394
