
SMART HOME
From User’s Behavior to Prediction of Energy Consumption
Lamis Hawarah, Mireille Jacomino and Stephane Ploix
Laboratoire G-SCOP, INP Grenoble, UJF, CNRS, 46 Avenue Felix Viallet, 38031 Grenoble, France
Keywords:
Energy consumption, User’s behavior, Bayesian network, Learning system.
Abstract:
This paper concerns a home automation system of energy management. Such a system aims at keeping under
control the energy consumption in housing. The expected energy consumption is scheduled over one day.
Each hour a total amount of energy is available that is a resource constraint for the expected energy plan. The
expected consumption is totally derived from users behavior which are quite different from one housing to
another, and rather difficult to predict. This paper proposes a Learning System to predict the user’s requests of
energy. The proposed method relies on Bayesian networks.
1 INTRODUCTION
A Home Automation System basically consists of
household appliances connected by both energy and
communication networks. Smart Home and more
generally Smart Building are spreading out. They
aims at first increasing comfort and security, second
enabling remote access to information about the ap-
pliances and the buildings and third managing the ap-
pliances. The system addressed in this paper is con-
cerned with energy management in Smart Home. It
aims at planning the best energy assignment satisfy-
ing the availability energy constraints and the users’
requests (Palensky et al., 1997), (HA et al., 2006).
In this paper, energy is restricted to the electric con-
sumption. (HA et al., 2006), (Abras et al., 2007)
present a three-layers household energy control sys-
tem: anticipative layer, reactive layer and device
layer. The anticipative layer depicted in (Ha, 2005)
and (Abras et al., 2008) is mainly concerned with the
energy plan. The anticipative plan relies on predic-
tions of environmental parameters (weather forecast,
solar radiation, ...) and energy consumption.
In order to keep under control the total amount
of consumed energy every hour, and then avoid peak
consumptions and minimize the energy cost, the
Home Automation System has to schedule as much as
possible the energy consumptions in the most appro-
priate time periods. For example, the washing ma-
chine could be planned before or after the oven in
a low energy cost period as far as such a plan sat-
isfies the predicted user’s request. The efficiency of
the anticipated plan is as good as the prediction of the
user’s request. Indeed if the actual user’s behavior is
far from the predicted one, then the reactive layer has
to stop an appliance in order to satisfy the available
energy constraint for example, and schedule this ap-
pliance later without any energy cost optimization.
This paper focuses on the prediction of the user’s
behavior. A Learning System is proposed to predict
the inhabitant’s requests for each hour of a 24 hours
anticipative time period. The system is based on the
use of Bayesian Network to predict the user’s behav-
ior. Bayesian Networks (BNs) are a field of Machine
Learning, capable of representing and manipulating
arbitrary probability distributions over arbitrary ran-
dom variables (Russell and Norvig, 2003), (Na¨ım
et al., 2004). They are especially well suited for mod-
eling uncertain knowledge in expert systems (Hecker-
man, 1995). The paper is organized as follows: first,
related works concerning the use of household appli-
ances are presented. The next section shows the way
how a Bayesian Network can be used. The proposed
approach to predict the user’s behavior in housing is
explained in section 2. A real database concerning
100 houses in France is used to build standard pro-
files from which the Learning System deducesthe pre-
dicted user’s behavior. Finally, some results and per-
spectives are discussed.
1.1 Related Works
Various works have been done to study the impact
of the user’s behavior on the energy consumption in
147
Hawarah L., Jacomino M. and Ploix S. (2010).
SMART HOME - From User’s Behavior to Prediction of Energy Consumption.
In Proceedings of the 7th International Conference on Informatics in Control, Automation and Robotics, pages 147-153
DOI: 10.5220/0002947901470153
Copyright
c
SciTePress

the housings. (Wood and Newborough, 2003), (Wood
and Newborough, 2007) study the interaction be-
tween the user and the appliances. The appliances
are classified into four categories according to their
level of automation and the number of settings. For
the appliances with low level of automation the user
needs to be in the proximity of the appliances to be
set. They achieved up to 10∼20% reduction in energy
consumption of households by changing the user’s
behavior. Other studies are interested in modeling
and simulating the activities of the user (Zimmer-
man, 2007). The activities of one and several peo-
ple are integrated into simulators of buildings perfor-
mances to get more use dependent results. This ap-
proach models all users as individual agents with dif-
ferent behaviors. Different functions and functional
units such as work places are modelled also. The
main results of this work is that the activities of in-
dividuals and groups in office environments can be
modelled on the basis of communicating agents. (Ha
et al., 2006) studies and analyzes the user’s behavior
in housing to make embodiment of user’s interface in
Ubiquitous environment. Behavior patterns are ana-
lyzed by classifying data into 5W(who, what, where,
when and why) and 1H (How). All these works fo-
cuses on the design of displays in order to change the
user’s behavior.
1.2 Bayesian Networks
A Bayesian Network (BN) is a graphical model
for probabilistic relationships among a set of vari-
ables (Pearl, 1986). BNs model causal relation-
ships. They are represented as directed acyclic
graphs, where each node represents a different ran-
dom variable. A directed edge from the node X (cause
node) to the node Y (effect node) indicates that X has
a direct influence on Y. This influence is quantified by
the conditional probability P(Y|X), stored at node Y.
The nodes in a network can be of two types: evidence
node when its value is observed, and query node when
its value has to be predicted. A Conditional Prob-
ability Table (CPT) is assigned to each node in the
network. Such probabilities may be set by an ex-
pert or using a registered data. BNs are based on the
conditional independence; each node is conditionally
independent of its non-descendants given its parents.
When a node has no parent, its CPT specifies the prior
probability. There are two types of learning: 1) the
structure learning in which the best graph represent-
ing the problem is searched; 2) the parametric learn-
ing in which the structure of the network is known
and the conditional probability is estimated at each
node. Once the Bayesian Network is constructed, it
Figure 1: Bayesian Network for Coma problem.
can be used to compute the probability distribution
for a query variable, given a set of evidence variables.
This operation is called inference. For example, one
can identify the causes by calculating the most prob-
able cause given some information (Figure 1), or pre-
dict the effects of a cause by calculating the most fre-
quent value of a node given some observations. Ex-
act and approximate approaches of inference can be
used (Russell and Norvig, 2003), (Na¨ım et al., 2004).
Bayesian Networks are used in a large range of ap-
plications: telecommunications (Ezawa and Schuer-
mann, 1995), display management for time-critical
decisions (Horvitz and Barry, 1995), industry (Hart
and Graham, 1997), health (Becker et al., 1998), com-
munication (Barco et al., 2002), etc.
2 PROBLEM STATEMENT
The objective of the work presented in this paper is to
propose aLearning System able to deliverto the Home
Automation System the useful information about the
energy consumption in a given housing. This useful
information is the prediction of the user’s requests. A
preliminary step consists in identifying a set of stan-
dard profiles of the users’ requests. Then the Learn-
ing System has two tasks: 1) First, identify the most
appropriate standard profile for a given user in or-
der to exhibit the corresponding prediction of the en-
ergy consumption at each hour; 2) Second, built the
learnt model of the energy consumption. The stan-
dard profiles are defined for each appliance and asso-
ciated service to the inhabitants. They are built us-
ing a database. A questionnaire is used to identify
the most appropriate standard profile for a given user.
The questions concern the appliances in housing, the
frequency of their use, etc.
The proposed method is depicted in the figure2.
After the standard starting profile has been chosen
for each service it is integrated in a Bayesian Net-
work which will predict the actual user’s requests.
The actual energy consumption of the user is sent
ICINCO 2010 - 7th International Conference on Informatics in Control, Automation and Robotics
148
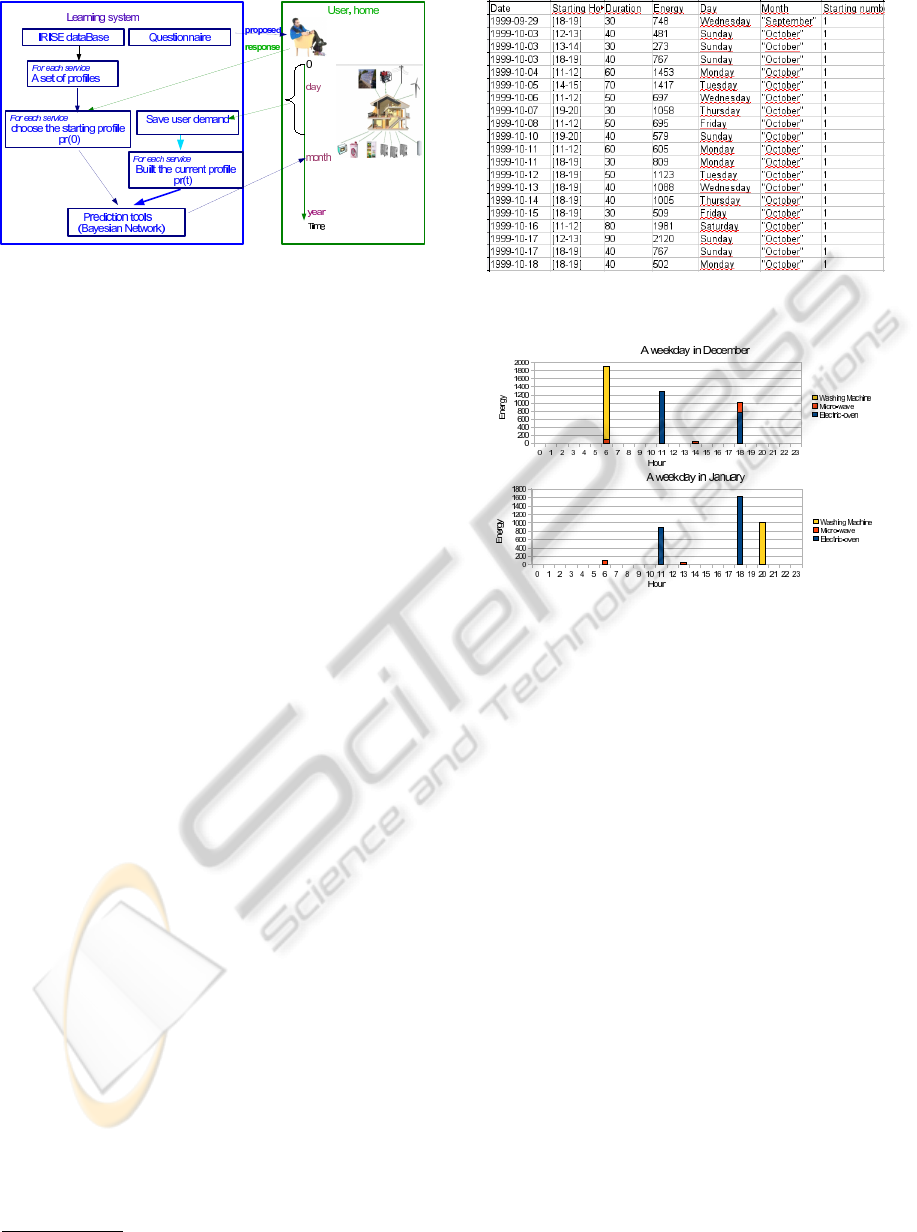
Figure 2: Structure of the Learning System.
to the Learning System also. This observation con-
cerns the actual consumption of the appliances, the
date, the hour, the consumed energy and the duration.
After some time of observation, the Learning System
can build the new profile dedicated to the actual re-
quests of the user. In this paper, the process to iden-
tify the standard profiles and the Bayesian model of
the Learning System are described.
3 BUILDING THE STANDARD
PROFILES
3.1 Energy Database
The project Residential Monitoring to Decrease En-
ergy Use and Carbon Emissions in Europe (REMOD-
ECE)
1
provides an energy database. This is a Euro-
pean database on residential consumption, including
Central and Eastern European Countries, as well as
new European Countries (Bulgaria and Romania).
This database stores the characteristics of the res-
idential electric consumption by country. The IRISE
project is a part of REMODECE. It has been chosen
for our study to identify the standard profiles pr(0).
It deals only with houses in France. One database
is available for every house; in such a database, the
information is recorded every 10 minutes during one
year for each appliance in the house . The consumed
energy at every time period by every appliance is
given in this database. However, these data have to
be processed before using.
It is possible to know the number of people who
live in each house. The presence of the user is impor-
tant for the energy consumption but it is not explicitly
known in the database.
1
http://www.isr.uc.pt/∼remodece/
Figure 3: The database after treatment for the Electric-oven.
Figure 4: The consumed energy in a weekday in January
and in December.
3.2 Data Preprocessing
From the IRISE data, a user’s request concerns one or
more services like cooking in oven, clothe washing,
water heating, etc. A standard profile is a structured
information derived from these raw data for every ser-
vice. The Home Automation System anticipates the
energy consumption from the following information
about the user’s requests:
• When is the service requested?
• How much energy does the service consume?
• What is the duration of the service?
This information is available in the database ex-
cept for the duration. The figure 3 shows the prepro-
cessed data for one appliance. Each row is the set of
interesting information for one hour in the year: du-
ration, energy, day, month, the number of times that
the appliance has been started during the hour is also
extracted from the raw data.
Analyzing the data one can notice 1) first the ac-
tual diversity of the use of each appliance in a given
house and 2) second how difficult it is to characterize
this use. The figure 4 shows the mean consumption
SMART HOME - From User's Behavior to Prediction of Energy Consumption
149
of the Electric-oven, the Micro-wave and the Washing
machine in a weekday in January and in a weekday in
December. The consumed energy is not identical at
the same hour in the two months. Nevertheless, some
similarities exist. A standard profile gives the prob-
ability that the appliance will be started at each hour
and the associated expected energy consumption for
different types of days statistically representative.
Given only one day, for example Monday, the ob-
tained information is very accurate. But the learning
of such an information would be long, because an ob-
servation and the derived statistical process could be
involved every seven days for one given day in the
week. On the other hand, the average value obtained
overall the year without any differentiation among the
days would not be interesting because the derivedpre-
diction would be an average very far from each actual
request.
3.3 Statistical Picture
A profile is a statistical picture of a service in a hous-
ing. This statistical study is performed over a time
period that is the largest period allowing to compute
significant probabilities. A time period may be the
day, the month or the day in a month. For each ser-
vice, for a chosen time period, the profile consists of:
• The conditional probability that the service starts
every hour;
• The average duration every hour;
• The average consumed energy every hour;
The value of the conditional probability, the dura-
tion or the energy for a service are calculated from the
preprocessing data.
It can also be useful to calculate the probability
that the appliance starts at each hour over all the year
without taking into account any time period. This
kind of information can be used to briefly depict the
profiles and then identify the most appropriate profile
to a given user.
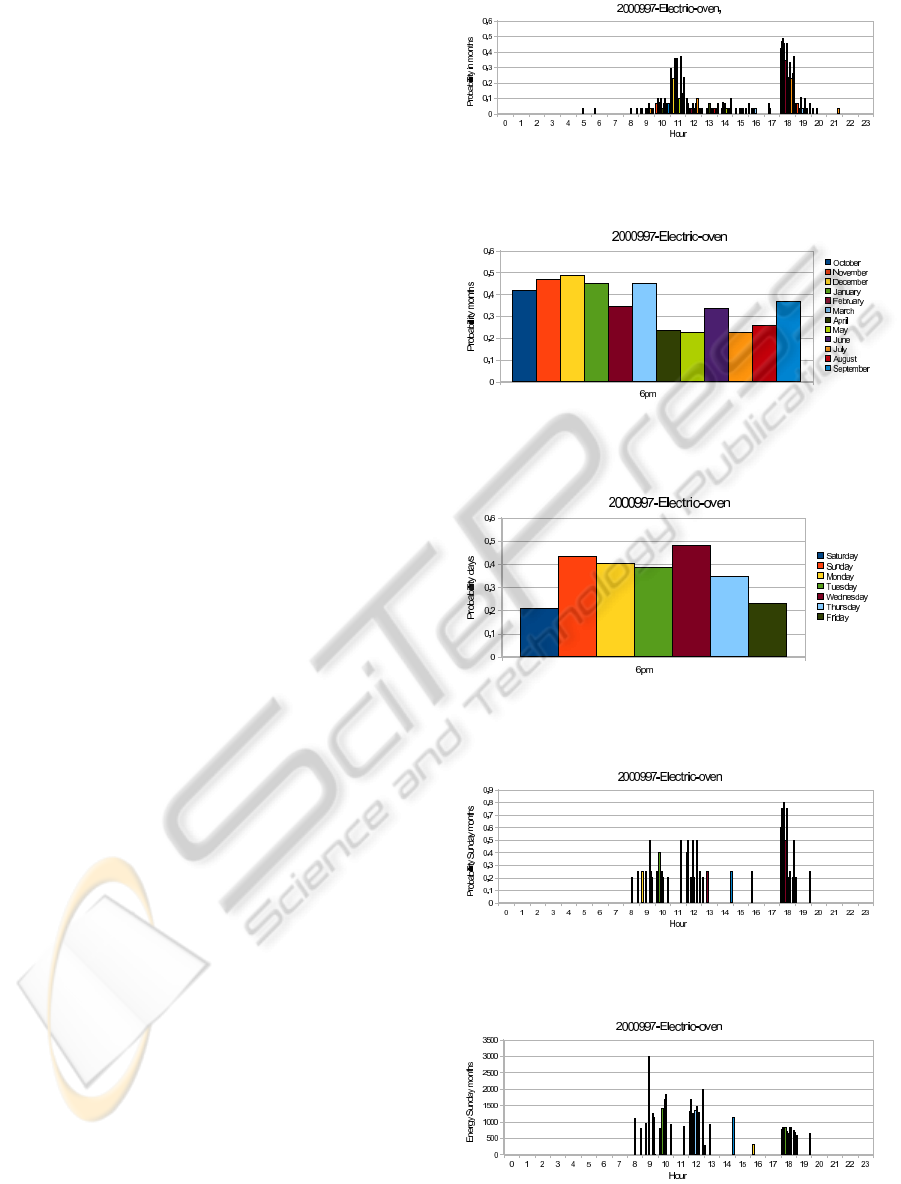
Parts of the profile of the Electric-oven service
taken in example are depicted in the figures 5- 9.
These profiles concern the house 2000997 from the
IRISE database.
The figure 5 represents the probability that the
Electric-oven starts at each hour for each month over
one year, from October to September. For example,
the probability that the Electric-oven starts at 6 pm
in October is 0.41 (figure 6). The figure 7 shows the
probability that the Electric-oven starts at 6 pm for
each weekday. For example, the probability on Sun-
day at 6 pm is 0.2. The probability that the Electric-
oven starts at 6 pm in October on Sunday is 0.60 (fig-
Figure 5: The probability of the Electric-oven in the house
2000997 on months.
Figure 6: The probability of the Electric-oven in the house
2000997 at 6pm on months.
Figure 7: The probability of the Electric-oven in the house
2000997 at 6pm on days.
Figure 8: The probability of the Electric-oven in the house
2000997 on Sunday over all the months.
Figure 9: The Energy of the Electric-oven in the house
2000997 on Sunday over all the months.
ICINCO 2010 - 7th International Conference on Informatics in Control, Automation and Robotics
150

ure 8). The average energy of the Electric-oven at 6
pm in October on Sunday is 751Wh (figure 9). Such
profiles can be exhibit for the service duration as well.
4 LEARNING BAYESIAN
SYSTEM
The Bayesian Network is used to predict the user’s
requests. The Conditional Probability Distribution at
each node of the BN is computed from both the stan-
dard starting profile and the actual observations of en-
ergy consumption in the housing. There are two types
of nodes in this network: 1) the probabilistic nodes in
which a Conditional Probability Table is associated;
2) the deterministic nodes which values are specified
exactly by the values of its parents, with no uncer-
tainty (Russell and Norvig, 2003). For the determin-
istic nodes, the probability distributions are no longer
needed to be specified, but instead only certain states.
In this work, all the energetic services in the house
like the cooking service or the washing service, etc
are represented in the Bayesian Network. There are
three causal nodes in the Learning System:
• Hour with 24 values from 0 to 23
• Month with 12 values from January to December
• Day with 7 values from Saturday to Friday
All these nodes are probabilistic.
Three nodes are associated to each service in the
housing:
• Starting of the service with tow values {yes, no}
• Energy which is a deterministic node
• Duration which is a deterministic node
To simplify the presentation of the network, only the
Electric-oven is dealt with during two days (Saturday
and Sunday) in October. The hour values are reduced
to 3 which are {11am, 12am, 1pm}. This network is
given in the figure 10.
The Conditional Probability Distribution corre-
sponding to the Starting Electric-oven node is part
of the profile of the Electric-oven. Given the hour,
the month and the day, the Home Automation System
uses this network to obtain the probability of starting,
the average energy and the average duration of the
services. For example, if the hour is Sunday 12am,
the Bayesian Network provides the probability 0.4 of
starting for the Electric-oven.
Figure 10: A part of the Bayesian Network.
4.1 Segmentation between Days and
Months
In order to exhibit the standard profiles from the
database with the best accuracy, the discriminating
parameters such as days and months have to be found.
For this purpose, a dissimilarity index and a clustering
algorithm are defined.
4.1.1 Dissimilarity Index
The probability that a service starts at each hour given
the day (figure 7) or the month (figure 5) is used to
identify if the days or the months discriminate the ser-
vice. Comparison between the months all over the
year is performed, as well as between the days all
over the year. The proposed Dissimilarity index is
based on the Manhattan distance given in the equa-
tion 1. It is used to calculate the difference between
two months or two days over 24 hours.
Dif f(X,Y) =
23
∑
i=0
|x
i
− y
i
| (1)
Where X=x
i
is the probability that the service starts in
a month (or day) A a each hour i; Y=y
i
is the proba-
bility that the service starts in another month (or day)
B . The label i represents the hour. Then, the Dissim-
ilarity index is defined as follows:
DI(X,Y) =
Dif f(X,Y)
∑
i
(x
i
+y
i
)
2
(2)
∑
i
(x
i
+y
i
)
2
is a normative coefficient from which the
Dissimilarity index measures the relative dispersion
of the starting probability over the months (or days).
Therefore, when the value of DI(X,Y) is small, X
and Y are close together. If DI(X,Y) is large, then
SMART HOME - From User's Behavior to Prediction of Energy Consumption
151

Table 1: Example of the Dissimilarity Index.
Days1 Days2 Diff
∑
i
(x
i
+y
i
)
2
DI Decision
Sat Sun 0,79 0,93 0,86 YES
Sat Mon 0,5 0,72 0,69 NO
Sat Tues 0,64 0,81 0,79 NO
Sat Wed 0,83 0,95 0,88 YES
Sat Thur 0,54 0,78 0,69 NO
Sat Fri 0,3 0,75 0,39 NO
Sun Mon 0,71 0,87 0,82 YES
Sun Tues 0,85 0,96 0,88 YES
Sun Wed 0,9 1,1 0,82 YES
Sun Thur 0,91 0,93 0,97 YES
Sun Fri y 0,85 0,9 0,94 YES
Mon Tues 0,37 0,76 0,48 NO
Mon Wed 0,6 0,89 0,67 NO
Mon Thur 0,39 0,73 0,53 NO
Mon Fri 0,56 0,7 0,79 NO
Tues Wed 0,38 0,98 0,39 NO
Tues Thur 0,21 0,82 0,26 NO
Tues Fri 0,46 0,79 0,59 NO
Wedy Thur 0,52 0,95 0,55 NO
Wed Fri 0,69 0,92 0,75 NO
Thur Fri 0,36 0,76 0,48 NO
X and Y are quite different. A threshold is arbitrary
fixed to 0.8.
An example is given in the table 1
2
. In this example
the difference between two days in the house 2000997
for the Electric-oven over all the year is calculated.
The difference between two days is significant if the
ratio between Dif f(X,Y) and
∑
i
(x
i
+y
i
)
2
is bigger than
the given threshold.
4.1.2 Clustering Algorithm
The Dissimilarity index given in the equation 2 helps
the Learning System to decide if two days or two
months can be merged for a given service. Then the
standard profile associated with this service is re-
duced in size and by the same time it will require less
observations to be adjusted to the actual user. This
type of treatment is called Clustering. Clustering can
be considered as the most important unsupervised
learning problem. It is a process of partitioning
a set of data (or objects) in a set of meaningful
sub-classes, called cluster (Zaane, 1999). A cluster
is therefore a collection of similar objects that are
dissimilar to the objects belonging to other clusters.
There are some clustering algorithms like K-means,
k-Medoid, hierarchical algorithm, etc. In this paper,
a clustering algorithm is proposed as follows based
on the Dissimilarity index. The objects can be the
2
Sat: Saturday, Sun: Sunday, Mon: Monday, Tues:
Tuesday, Fri: Friday, Wed: Wednesday, Thur: Thursday.
months or the days.
Segment( input E: Set of elements, DI: Dissimilar-
ity indexes; Output C: set of clusters C
e
)
1. Find the closest two elements (e
x
, e
y
) ;
DI(e
x
, e
y
) =Min{DI(e
i
, e
j
),
e
i
∈ E, e
j
∈ E, i 6= j}}
Add to C
e
if:
DI(e
x
, e
y
) < 0.8, then C
e
= {e
x
, e
y
}
2. If C
e
is empty then go to the step 7 else go to the
step 3
3. Calculate the set E
1
= E-C
e
4. For each element e
z
of E
1
if DI(e
z
, e
x
) < 0.8 and DI(e
z
, e
y
) < 0.8 then
add e
z
to C
e
5. Add the cluster C
e
to C
6. Segment(E - C
e
, DI, C)
7. For each element e
r
of E: Add e
r
to C
8. Return C
This algorithm takes a set of elements which may be
the starting probabilities at each hour over days or the
months. It takes also the Dissimilarity index between
each two elements (table 1). The first step of this al-
gorithm consists in finding the closest two elements
(e
x
, e
y
) which have the smallest Dissimilarity index.
Then, for every remaining element from E, the algo-
rithm finds all the other elements which are closer to
e
x
and e
y
than the given threshold. The obtained set
C
e
represents the first cluster. This algorithm is recur-
sive. It is iteratively called to find all the clusters. It
ends when the remaining Discrimination indexes are
all greater than the given threshold.
For example, the clusters obtained by applying
this algorithm on the table 1 are: C
1
= {Sat, Mon,
Tues, Wed, Thurs, Fri} and C
2
={Sun}. That means
that the use of the Electric-oven is different from the
other days on Sunday .
5 CONCLUSIONS AND
PERSPECTIVES
This paper focuses on the prediction of the user’s be-
havior in housing and his derived energy consump-
tion. It is a very important predictive problem in a
Home Automation System. The objective is to con-
struct a Learning System able to predict the user’s
ICINCO 2010 - 7th International Conference on Informatics in Control, Automation and Robotics
152

behavior in housing with regards to his energy con-
sumption. The proposed system builds a set of pro-
files from the IRISE databases for each appliance. A
profile is defined by the probability that the associated
service starts, the average consumed energy and the
average duration. Also, each profile is characterized
by the set of days and the set of months during which
the consumption is specific. A questionnaire is pro-
posed to the user concerning the use of its appliances.
The comparison between the response of the user and
the set of standard profiles allows to provide start-
ing standard profiles to the Home Automation System.
These values are introduced into a Bayesian Network
to be adjusted with the actual consumption of the user.
Future works will be dedicated to perform the seg-
mentation to the IRISE data in order to identify the
standard profiles. Then a questionnaire will be de-
fined and the way how to process the comparison be-
tween the response and the standard profiles will be
addressed.
REFERENCES
Abras, S., Ploix, S., Pesty, S., and Jacomino, M. (2007).
A multi-agent design for a home automation system
dedicated to power management. In Proceedings of
the IFIP Conference on Artificial Intelligence Appli-
cations and Innovations, Athen, Greece. Springer.
Abras, S., Ploix, S., Pesty, S., and Jacomino, M. (2008). An
anticipation mechanism for power management in a
smart home using multi-agent systems. In ICTTA’08:
Proceedings of the 3rd International Conference on
Information and Communication Technologies: from
Theory to Applications, pages 110–116, Damascus,
Syria. IEEE Computer Society.
Barco, R., Nielsen, L., Guerrero, R., Hylander, G., and
Patel, S. (2002). Automated troubleshooting of a
mobile communication network using bayesian net-
works. Mobile and Wireless Communications Net-
work, 2002. 4th International Workshop on, pages 606
– 610.
Becker, A., Geiger, D., Schffer, A. A., and Schaffer, A. A.
(1998). Automatic selection of loop breakers for ge-
netic linkage analysis. Human Heredity, 48:49–60.
Ezawa, K. and Schuermann, T. (1995). Fraud/uncollectible
debt detection using a bayesian network based learn-
ing system: A. In Proceedings of the 11th Annual
Conference on Uncertainty in Artificial Intelligence
(UAI-95), pages 157–16, San Francisco, CA. Morgan
Kaufmann.
HA, L., Ploix, S., Zamai, E., and Jacomino, M. (2006).
A home automation system to improve the household
energy control. In In INCOM2006 12th IFAC Sympo-
sium of Information Control Problems in Manufactur-
ing, Saint Etienne, France.
Ha, S., Jung, H., and Oh, Y. (2006). Method to analyze user
behavior in home environment. Personal Ubiquitous
Comput., 10(2-3):110–121.
Ha, D. L.; Ploix, S. Z. E. . J. M. (2005). Control of en-
ergy consumption in home automation by ressource
constraint scheduling. In The 15th International Con-
ference on Control System and ComputerScience.
Hart, P. E. and Graham, J. (1997). Query-free information
retrieval. IEEE Intelligent Systems, 12(5):32–37.
Heckerman, D. (1995). A tutorial on learning bayesian
networks. Technical report, Communications of the
ACM.
Horvitz, E. and Barry, M. (1995). Display of information
for time-critical decision making. In In Proceedings of
the Eleventh Conference on Uncertainty in Artificial
Intelligence, pages 296–305. Morgan Kaufmann.
Na¨ım, P., Wuillemin, P.-H., Leray, P., Pourret, O., and
Becker, A. (2004). R´eseaux bay´esiens. Eyrolles, Paris.
Palensky, P., Dietrich, D., Posta, R., and Reiter, H. (1997).
Demand side management in private homes by us-
ing lonworks. Vortrag: WFCS97 2nd IEEE Work-
shop on Factory Communication Systems, Barcelona,
pages 341 – 347.
Pearl, J. (1986). Fusion, propagation, and structuring in
belief networks. Artif. Intell., 29(3):241–288.
Russell, S. J. and Norvig, P. (2003). Artificial Intelligence:
A Modern Approach. Pearson Education.
Wood, G. and Newborough, M. (2003). Dynamic energy-
consumption indicators for domestic appliances: en-
vironment, behaviour and design. Energy and Build-
ings, pages 821–841.
Wood, G. and Newborough, M. (2007). Influencing user be-
haviour with energy information display systems for
intelligent homes. International journal of energy re-
search, vol. 31, no1:56–78.
Zaane, O. R. (1999). Principles of Knowledge Discovery in
Databases - Chapter 8: Data Clustering.
Zimmerman, G. (2007). Modeling and simulation of in-
dividual user behavior for building performance pre-
dictions. In SCSC: Proceedings of the 2007 summer
computer simulation conference, pages 913–920, San
Diego, CA, USA. Society for Computer Simulation
International.
SMART HOME - From User's Behavior to Prediction of Energy Consumption
153
