
A STUDY ON THE USAGE OF MOBILE DEVICES IN
COLLABORATIVE ENVIRONMENTS VS DESKTOPS
An Approach based on Flow Experience
Steven Abrantes
Institute Polytechnic of Viseu, Viseu, Portugal
Luis Borges Gouveia
Faculty of Science and Technology, University Fernando Pessoa, Porto, Portugal
Keywords: Flow experience, Mobile devices, Comparing mobile with desktop.
Abstract: In order to evaluate the use of mobile devices (laptops) and desktops and the potential of mobile devices in
collaborative environments vs desktops, it was performed an experiment involving one hundred and twelve
students of higher education. This study has the main objective to validate if the students that use laptops or
desktops are in the flow experience and which of them are more in the flow experience. This study is based
on the flow experience introduced by Csikszentmihalyi (1975). The main purpose of this study is to
establish whether the user is in the flow experience when using Google Groups when using laptops or
desktops. In the context of this study, information has been gathered through a survey, applying the five
dimensions of the flow state. The sample used consisted on one hundred and twelve students. At the end of
the study, after analyzing the gathered information, it was possible to conclude that students have
experienced the flow state and it had a positive effect on their learning experiences both by students using
laptops or desktops, but having the students that used the laptops a more positive effect in the flow
experience than the students that used desktops.
1 INTRODUCTION
Technological applications and the way they are
used has advanced in such a way that the
manipulation of learning objects is no longer limited
to a desktop, but extended to the use of mobile
devices (PDA, mobile phone, Smartphone, Laptops,
and Tablet PC) to provide a greater range of
application and obtain the benefits that mobile
computing offers in the education sector. This
results in the establishment of a new area of activity,
related with the use of mobile technologies in
learning, named m-learning.
This educational model based on the use of
mobile devices, has been developed over the past
few years, resulting in several research projects and
some commercial products. Current and past
promises of more learning outcomes are needed to
be evaluated.
2 M-LEARNING AND MOBILE
DEVICES
Quin cited by (Corbeil and Valdes-Corbei, 2007)
states that m-learning is the interaction of mobile
computing (small applications, portable, and
wireless communication devices) with e-learning
(learning facilitated and supported through
information and communication technologies).
We can see an widespread use of mobile devices
in our modern world: mobile phones, PDA’s, MP3
players, portable gaming devices, Tablet PCs and
laptops, which predominate in our everyday lives.
From children to older people, they are
increasingly linked with each other, communicating
through communication technologies, something
that didn’t happen a few years ago.
There are a number of mobile devices that can be
considered for an m-learning environment (Corbeil
and Valdes-Corbei, 2007): iPod , MP3 Players,
199
Abrantes S. and Borges Gouveia L. (2010).
A STUDY ON THE USAGE OF MOBILE DEVICES IN COLLABORATIVE ENVIRONMENTS VS DESKTOPS - An Approach based on Flow Experience.
In Proceedings of the International Conference on e-Business, pages 199-202
DOI: 10.5220/0002951801990202
Copyright
c
SciTePress
PDA, USB drive, E-Book Readers, Smart Phone,
Ultra-Mobile PC (UMPC) and Laptop/Tablet PC.
These mobile devices have some advantages and
disadvantages (Corbeil and Valdes-Corbeil, 2007).
One of the biggest advantages of mobile devices,
when compared with desktops, is its ubiquity. With
mobile devices people can connect to many kinds of
information where they want and whenever they
want.
3 THE FLOW EXPERIENCE
An aspect related with the interaction of the users
with collaborative environments has to do with the
flow experience introduced by Csikszentmihalyi
(1975). The flow experience means the sensation
that people feel when they are completely involved
in what they are doing, that is, people like the
experience and want repeat it (Csikszentmihalyi,
1982). This means that for students to be involved
with collaborative environments, it is necessary that
they presence the flow state.
The theory of the flow allows us to measure the
interaction of users with computer systems,
verifying if these are more or less playfulness
(Trevino and Webster, 1992).
The flow experience is used in this paper to
characterize the interaction between the human and
the new technologies (Trevino and Webster, 1992).
When one is in the presence of the flow experience,
this will bring to the users, a sense of pleasure of
what he is doing. This satisfaction will encourage
the user to repeat the task again (Webster et al.,
1993).
Csikszentmihalyi says that a person who is in the
presence of the flow state has the following
characteristics(Csikszentmihalyi,1975,
Csikszentmihalyi, 1990):
Clear goals and immediate feedback;
Equilibrium between the level of challenge
and personal skill;
Merging of action and awareness;
Focused concentration;
Sense of potential control;
Loss of self-consciousness;
Time distortion;
Autotelic or self-rewarding experience.
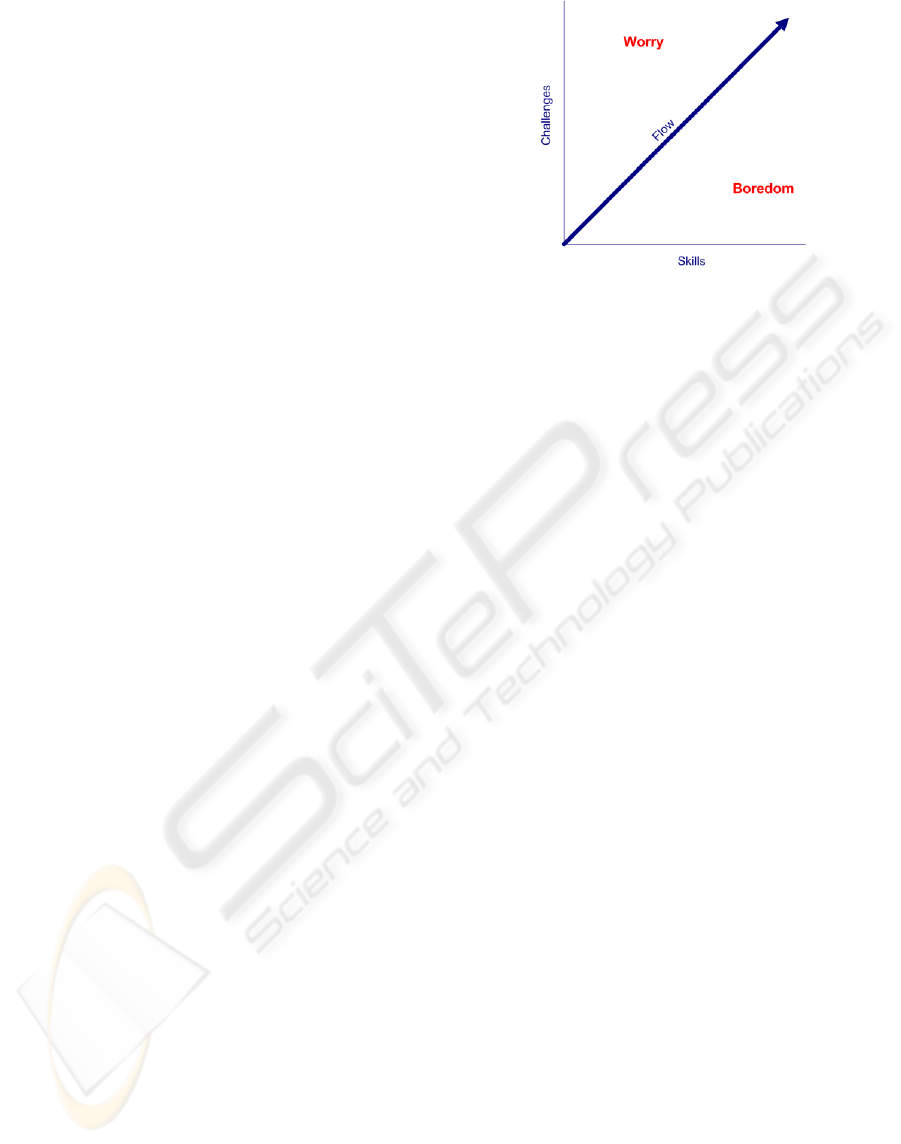
For a person to be in the presence of the flow
experience it is necessary a balance between the
level of challenge and personal skill
(Csikszentmihalyi, 1982) (Figure 1).
Figure 1: Flow Experience (Csikszentmihalyi, 1982).
The sensation of an excellent experience in the
accomplishment of any day by day task is our reason
of living. If we do not feel this excellent experience
with our everyday tasks, we will question our self, if
it is worth living (Csikszentmihalyi, 1982).
Previous researches have used the flow experience
to measure playfulness, involvement, satisfaction
and other states with the involvement in
computational environments (Chen et al., 2000,
Ghani and Deshpande, 1994, Novak and Hoffman,
1997, Novak et al., 2000, Trevino and Webster,
1992)
Trevino and Webster (1992) defines four
dimensions for the flow experience:
Control;
Attention Focus;
Curiosity;
Intrinsic Interest.
There is one more dimension, sense of time, that is
also important to measure the flow state (McKenna
and Lee, 2005) .
People who interact with computers, with an
entertainment spirit, transmit a much more positive
experience, of those, who are in the computer for
obligation (Webster et al., 1993).
4 THE STUDY
To evaluate the flow experience and to verify its
occurrence in collaborative tools, an experience was
carried through involving one hundred and twelve
students from a university school. The main tool
used was Google Groups, for this experience. This
paper presents the carried through experience, the
data obtained, as well as the statistical procedures
applied.
After the accomplishment of the project given by
the teacher, in which they used Google Groups, the
students answered the questions of a survey.
ICE-B 2010 - International Conference on e-Business
200

The survey was passed through the Internet with
the help of "LimeSurvey”. The data collection was
performed in the first week of November of 2009.
The Instruments used were Google Groups,
Google Docs and Facebook and a survey consisting
on some questions, in order to verify, in the end of
the study, if the students were in the presence of the
flow state. This survey will use the four dimensions:
control, attention focus, curiosity and the intrinsic
interest (Webster et al., 1993), as well as the
dimension sense of time (McKenna and Lee, 2005).
Beside these questions, this survey also contains
other generic questions. All the related questions
from this survey were built on a Likert scale of five
points, since one (I totally disagree) up to five (I
totally agree). Two questions for each dimension
were elaborated.
4.1 Analysis
This study was composed of 78.57% males and
84,82% had ages between sixteen and twenty four
years. Most of the students have already used
discussion forums in a fairly way.
The majority of the respondents used the laptop
(72.32%) to access the tools of the project, followed
by the desktop (27,68%).
We verified that Cronbach’s alpha is always
superior to 0.7, being able to conclude that the data
is related to one same dimension, that is, the
questions of the survey for the use of Google
Groups, allowed us to determine if the individual
finds himself in the presence of the flow experience,
for students using a laptop or a desktop.
To determine how the variables are correlated with
each of the different devices used (laptop and
desktop), a correlation matrix was created for both
types of the devices, where the correlation
coefficient, R, is presented, that is a measure of the
linear association between two variables. We can
conclude from the correlation analysis that the
correlation between the variables, for laptops, has a
greater number of variables positively correlated
than the desktop.
After the studies mentioned previously, we used
the factor analysis in order to reduce the number of
variables, both for laptops and desktops.
The extraction of the factors is given by considering
the percentage of variance explained by the factors
(Table 1 and Table2).
Table 1: Number of factors to be retained (laptop).
laptop
Component
Initial Eigenvalues
Total
% of
Variance
Cumulative
%
1 2,371 47,422 47,422
2 ,881 17,625 65,047
3 ,707 14,136 79,184
4 ,631 12,613 91,797
5 ,410 8,203 100,000
Table 2: Number of factors to be retained (desktop).
desktop
Component
Initial Eigenvalues
Total
% of
Variance
Cumulative
%
1 2,374 47,475 47,475
2 1,053 21,053 68,528
3 ,704 14,077 82,604
4 ,565 11,301 93,905
5 ,305 6,095 100,000
To set the number of components to be retained,
we choose, by default, those that have eigenvalues
greater than one. If the total variance explained by
the factors retained is less than 60%, then, at least,
one more factor should always be selected. Thus, for
this case study, two factors were retained in each
type of device. For the laptop, it appears that the first
factor explains 47.422% of the total variation and
the second 17.625%, both explaining 65.047% of the
total variation that exists in the five original
variables. For the desktop, the first factor explains
47.475% and the second 21.053%, explaining both,
68.528% of the total variation.
The matrix of components after rotation
(Varimax method) aims to exaggerate the value of
the coefficients that relates each variable to the
factors retained, so that each variable can be
associated with only one factor. The higher the value
of the coefficient that relates one variable to a
component, the greater is the relationship between
them. From this study we have concluded the
following for the case of the laptops: Factor group 1:
(Intrinsic Interest, Control and Curiosity); Factor
group 2: (Attention Focus and Sense of time)
And for the case of the desktops:
Factor group 1: (Attention Focus, Sense of time,
Intrinsic Interest and Curiosity) Factor group 2:
(Control).
A STUDY ON THE USAGE OF MOBILE DEVICES IN COLLABORATIVE ENVIRONMENTS VS DESKTOPS - An
Approach based on Flow Experience
201

5 CONCLUSIONS
In order to evaluate the use of mobile devices and
desktops and the potential of mobile devices in
collaborative environments versus desktops, it was
performed an experiment involving students of
higher education. This study has the main objective
to validate if the students that use laptops (mobile
device) or desktops are in the flow experience and
which of them are more in the flow experience.
The analysis of data allows us to conclude that the
majority of the students were males, had ages
between sixteen and twenty four years and that most
of the students have already used discussion forums.
When going further to the analysis of the data, we
verified that the variables described all the same
characteristic (threw the determination of the
Cronbhach’s alpha), that is, the variables describe
the flow experience.
We can conclude from the correlation analysis that
the correlation between the variables, for laptops,
has a greater number of variables positively
correlated than the desktop.
From the factor analysis it was possible to isolate
two factors that explain the majority of the total
variation. Such factors had been Factor group 1:
(Intrinsic Interest, Control and Curiosity), Factor
group 2: (Attention Focus and Sense of time) for the
laptops and Factor group 1: (Attention Focus, Sense
of time, Intrinsic Interest and Curiosity) Factor
group 2: (Control) for the desktops.
In order to determine the presence of the flow
experience for each type of device, it was verified
that, on average, the students were above value three
(Likert scale of five points), that is, the majority of
the students, in each of the different devices (laptop
and desktop) used, are in the presence of the flow
experience, for the five variables mentioned for this
study (attention focus, curiosity, control, intrinsic
interest and sense of time). We can also see, that the
average of the five variables associated with the
flow experience, for students who used the laptops,
were greater than those using the desktop to access
the tools of the project development.
From this study we can conclude that the flow
experience exists for people that use Google Groups,
both for people that used the laptop or even the
desktop, but having a more positively effect for
users of the laptop. Considering that people use
mobile device for m-learning and desktops for e-
learning, we can conclude that people that use m-
learning have a more positive effect on learning than
the people that use e-learning.
REFERENCES
Chen, H., Wigand, R. T. & Nilan, M. (2000) Exploring
Web users' optimal flow experiences. Information
Technology & People, 12.
Corbeil, J. R. & Valdes-Corbeil, M. E. (2007) Are You
Ready for Mobile Learning? Educause Quarterly, 30,
51-58.
Csikszentmihalyi, M. (1975) Beyond Boredom and
anxiety, San Francisco, CA.
Csikszentmihalyi, M. (1982) Towards a Psychology of
Optimal Experience. Annual Review of Personality
and Social Psychology.
Csikszentmihalyi, M. (1990) The psychology of optimal
experience, Harper Collins.
Ghani, J. & Deshpande, S. (1994) Task Characteristics and
the Experience of Optimal Flow in Human-Computer
Interaction. The Journal of Psychology, 128, 381-391.
Mckenna, K. & Lee, S. (2005) A Love Affair with MUDs:
Flow and Social Interaction in Multi-UserDungeons.
Novak, T. P. & Hoffman, D. L. (1997) Measuring the
Flow Experience Among Web Users. Vanderbilt
University.
Novak, T. P., Hoffman, D. L. & Yung, Y. (2000)
Measuring the Customer Experience in Online
Environments: A Structural Modeling Approach.
Marketing Science, 19, 22-42.
Pereira, P. A. (2002) Complementos de Estatística.
Pestana, M. & Gagueiro, J. (2005) Análise de dados para
Ciências Sociais - A complementaridade do SPSS.
Trevino, L. K. & Webster, J. (1992) Flow in computer-
mediated communication. Communication Research,
19, 539-573.
Webster, J., Trevino, L. K. & Ryan, L. (1993) The
dimensionality and correlates of flow in human-
computer interaction. computer game research, 9,
411-426.
ICE-B 2010 - International Conference on e-Business
202
