
Cavity Shape from Parallel Linear Shading: A Low-cost
Technique to Collect Data for an Image Mining
Oriented Geoprocessing System
Edvar Ferreira da Rocha Júnior
1
, Vanessa Gonçalves da Silva
1
Renato da Veiga Guadagnin
2
, Levy Aniceto Santana
1
Rinaldo de Souza Neves
3
and Jose Antonio Iturri de La Mata
4
1
Universidade Católica de Brasília, Campus I, QS 07, Lote 01
EPCT, 71.966-700 Águas Claras, Taguatinga, DF, Brazil
2
Universidade Católica de Brasília, Campus II, SGAN 916 Norte
70.790-160 Brasília, DF, Brazil
3
Hospital de Apoio de Brasília (HAB), SGAN
Lote 14, Asa Norte, 70.620-000 Brasília, DF, Brazil
4
Faculdade de Ceilândia / Universidade de Brasília (FCE/UnB)
Campus de Ceilândia, QNN 14 Área Especial - Ceilândia Sul, 72220-140 Brasília, DF, Brazil
Abstract. An Image Mining oriented Geoprocessing depends essentially on
spatially defined information from images. So it is possible to support decision-
making quite suitably in several areas, such as environment management, urban
management and health care. When large-scale use of image capturing and
interpretation devices becomes possible, it seems attractive to have low cost
additional infrastructures. This paper discusses the extraction of geometric
features of cavities, primarily motivated by the need for monitoring patients
with wounds called pressure ulcers (PU). An image with linear shadows on the
cavity of a model is generated in order to enable the measurement of its
deformation caused by depth. This yields maximum depth and volume in an
experimental model that are compared with measurements made previously in a
conventional manner. Differences with conventional measurements are
partially satisfactory and suggest further improvements in image capturing
device and computational procedures.
1 Introduction
An Image Mining oriented Geoprocessing depends essentially on spatially defined
information from images. The use of information from images to support decision-
making is quite suitable in several areas, including environment management, urban
management and health care. Cost reducing in computing devices with higher
Ferreira da Rocha Júnior E., Gonçalves da Silva V., da Veiga Guadagnin R., Aniceto Santana L., de Souza Neves R. and Antonio Iturri de La Mata J.
(2010).
Cavity Shape from Parallel Linear Shading: A Low-cost Technique to Collect Data for an Image Mining Oriented Geoprocessing System.
In Proceedings of the Third Inter national Workshop on Image Mining Theory and Applications, pages 115-121
DOI: 10.5220/0002964001150121
Copyright
c
SciTePress

performance are more and more motivating the implementation of computational
procedures for information mining from images [1].
When large-scale use of image capturing and interpretation devices becomes
possible, it seems attractive to have low cost infrastructures. Simple use, portability
and robustness requirements are also relevant, since the devices are supposed to be
manipulated by users with varying abilities, in different locations, with similar
ilumination conditions.
This paper discusses estimation of geometric features of cavities, primarily
motivated by the need for monitoring of patients with wounds called pressure ulcers
(PU). An image with linear shadows on the cavity of a model is generated in order to
enable the measurement of its deformation that is caused by depth. This yields
maximum depth and volume in an experimental model that are compared with
measurements made previously in a conventional manner.
2 Problem Statement
A pressure ulcer (PU) is defined as any change in skin integrity, which occurs mainly
by shear force, friction or pressure that affect skin for an extended time. An external
pressure of 50 to 200 mmHg leads to decreased capillary circulation and creates local
ischemia, leading to tissue damage and tissue necrosis and so tissue death [2], [3], [4].
A PU has predisposing factors such as high age, comorbidities, and nutritional
changes in the level of consciousness [3]. They cause increased morbidity and
mortality in bedridden patients that have chronic diseases and elderly. They can make
healing process more complex, increase the risk of infection and reduce its patient
functional independence [2], [4].
To evaluate the geometrical properties of a PU one can use invasive techniques
such as use of probes, rulers, filling with some saline or arginate solution, and non-
invasive techniques that are more precise, such as laser scans through the technique
from Vision Engineering Research Group (VERG) and Structured Light Method
(SLIM) [5]. They are however quite expensive [6]. Image processing is very helpful
for PU area estimation [7], [8], [9]. Initiatives on volume estimation are so far mainly
based on punctual but not linear stripe images [10].
This paper presents a low-cost technique to calculate the volume of a PU with
ambient light, through generation of linear shadows, image capture and
computational analysis. Such low cost technique is an effective support for assistance
of PU patients.
3 Material and Methods
The technique consists of illuminating the cavity, image capture and computer
analysis of the image. A model of the back of an adult was built, using PVC heated
by a steam engine. A PU simulation in the sacral region was done by means of a
sphere with 8cm diameter. (See Fig. 1).
116
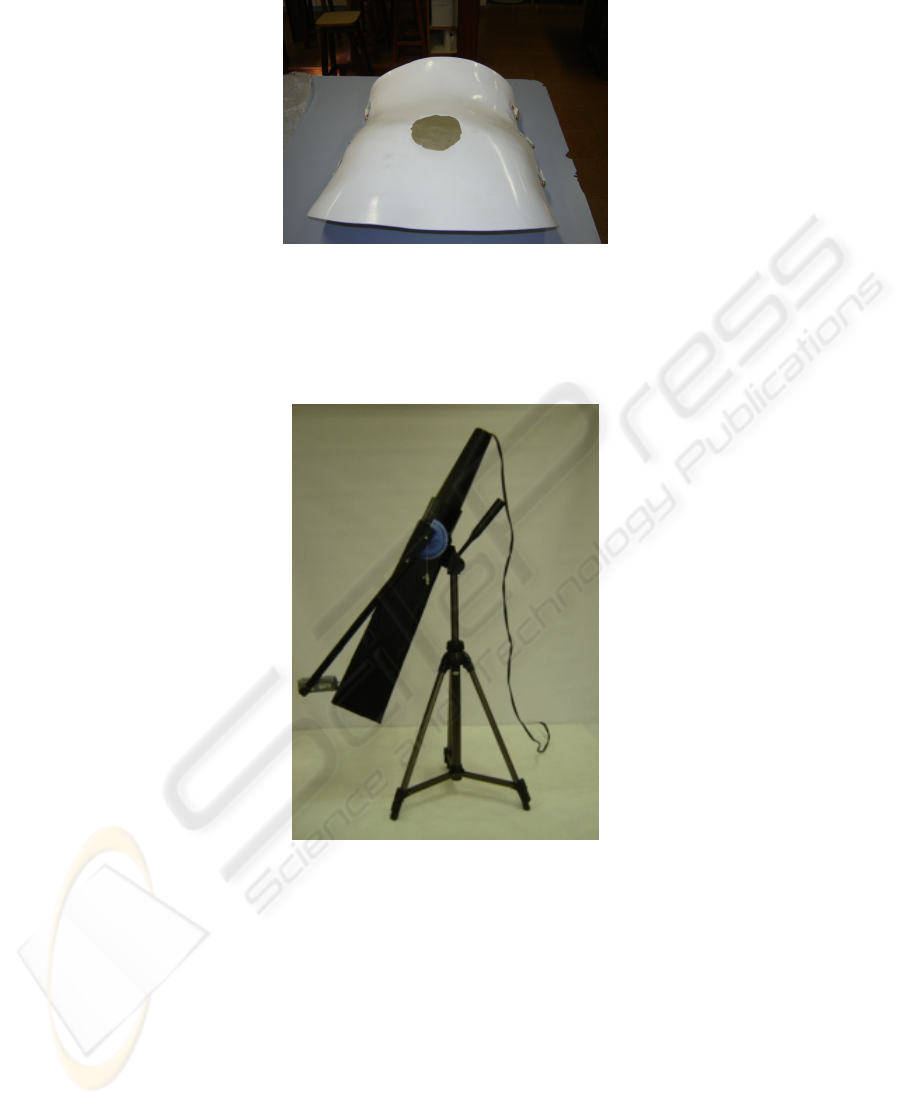
Fig. 1. Adult back model with filled cavity.
A 50cm long pipe, with a light bulb at one end and a 12cm x 20,5cm board with
parallel grooves in the other end was constructed. (See Fig. 2 and 3) This device was
set at an angle of 20 degrees with the vertical axis to the surface of the cavity. The
cost of the device was ca. 130 reais ($72).
Fig. 2. Illumination device.
Back model was previously opaque gray painted to eliminate brightness. Image
capture was made by digital camera in a vertical axis. The picture was taken during
the day in an environment with subdued lighting. (Fig. 4). Linear stripes were so
projected in the cavity model. The cost of such camera is about 500 reais. ($ 280).
A Java program was developed for image graying, thresholding, salt and pepper
and sweeping filtering, and edge enhancement using gradient technique. So cubic
polynomial Hermite curves were defined, based on pairs of points and their slopes in
areas outside the cavity [11], [12], [13], [14], [15]. The spaces contained by these
curves and the curves generated by the illumination lines are shown in Fig. 5.
117
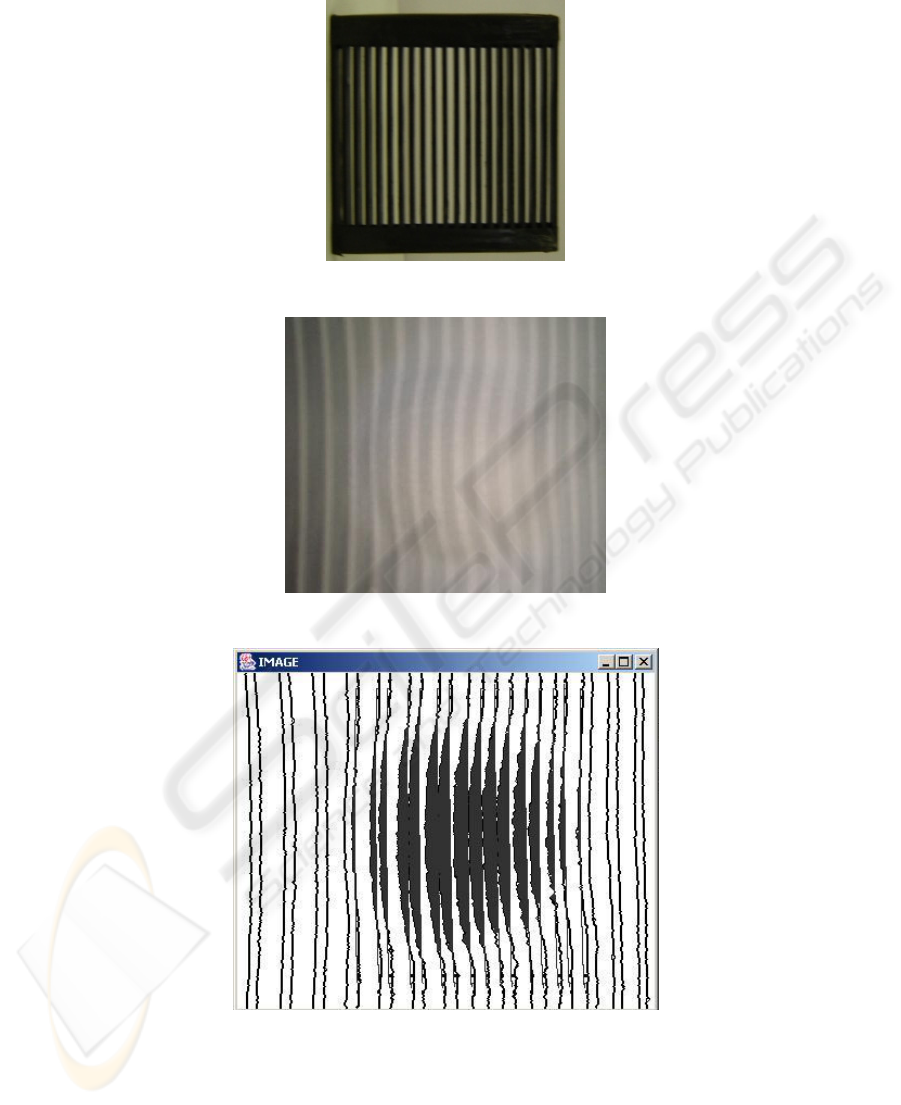
Fig. 3. Board with slots.
Fig. 4. Cavity image.
Fig. 5. Space difined by Hermite curves.
The greater distance between the curves in all of these areas was found.
118
The horizontal amount of pixels per cm is the ratio between the number of pixels
corresponding to the distance covering all lines and the corresponding measure in cm
multiplied by co-sinus of the illumination angle. This correction eliminates the
deformation caused by illumination angle. The corresponding vertical amount of
pixels is the same ratio but without co-sinus correction. The product of these values is
the ratio of pixels per cm
2
. The total area is the sum of the pixels of all spaces,
divided by this ratio.
The maximum depth is obtained by division between the greater distance between
the curves and the horizontal amount of pixels per cm.
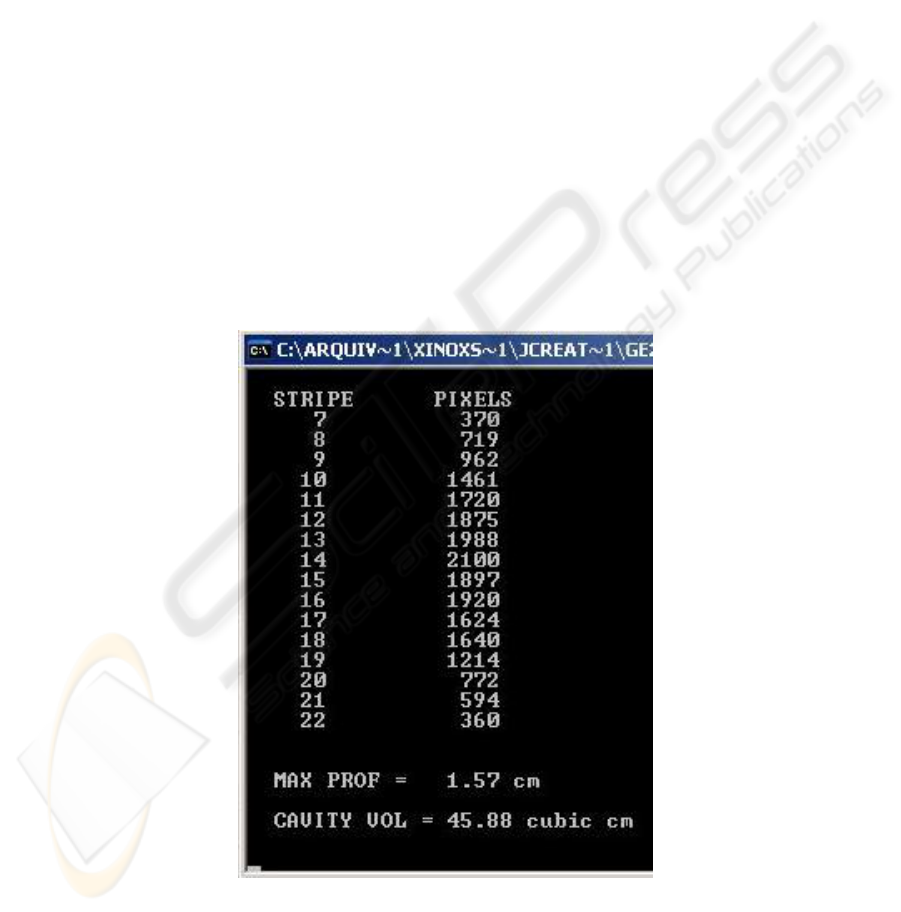
The volume can be derived as follows, where the stripe width is 0,5 cm [10].
V (cm
3
) = total area (cm
2
) x stripe width (cm) / tan 20
0
4 Results
The measure of actual volume of simulated PU cavity was 43 cm
3
. The maximum
depth of 1.4cm was measured by a ruler from the bottom to a curved paper surface
over the cavity. A 45.88 cm
3
volume and a 1.57cm depth were derived, as shown in
Table 1.
Table 1. Depth and volume.
119

5 Discussion
The volume calculated by the program exceeds 6.7% actual measurement. The depth
calculated by the program exceeds 12.1% actual measurement. The model cavity has
a continuous surface. While the first difference can be considered satisfactory for m,
the second one is too high and suggests some investigation to find possible causes.
In order to perform a new validation of the technique and eventually to achieve
smaller differences the technique should be tested in a cavity model that allows a
more confident volume measuring in comparison with glass mass filling.
Improvement of software portability requires tests using other images and program
adjustments as well.
6 Conclusions
The technique can be made suitable for evaluation of PU features in actual lighting
environments. This encourages their use in clinical practice as an aid to health
professionals. The $352 total cost for camera and illuminating device can motivate
their large scale use.
The technique is able to provide depth in all well-defined positions belonging to
the stripe shadows. So it satisfies Geoprocessing System requirements no matter the
image domain. Supposed a huge amount of PU images is available it is possible to
identify PU clusters and mine some relation between size evolution and other patient
features. A similar study concerning urban expansion is presented in [16].
Using of images as similar as possible to a real PU is recommended as well as
designing of additional image processing filters that generate images whose
characteristics could be computationally measured.
References
1. Guadagnin, R. V., Santana, L., Ferneda, E., Prado, H. A.: Improving Image Mining through
Geoprocessing. Pattern Recognition and Image Analysis, v. 20, p. 81-85, (2010).
2. Grey J.E., Harding K.G., Enoch S.: ABC of wound healing: Pressure ulcers BMJ. (2006)
February 25; 332(7539): 472–475
3. Lopes, A.G. et alli: Aferição não-invasiva de úlcera por pressão simulada em modelo
plano. Rev. bras. enferm. [online]. (2009); 62: 2: 200-203
4. Reis C.L.D. et al.: Comparative study about pressure ulcer area evaluation through
softwares Motic and AutoCAD. In: 9th International Conference on Pattern Recognition
and image analysis: New information technologies PRIA-9-2008, Nizhni Novgorod –
Rússia. Anais do 9th International Conference on Pattern Recognition and image analysis:
New information technologies PRIA-9-2008. Nizhni Novgorod - Rússia.: Editorial Board,
(2008); 2: 121-124
5. Marjanovic, D., Dugdale, R.E., Vowden, P., Vowden, K.R.: Measurement of the volume of
a leg ulcer using a laser scanner, in: Physiol. Meas. 19 (1998) 535-543
6. Neves, R.S., Silva S.F., Rocha Jr, E.F., Santana L.A., Guadagnin R, Ferneda E.: A proposal
for automatic inference of pressure ulcers grade based on wound imagens and patient data.
120

In: First International Workshop on Image Mining, Theory and Applications, 2008,
Funchal. Madeira, Portugal. Proceedings of the First International Workshop on Image
Mining Theory and Applications. Funchal. Madeira, Portugal : Setúbal : INSTICC Press,
(2008):1; 74-82
7. Souza, M.G.P.. Quintiliano, P, Trindade, L, Santana, LA, Sá, E, Guadagnin, R.V.:
Recognition of Texture and Area of Decubitus Ulcers through Computer Vision, in Pattern
Recognition and Image Analysis, Moscow: v. 15, No. 3, (2005): 586-588
8. Pereira I.L., Souza L.C., Santana L.A., Guadagnin, R.V.: Restoration of pressure ulcers
area detected by computational classification through image inclination correction. In:
Proceedings of the 8th International Conference on Pattern Recognition and Image
Analysis. Yoshkar-Ola : Mari State Technical University, (2007). v. 1. p. 166-169
9. Veredas F.J. , Mesa, H Morente L.: Tissue Recognition Approach to Pressure Ulcer Area
Estimation with Neural Networks, Book Chapter in Bio-Inspired Systems: Computational
and Ambient Intelligence (Lecture Notes in Computer Science): Springer, (2009); v.
5117/2009: 1045-1052
10. Marques K.C., Santos L.P.L., Santana L.A., Guadagnin R.: Procedimento computacional
de detecção de Volume de Úlceras de Pressão. In: V Simpósio Brasileiro de Qualidade de
Software - VI Workshop de Informática Médica, 2006, Vila Velha. Anais do V Simpósio
Brasileiro de Qualidade de Software. (2006): 232-236
11. Foley, J. D., et alli: Computer Graphics. Principles and Practice. 2nd ed. USA, Addison-
Wesley, (1996)
12. Castleman, K. R.: Digital Image Processing. USA, Prentice-Hall, (1996)
13. Rodrigues, L.H.: Building Imaging Applications with Java Technology. USA, Addison –
Wesley, (2001)
14. Ammeraal. L.: Computer Graphics for Java Programmers. England, Wiley (1998)
15. Watt, A., Policarpo. F.: The Computer Image. UK, Addison-Wesley, (1998)
16. Ohata, A. T. M., Quintanilha, J. A.: O uso de algoritmos de clustering na mensuração da
expansão urbana e detecção de alterações na Região Metropolitana de São Paulo. In: XII
SIMPÓSIO BRASILEIRO DE SENSORIAMENTO REMOTO, Goiânia, Brasil, 16-21 de
Abril de (2005), INPE, p. 647-655
121
