
RISK ANALYSIS FOR INTER-ORGANIZATIONAL CONTROLS
Joris Hulstijn
IT Audit, Faculty of Economics and Business Administration, Vrije Universiteit, Amsterdam, The Netherlands
Jaap Gordijn
Faculty of Sciences, Vrije Universiteit, Amsterdam, The Netherlands
Keywords:
Governance and control, Risk, Value modeling.
Abstract:
Existing early requirements engineering methods for dealing with governance and control issues do not ex-
plicitly support comparison of alternative solutions and have no clear semantics for the notion of a control
problem. In this paper we present a risk analysis method for inter-organizational business models, which
is based on value modeling. A risk is the likelihood of a negative event multiplied by its impact. In value
modeling, the impact of a control problem is given by the missing value. The likelihood can be estimated
based on assumptions about trust and about the underlying coordination model. This allows us to model the
expected value of a transaction. The approach is illustrated by a comparison of the risks of different electronic
commerce scenarios for delivery and payment.
1 INTRODUCTION
New business models are often based on coopera-
tion among companies in a network organization,
made possible by information technology (Tapscott
et al., 2000). For the development of business mod-
els and the subsequent design and implementation of
inter-organizational information systems, practition-
ers need a good understanding of the governance and
control of the network. What is the risk that an-
other participant will default? How can we make
sure that participants, on whom the joint success de-
pends, will behave as agreed? When participants who
do not know each other need to collaborate, initially
lack of trust is likely (Gambetta, 1988). To overcome
the initial lack of trust, inter-organizational control
measures are needed (Williamson, 1979; Bons et al.,
1998). Such measures can take the shape of contrac-
tual arrangements or supervision by a trusted third
party. Governance and control measures affect sys-
tem requirements and need to be designed and agreed
on explicitly. That means that governance and control
issues should be addressed during early requirements
engineering (Yu, 1997; Mylopoulos et al., 1997).
A recently developed method for modeling inter-
organizational control problems and their solutions is
e3-control (Kartseva, 2008; Kartseva et al., 2005).
The e3-control method is based on e3-value, a tech-
nique for representing and reasoning about networked
business models with the perspective of economic
value (Gordijn and Akkermans, 2003). Networks
should respect the principle of economic reciprocity:
for all services or goods delivered to the network, the
network should provide services or goods of equal
value in return. The e3-value method is supported
by a graphical modeling tool with some reasoning
capabilities to determine well-formedness. An al-
ternative would be dependency graphs, as in i* (Yu,
1997). Value models can be translated into depen-
dency graphs (Gordijn et al., 2006).
However, current conceptual modeling tools have
several limitations:
1. There are usually many different ways to deal
with governance and control. Current conceptual
modeling tools offer no support for prioritizing or
selecting among those alternative scenarios.
2. The conceptual modeling tools should help to
identify governance and control problems (threats
or vulnerabilities), represented in e3-control by a
dashed arrow. Currently, the notion of a control
problem does not have a precise semantics.
We address these limitations by extending the value
modeling framework with risk analysis. Generally,
risk is modeled as the product of the likelihood and
the impact of an event on the proper functioning of
314
Hulstijn J. and Gordijn J. (2010).
RISK ANALYSIS FOR INTER-ORGANIZATIONAL CONTROLS.
In Proceedings of the 12th International Conference on Enterprise Information Systems - Information Systems Analysis and Specification, pages
314-320
DOI: 10.5220/0002964603140320
Copyright
c
SciTePress

Figure 1: Example of an e3-value model of a purchase with tax payment: (a) ideal situation (b) sub-ideal situation with a
control problem (dashed arrow).
do not need to come from the same actor, but
they must be connected by a single value inter-
face: only when the incoming value is guaranteed,
the outgoing value be transferred.
R2. A dependency path may not contain any cycles,
so formally it is a directed acyclic graph. Cycles
would be meaningless; it would imply that a seller
would (indirectly) buy its own products.
A tool allows analysts to draw value networks and
perform validity checks (www.e3value.com). The
tool can generate so net value flow sheets, listing the
incoming and outgoing value flows, as a first indica-
tion of the economic feasibility of a network. The
tool can sum the net value flows of all actors in a
market segment. It can also concatenate a time se-
ries of value models, adding all the net value flows
over a certain period, using discounted net present
value (Derzsi et al., 2007).
2.2 Modeling Control Problems
In e3-value it is assumed that value transfers are
‘ideal’: they take place according to the agreements
between network participants, and norms and regula-
tions. But reality may be sub-ideal: actors commit
fraud or make unintentional errors, e.g. participants
will not pay, or will not deliver the (right) goods. Of-
ten, but not always, this implies that participants do
not respect the principle of economic reciprocity R1),
or that dependency paths contain loops (R2). All in-
valid e3-value models indicate a sub-ideal situation,
but not all sub-ideal situations correspond to an in-
valid model: a control problem may be hidden on the
coordination level. The specific value transfer which
is compromised by a sub-ideal situation is graphically
represented by a dashed arrow. By analogy, such a
transfer is called a sub-ideal value transfer. For ex-
ample, Figure 1(b) shows a sub-ideal value transfer in
which the seller does not pay VAT tax.
In the current interpretation of e3-control, dashed
arrows are only a notational convention. They denote
a value transfer that leads to a value leak: a situation
in which there is insufficient incoming value for an ac-
tor to compensate the outgoing value. The implemen-
tation of one value transfer may require several op-
erational and communication activities (Weigand and
de Moor, 2003). Value models abstract away from the
coordination aspect of such activities, but the order
in which activities take place, and the choice of actor
performing the activities, forms a crucial part of many
control mechanisms (Romney and Steinbart, 2006).
So in addition to value models, we need process mod-
els and coordination models (Wieringa, 2008). In this
paper, we use UML interaction diagrams to represent
interaction sequences (Rumbaugh et al., 1999) .
Figure 1: Example of an e3-value model of a purchase with
tax payment: (a) ideal situation (b) sub-ideal situation.
an organization: risk = likelihood × impact. In our
case, the impact of a missing value transfer is al-
ready given by the value model. The likelihood is
much harder to identify. We propose to apply existing
risk frameworks (e.g. NIST 800-30; ISO/IEC 27005),
and organize identified threats and vulnerabilities into
a Bayesian network, based on the dependencies im-
plicit in the value model, as well as assumptions about
the domain, the participants and the presence or ab-
sence of specific control measures. The main contri-
bution of the paper is a re-interpretation of value mod-
els, where value transfers are understood as expected
value transfers. Risk estimates provide a semantics
for control problems, and can be used to select or pri-
oritize among control scenarios.
The paper is structured as follows. Section 2 de-
scribes e3-value and e3-control. Section 3 presents
illustrative scenarios for delivery and payment. Sec-
tion 4 describes the risk analysis method.
2 VALUE AND CONTROL
An e3-value model provides a conceptual model of
the value transfers in a business network, encoded
in the e3-value ontology (Gordijn and Akkermans,
2003). Initially we apply the e3-value ontology for
the description of organizations that behave in com-
pliance with procedures and regulations. This is
called an ideal situation. Sub-ideal situations result-
ing from threats or vulnerabilities can be expressed
using e3-control, a modification of the e3-value on-
tology (Kartseva et al., 2005).
The e3-value constructs have a graphical notation.
Figure 1(a) shows an example of a buyer who obtains
goods from a seller and offers a payment in return.
The seller is obliged to pay value-added tax (VAT).
This can be conceptualized by the following e3-value
constructs (in bold). Actors, such as the buyer, seller,
and the tax office are economically independent enti-
ties. Actors transfer value objects (payment, goods,
VAT) by means of value transfers, depicted by labeled
arrows. A value interface models the principle of
economic reciprocity: actors are only willing to trans-
fer a value in return for some other value object. A
value interface consists of value ports, to for offer-
ing and requesting value objects. Actors may have
a consumer need, which, following a dependency
path will result in the transfer of value objects. Trans-
fers are either dependent on other transfers, or lead
to a boundary element. Dependency paths can be
connected by a choice fork (triangle) or parallel ex-
ecution (bar). Monetary values can be assigned to
value transfers, in order to evaluate the relative prof-
itability of a business idea. A tool allows analysts
to draw value networks and perform validity checks
(www.e3value.com). We consider two requirements
for internal validity: (R1) A value interface should
have at least one ingoing and at least one outgoing
value port. This corresponds to the principle of eco-
nomic reciprocity. (R2) A dependency path may not
contain any cycles.
In e3-value value transfers are assumed to be
‘ideal’, but reality may be sub-ideal: actors commit
fraud or make unintentional errors, e.g. participants
will not pay, or will not deliver the (right) goods. Of-
ten, but not always, this implies violation of the prin-
ciple of economic reciprocity. All invalid e3-value
models indicate a sub-ideal situation, but not all sub-
ideal situations correspond to an invalid model: a con-
trol problem may be hidden on the coordination level.
The specific value transfer which is compromised by
a sub-ideal situation – a ‘value leak’ – is graphically
represented by a dashed arrow. For example, Fig-
ure 1(b) shows a sub-ideal value transfer in which the
seller does not pay VAT tax. Currently, dashed arrows
are only a notational convention.
The implementation of one value transfer may re-
quire several operational and communication activi-
ties (Weigand and de Moor, 2003). Value models ab-
stract over the coordination aspects, but the order in
which activities take place and the choice of actor per-
forming the activities, forms a crucial part of many
control mechanisms (Romney and Steinbart, 2006).
So in addition to value models, we need process and
coordination models (Wieringa, 2008). We use UML
interaction diagrams for this purpose.
3 E-COMMERCE EXAMPLE
The example is concerned with a simple transaction,
shown in Figure 2: a buyer and a seller are exchanging
RISK ANALYSIS FOR INTER-ORGANIZATIONAL CONTROLS
315
money in return for goods. Think of a transaction ini-
tiated by eBay or some other electronic marketplace.
Delivery will take some time, so at least one of the
parties will depend on the other. We assume that par-
ticipants do not know each other, and have no other
reasons to trust one another. Moreover, we assume
that initially no additional control measures, such as
eBay’s reputation mechanism, are in place. Similar
scenarios are discussed in the literature on transaction
costs and electronic marketplaces (Williamson, 1979;
Hu et al., 2004). See (Wieringa, 2008) for coordina-
tion models of a similar scenario.
The e3-control method prescribes that the design
of controls proceeds according to the following three
steps (Kartseva et al., 2005):
1. Identify an ideal configuration of value transfers
in a network.
2. By analyzing coordination models and incen-
tives, identify a possible sub-ideal situation (threat
and/or vulnerability), with opportunities for er-
rors, opportunistic behavior or fraud. These in-
dicate the presence of a control problem.
3. For each identified sub-ideal situation, construct a
solution, i.e., a set of control measures to mitigate
the control problem.
The result of step 3 is a repaired configuration of value
transfers. Newly introduced controls may for example
trigger new value transfers, which also need to be con-
trolled. Therefore steps 1 until 3 should be repeated
for as many sub-ideal situations (threats or vulnera-
bilities) as are deemed relevant for the sustainability
of a business model. After such an exercise, the ana-
lyst is left with a set of possible scenarios for dealing
with the control problem. In this paper we intend to
provide a risk estimate, which will allow one to make
a selection or to prioritize among those alternative so-
lutions. We will first give an extensive example.
3 EXAMPLE: TRANSACTION
RISKS IN E-COMMERCE
The example is concerned with a simple transaction,
shown in Figure 2: a buyer and a seller are exchang-
ing money in return for goods, in some e-commerce
setting. Think of a transaction initiated by eBay or
some other electronic marketplace. This means that
delivery will take some time, so at least one of the
parties will depend on the other, without being able to
control the other party. We assume that participants
do not know each other, and have no other reasons
to trust one another. Moreover, we assume that ini-
tially no additional control measures, such as eBay’s
reputation mechanism, are in place. Similar scenarios
are discussed in the literature on transaction costs and
electronic marketplaces (Williamson, 1979; Hu et al.,
2004). See (Wieringa, 2008) for more elaborate coor-
dination models of a similar scenario.
A mutual value transfer often consists of several
operational activities, which are treated in e3-value as
an inseparable transaction, similar to e.g. transactions
in a database. By varying the order in which opera-
tional activities take place we get different scenarios,
with different risks for the participants (Figure 3). The
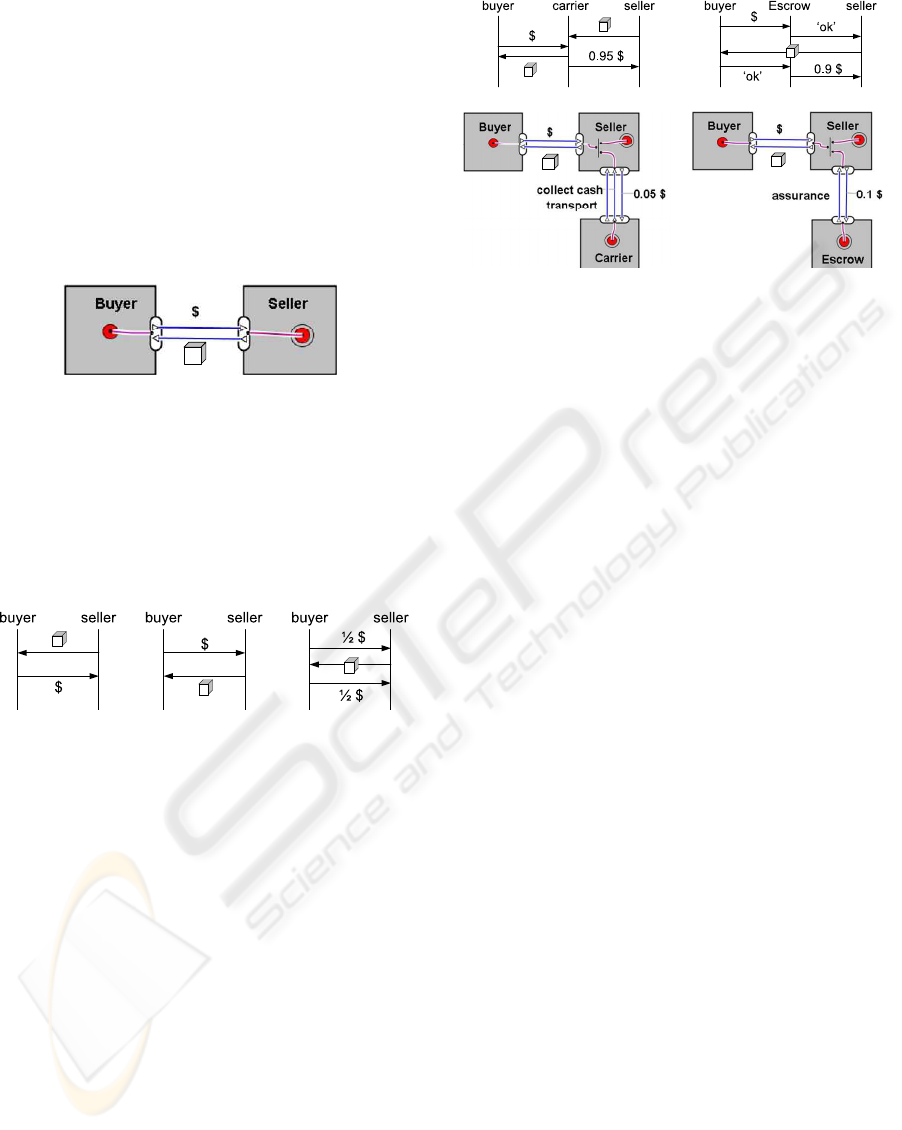
Figure 2: Value model of a generic e-commerce setting
Scenario 1: Scenario 2: Scenario 3:
pay before delivery deliver before paying down payment
Figure 3: Scenarios for delivery and payment.
example shows that coordination models are indeed
necessary to deal with control issues.
3.1 Scenario’s for delivery and payment
Which control scenario is selected, generally depends
on a multi-party negotiation process. We can expect
that a ‘dominant player’ in the market will be able
to impose his or her preferred scenario on the other
participants. In some cases, no player will be able to
impose their preferred option, so some form of com-
promise must be reached. First we consider scenarios
that do not involve external parties.
1. Pay before delivery. Suppose that the buyer must
pay before the seller will deliver the goods. This is
the preferred option for the seller. The buyer however
runs the risk that the goods will not be delivered, and
that the money cannot be recovered. This situation
is common in a market where sellers are dominant
enough to dictate the conditions of trade.
2. Deliver before paying. Suppose that the seller
must deliver the goods, before the buyer will be will-
ing to pay. This option is preferred by the buyer. The
seller now runs the risk that the goods will not be paid
for. This situation is common when the buyer can dic-
tate the conditions of trade.
3. Down payment. If neither the buyer nor the seller
is willing to ‘go first’, a compromise may be reached
in the form of a down payment: the buyer will pay for
example 50% of the agreed price beforehand. This
reduces the risk of the seller of not being paid at all.
The additional 50% will be paid after delivery, reduc-
ing the risk of the buyer that the goods will not be
delivered. Depending on the value, the delay between
ordering and delivery, and the relative dominance of
the players, other percentages may be used.
Next we consider two scenarios where external
parties help to solve participants’ control problems.
Figure 2: Value model of a generic e-commerce setting
A transaction often consists of several operational
activities. By varying the order in which operational
activities take place we get different scenarios, with
different risks for the participants (Figure 3). Which
control scenario is selected, generally depends on a
multi-party negotiation process.
The e3-control method prescribes that the design
of controls proceeds according to the following three
steps (Kartseva et al., 2005):
1. Identify an ideal configuration of value transfers
in a network.
2. By analyzing coordination models and incen-
tives, identify a possible sub-ideal situation (threat
and/or vulnerability), with opportunities for er-
rors, opportunistic behavior or fraud. These in-
dicate the presence of a control problem.
3. For each identified sub-ideal situation, construct a
solution, i.e., a set of control measures to mitigate
the control problem.
The result of step 3 is a repaired configuration of value
transfers. Newly introduced controls may for example
trigger new value transfers, which also need to be con-
trolled. Therefore steps 1 until 3 should be repeated
for as many sub-ideal situations (threats or vulnera-
bilities) as are deemed relevant for the sustainability
of a business model. After such an exercise, the ana-
lyst is left with a set of possible scenarios for dealing
with the control problem. In this paper we intend to
provide a risk estimate, which will allow one to make
a selection or to prioritize among those alternative so-
lutions. We will first give an extensive example.
3 EXAMPLE: TRANSACTION
RISKS IN E-COMMERCE
The example is concerned with a simple transaction,
shown in Figure 2: a buyer and a seller are exchang-
ing money in return for goods, in some e-commerce
setting. Think of a transaction initiated by eBay or
some other electronic marketplace. This means that
delivery will take some time, so at least one of the
parties will depend on the other, without being able to
control the other party. We assume that participants
do not know each other, and have no other reasons
to trust one another. Moreover, we assume that ini-
tially no additional control measures, such as eBay’s
reputation mechanism, are in place. Similar scenarios
are discussed in the literature on transaction costs and
electronic marketplaces (Williamson, 1979; Hu et al.,
2004). See (Wieringa, 2008) for more elaborate coor-
dination models of a similar scenario.
A mutual value transfer often consists of several
operational activities, which are treated in e3-value as
an inseparable transaction, similar to e.g. transactions
in a database. By varying the order in which opera-
tional activities take place we get different scenarios,
with different risks for the participants (Figure 3). The
Figure 2: Value model of a generic e-commerce setting
Scenario 1: Scenario 2: Scenario 3:
pay before delivery deliver before paying down payment
Figure 3: Scenarios for delivery and payment.
example shows that coordination models are indeed
necessary to deal with control issues.
3.1 Scenario’s for delivery and payment
Which control scenario is selected, generally depends
on a multi-party negotiation process. We can expect
that a ‘dominant player’ in the market will be able
to impose his or her preferred scenario on the other
participants. In some cases, no player will be able to
impose their preferred option, so some form of com-
promise must be reached. First we consider scenarios
that do not involve external parties.
1. Pay before delivery. Suppose that the buyer must
pay before the seller will deliver the goods. This is
the preferred option for the seller. The buyer however
runs the risk that the goods will not be delivered, and
that the money cannot be recovered. This situation
is common in a market where sellers are dominant
enough to dictate the conditions of trade.
2. Deliver before paying. Suppose that the seller
must deliver the goods, before the buyer will be will-
ing to pay. This option is preferred by the buyer. The
seller now runs the risk that the goods will not be paid
for. This situation is common when the buyer can dic-
tate the conditions of trade.
3. Down payment. If neither the buyer nor the seller
is willing to ‘go first’, a compromise may be reached
in the form of a down payment: the buyer will pay for
example 50% of the agreed price beforehand. This
reduces the risk of the seller of not being paid at all.
The additional 50% will be paid after delivery, reduc-
ing the risk of the buyer that the goods will not be
delivered. Depending on the value, the delay between
ordering and delivery, and the relative dominance of
the players, other percentages may be used.
Next we consider two scenarios where external
parties help to solve participants’ control problems.
Figure 3: Scenarios for delivery and payment.
1. Pay before Delivery. The buyer must pay before
the seller will deliver the goods. This is the preferred
option for the seller. The buyer runs the risk that the
goods will not be delivered and that the money cannot
be recovered.
2. Deliver before Paying. The seller must deliver the
goods, before the buyer will pay. This option is pre-
ferred by the buyer. The seller runs the risk that the
goods will not be paid.
3. Down Payment. A compromise may be reached in
the form of a down payment: the buyer will pay for
example 50% of the agreed price beforehand. This
reduces the risk of the seller of not being paid at all.
The additional 50% will be paid after delivery, reduc-
ing the risk of the buyer that the goods will not be
delivered. Other percentages may be used.
4. Cash on Delivery. The goods are paid to the car-
Scenario 4: Scenario 5:
cash on delivery Escrow
Figure 4: Scenarios for delivery and payment with the help
of third parties.
4. Cash on Delivery. In this scenario the goods are
paid to the carrier who delivers the goods. The buyer
can inspect the goods before paying, reducing her
risks. The carrier acts as a payment guarantee, re-
duces the risks for the seller. This ‘cash collection’
can be seen as an additional service, in return for a
fee. In this version, the service is paid for by the
seller. Here we assume the seller will trust the car-
rier. In practice, the seller will often take additional
control measures to ensure the carrier will not pocket
the money. Think of a receipt signed by the buyer,
which must be shown by the carrier afterwards.
5. Escrow. In this scenario, participants may hire a
trusted third party to ensure both delivery and pay-
ment. This party acts as an Escrow: a controlled cus-
todian. The procedure runs as follows. First the buyer
pays the agreed sum to the Escrow. The Escrow no-
tifies the seller that payment has arrived. The seller
subsequently delivers the goods. Now the buyer no-
tifies the Escrow of delivery, and thereby releases the
payment, with a certain percentage deducted as a fee.
The service delivered by the Escrow may be termed
‘assurance’. The party mostly in need of assurance
will pay the fees. Here we assume the seller will pay.
3.2 Ranking and Negotiating Scenarios
Now we will try to make some comparisons between
scenarios. We start from the point of view of the
seller. Suppose p
b
represents the seller’s estimate of
the likelihood that the buyer will pay beforehand, with
0 < p
b
< 1. This represents the initial trust the seller
has in the buyer’s willingness to pay, without any ad-
ditional control measures. When buyers are from a
trustworthy community p
b
will be relatively high, for
example 0.6. But on the internet, p
b
could be as low
as 0.3. Suppose furthermore that the seller’s value for
the goods is v
s
, their price, with v
s
> 0, and that the
fraction paid beforehand as down payment is a, with
0 < a < 1. For example, the down payment could be
50%. Moreover, we assume the seller himself is hon-
est, and that the buyer really wants to have the goods.
Now we can put estimates on the scenarios as follows.
Seller’s expected value:
Scenario 1: v
s
,
because payment before delivery is certain.
Scenario 2: p
b
v
s
,
because the likelihood of payment is p
b
.
Scenario 3: av
s
+ p
b
(1 − a)v
s
,
because after the first instalment (av
s
), the
likelihood of the second instalment is p
b
.
It follows that regardless of the values of v
s
, p
b
and
a, we have the following ranking: Scenario 1 > Sce-
nario 3 > Scenario 2. So when entering negotiations,
the seller will prefer to get ‘payment before deliv-
ery’. When that proves impossible, he will try to get
the buyer to make a down payment, one that is large
enough to keep the buyer from getting the product
elsewhere and canceling the order. This negotiation
depends on the seller’s knowledge about the buyer’s
preferences, so about p
b
. When the buyer is unwilling
to make any down payment, the seller may consider
the services of a third party, like a carrier or Escrow.
How much he is willing to pay for such services de-
pends on the value of the transaction for the seller:
how badly does he need the business? For now as-
sume that both the scenarios ‘cash on delivery’ and
Escrow guarantee the desired outcome. In practice,
an Escrow is probably more certain. We also ignore
for now the problem whether to trust the third party.
Seller’s expected value:
Scenario 4: v
s
− f ,
where f represents the carrier’s fixed fee.
Scenario 5: v
s
− ev
s
,
where e represents the Escrow fee %.
The ranking of Scenario 4 and 5 relative to each other
and to Scenario 1, 2 and 3 depends on v
s
, p
b
,a, f and
e. Now suppose v
s
= 1.0, p
b
= 0.6, a = 0.5, f = 0.05
and e = 0.1. In that case: pay before delivery (1)
> cash on delivery (0.95) > Escrow (0.9) > down
payment (0.8) > deliver before paying (0.6), from the
seller’s point of view.
We can make a similar calculation for the buyer.
Let p
s
be the buyer’s estimate of the likelihood that
the seller will deliver, without any control measure.
Assume the seller has a reputation to loose, so p
s
is
relatively high: 0.9. Similarly v
b
is the value of the
goods for the buyer. The price is agreed beforehand,
Figure 4: Delivery and payment scenarios with third parties.
rier who delivers the goods. The buyer can inspect
the goods before paying, reducing her risks. The car-
rier acts as a payment guarantee, reducing the risks
for the seller. This ‘cash collection’ can be seen as an
additional service. In this version, the service is paid
for by the seller. Here we assume the seller will trust
the carrier. In practice, the seller will often take ad-
ditional measures to control the carrier. Think of an
obligatory receipt signed by the buyer.
5. Escrow. Participants hire a trusted third party (the
Escrow) to ensure delivery and payment. First the
buyer pays the agreed sum to the Escrow. The Escrow
notifies the seller that payment has arrived. The seller
subsequently delivers the goods. Now the buyer no-
tifies the Escrow of delivery, and thereby releases the
payment, with a certain percentage deducted as a fee.
The Escrow service may be termed ‘assurance’.
Now we will compare the scenarios. We start from
the point of view of the seller. Suppose p
b
represents
the seller’s estimate of the likelihood that the buyer
will pay beforehand, with 0 < p
b
< 1. This repre-
sents the initial trust of the seller in the buyer. When
buyers are from a trustworthy community p
b
will be
relatively high, for example 0.6. But on the internet,
p
b
could be as low as 0.3. Suppose furthermore that
the seller’s value for the goods is v
s
, with v
s
> 0, and
that the down payment fraction is a, with 0 < a < 1.
Seller’s expected value:
S1: v
s
, the agreed price
S2: p
b
v
s
, where p
b
is the initial trust
S3: av
s
+ p
b
(1 − a)v
s
, for 1st and 2nd payment.
S4: v
s
− f , where f is the carrier’s fixed fee.
S5: v
s
− ev
s
, where e is the Escrow fee %.
Regardless of v
s
, p
b
and a, we have the following
ranking: S1 > S3 > S2. So when entering negotia-
tions, the seller will prefer ‘payment before delivery’.
When that proves impossible, he will try to get the
buyer to make a down payment. When the buyer is
ICEIS 2010 - 12th International Conference on Enterprise Information Systems
316

unwilling to make any down payment, the seller may
consider the services of a third party, like a carrier
or Escrow. We assume that S4 and S5 guarantee the
desired outcome. In practice, an Escrow is probably
more certain, but also more expensive. The ranking
for S4 and S5 depends on the values for v
s
, p
b
,a, f
and e. Suppose v
s
= 1.0, p
b
= 0.6,a = 0.5, f = 0.05
and e = 0.1. In that case: S1 (1) > S4 (0.95) > S5
(0.9) > S3 (0.8) > S2 (0.6).
We can make a similar calculation for the buyer.
Let p
s
be the buyer’s initial trust in the seller. Assume
the seller has a reputation to loose, so p
s
is 0.9. The
price is agreed beforehand, so the buyer’s value v
b
=
v
s
. The other values remain the same.
Buyer’s expected value:
S1: p
s
v
b
S2: v
b
= 1,
S3: v
b
− (1 − p
s
)av
b
S4: v
b
= 1
S5: v
b
= 1.
We get the following (partial) ranking for the buyer:
{S2 (1), S4 (1), S5 (1)} > S3 (0.95) > S1 (0.9).
Clearly, the first choices do not match. The second
choices are closer. What decides the outcome of such
a negotiation? Until now we have only made assump-
tions about trust. But some scenarios will never be
the outcome of a negotiation, given the relative domi-
nance of players on the market. Suppose that there are
many sellers, who compete ferociously. Buyers have
a choice, so they can set the trade conditions. In such
a market, the cash for delivery scenario is more likely.
When there are few sellers, the seller can set the trade
conditions. In such cases a down payment scenario is
more likely. This kind of setting is traditionally an-
alyzed with game theoretic techniques. For example
(Hu et al., 2004) calculate the optimal fee for an Es-
crow service. Here we do not need full-blown game
theory. Crucial is that the assumptions are derived
from the scenario and market conditions.
4 VALUE MODELS AND RISK
In this section we describe how to re-interpret value
transfers under risk. The general idea is to label value
transfers with a probability. To reason with probabili-
ties one often has to make the assumption that they are
independent. However, value transfers are usually de-
pendent, because of the principle of reciprocity and
the dependency paths. Reciprocity means that one
transfer may only take place provided that the other
transfer has also taken or will also take place, and
vice versa. This is modeled as a mutual conditional
probability. For example, the mutual dependency of
payment on delivery in Figure 2 should ideally come
out as follows: P(pay|deliver) = P(deliver|pay) = 1
and P(pay|¬deliver) = P(deliver|¬pay) = 0.
In practice, also control measures are faulty.
How much investment in controls is acceptable?
By combining the two variables we get four pos-
sible outcomes, which can be ordered according
to their relative acceptability. In general, stake
holders tend to prefer a deal to no deal, and pre-
fer no deal to a violation of the principle of reci-
procity: (pay ∧ deliver) > (¬pay ∧ ¬deliver) >
{(pay ∧ ¬deliver),(¬pay ∧ deliver)}.
The probability that a complete transaction will
occur, is a summation of the probabilities for each
of the execution paths made possible by the coordi-
nation model. We must realize that – by definition
– these probabilities are not independent, we can-
not simply add or multiply the probabilities. Instead
we should use conditional probabilities, using Bayes’
rule: P(a|b) = P(b|a)P(a)/P(b).
Interestingly, in e3-value dependency paths are
defined as directed acyclic graphs, which model the
dependencies between events: one value transfer may
only occur provided another value transfer has oc-
curred. We suggest to use these dependency paths
to derive a Bayesian Network. Formally, a Bayesian
Network is also a directed acyclic graph, where nodes
correspond to events, and links represent causal de-
pendencies between events (Pearl, 1986). Uncon-
nected nodes are considered to be independent. This
reduces the space of possible combinations to con-
sider. Attached to each node is a conditional prob-
ability table, which gives the relative strength of the
dependency (Figure 5).
Where do we get the data for ‘filling’ the condi-
tional probability tables? Well, businesses can mon-
itor the business partners and make risk estimates
based on historical experience. However, when a
new business model is set up, no such data is usu-
ally available. This need not be a problem. The point
of the example in Section 3 was to show that con-
ditional probabilities can in fact be estimated, given
general assumptions about participants and market
conditions. Think of assumptions like: ‘buyer wants
goods’, ‘seller has a reputation to loose’. In addition,
we need the relative strength of the control measures
in the coordination model, but such estimates should
be available during the design phase.
Starting from an e3-value model we can systemat-
ically explore transaction risks, using the dependency
paths, assumptions about participants, and the under-
lying coordination models as a guideline. The method
can be summarized as follows.
1. Start with an ideal value model.
RISK ANALYSIS FOR INTER-ORGANIZATIONAL CONTROLS
317
2. Start with the consumer need. Follow the depen-
dency path to the boundary element. Generate the
skeleton of a Bayesian network, using the value
model and dependency path as a guideline.
3. For each value transaction, generate a choice-fork
with two (or more) options:
– agent a goes first, followed by agent b,
– agent b goes first, followed by agent a,
– either a or b splits the value transfer,
– either a or b makes use of a third party.
4. Evaluate the value and likelihood of each of these
‘forks’ given existing agreements about control
measures in the coordination model, and general
assumptions about the domain. Now set risk =
value × likelihood.
5. To get the risk of a scenario, sum the risk over all
choice-forks.
To illustrate the method, we consider the example of
down payment (S3). First, we assume participants
agree on the down payment interaction protocol. Sec-
ond, we split the value transfer, and follow the steps
in the coordination model (Figure 3), adding non-
payment and non-delivery explicitly as events. This
would produce a game-tree, with the pay-offs (im-
pact) and likelihoods for each agent based on the as-
sumption from Section 3.
Instead of a game-tree, we can also immediately
generate the underlying Bayesian network, as we have
done here (Figure 5). The Bayesian network shows
that the conditional probabilities are very simple: here
they are only based on initial trust, and on the out-
come of the previous step in the interaction protocol.
We believe this limited complexity is a general prop-
erty of the e-commerce domain. Otherwise, the ef-
fects of interaction protocols could not be explained
to practitioners. In the last step, the trust of the seller
in the buyer (p
b
) is 0.6 without control measures, see
the argumentation in Section 3. Similarly, the initial
trust of the buyer in the seller (p
s
) is 0.9, which de-
termines the second step. There is also a chance that,
even after agreeing on the protocol, the buyer does
not want to go along with the deal after all, say 0.2.
In that case, the seller runs only a little risk, because
no goods are being shipped.
Finally, to link these probability estimates to the
impact of the various events, we can put the Bayesian
Network as it were ‘on top of’ the e3-control model.
This produces a diagram as in Figure 6. In this model,
we see the usual dependency paths of e3-value and
e3-control, but now annotated with their relative like-
lihoods. Both the likelihood and impact of the various
‘negative events’ (buyer does not pay first instalment,
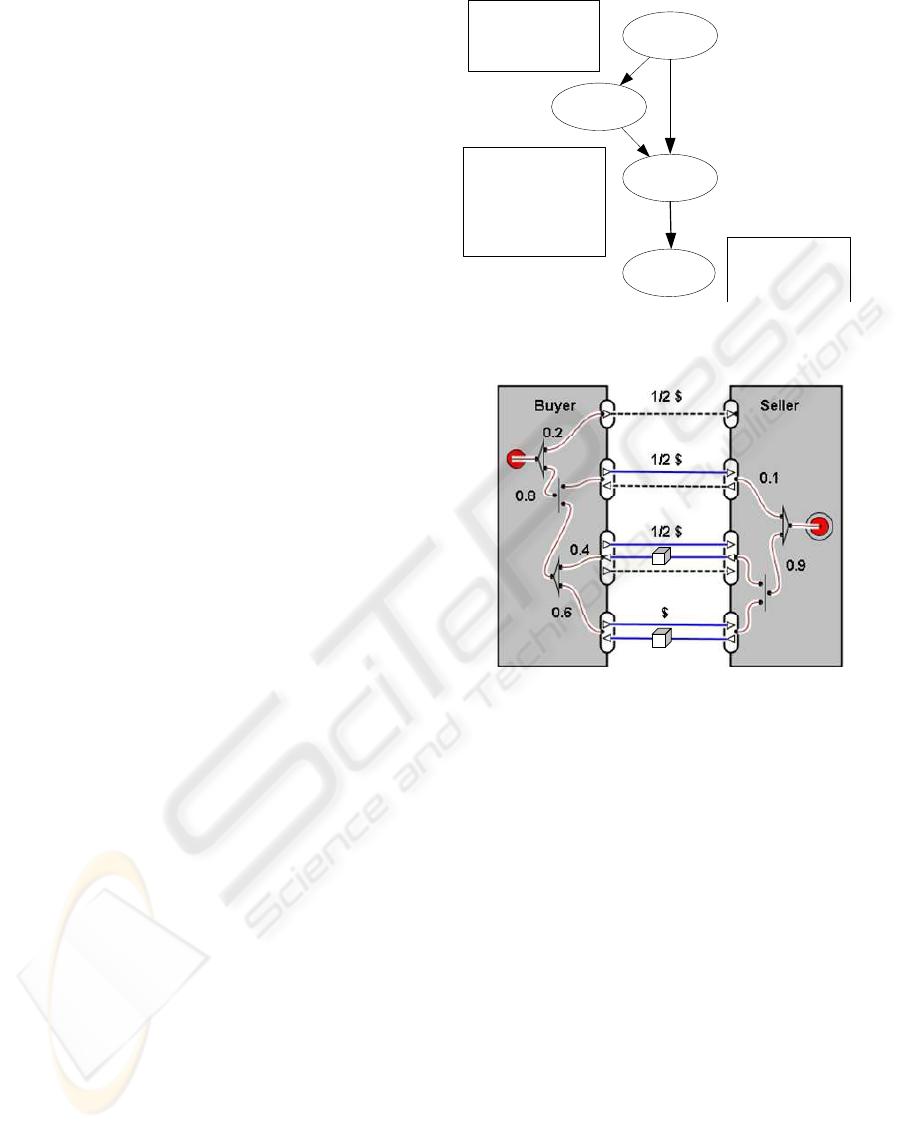
seller does not deliver, buyer does not pay the second
Buyer
pays 1st
Agree on
downpayment
Seller
delivers
Buyer
pays 2nd
B pays 1st
Agr down T F
T 0.8 0.2
F 0.0 1.0
B pays Agr S delivers
1st, down T F
T T 0.9 0.1
T F 0.0 1.0
F T 0.0 1.0
F F 0.0 1.0
B pays 2nd
S delivers T F
T 0.6 0.4
F 0.0 1.0
Figure 6: Bayesian Network for Scenario 3 down payment,
with conditional probability tables
difference is that in a game-tree the positive and neg-
ative outcomes of an event are modeled as separate
events; in Bayesian networks these events become a
single node. In an interactive domain, we find that a
game-tree representation is closer to the UML inter-
action diagram, so first deriving a game-tree makes
deriving the Bayesian network conceptually easier.
The Bayesian network shows that the conditional
probabilities are very simple: here they are only based
on initial trust, and on the outcome of the previ-
ous step in the interaction protocol. We believe this
limited complexity is a general property of the e-
commerce domain. Otherwise, the effects of interac-
tion protocols could not be explained to practitioners.
In the last step, the trust of the seller in the buyer (p
b
)
is 0.6 without control measures, see the argumenta-
tion in Section 3.2. Similarly, the initial trust of the
buyer in the seller (p
s
) is 0.9, which determines the
second step. There is also a chance that, even after
agreeing on the protocol, the buyer does not want to
go along with the deal after all, say 0.2. In that case,
the seller runs only a little risk, because no goods are
being shipped, so there is no lost value.
4.2 Bayesian e3-control Models
Finally, to link these probability estimates to the im-
pact of the various events, we can put the Bayesian
Network as it were ‘on top of’ the e3-control model.
This produces a diagram as in Figure 7. In this model,
we see the usual dependency paths of e3-value and
e3-control, but now annotated with their relative like-
lihoods. Both the likelihood and impact of the various
‘negative events’ (buyer does not pay first instalment,
seller does not deliver, buyer does not pay the second
instalment) can now be estimated. In other words, the
dashed lines, which until now only indicated a control
problem, have been given a proper semantics. The
Figure 7: e3-control model with likelihood estimates for
scenario 3 down payment
meaning of a ‘sub-ideal’ dashed line, like that of an
‘ideal’ value transfer, is the relative size of the risk
associated with it. This solves the second limitation
of current conceptual modeling techniques like e3-
control. Such risk estimates can be made for all pos-
sible control solutions, such as the various scenarios
discussed here. This makes it possible to compare and
prioritize the scenario’s. Given assumption about the
relative preferences of the participants, we can predict
what the most probably outcome of the negotiation
about control measures will be. This solves the first
limitation of current conceptual modeling techniques.
4.3 Research Limitations
The research reported here is – like most research in
value modeling – meant as a conceptual modeling tool
to assist human designers and analysts. The qual-
ity of the outcomes crucially depends on the quality
of the input data and assumptions. Based on a sin-
gle example, we showed that our approach is feasible.
However, we cannot say anything about scalability or
portability to other domains. Typically, tool support
becomes really necessary for complex applications, in
which a human analyst with pencil and paper would
loose track. Future research will have to point out
whether our approach would be helpful for such com-
plex applications.
5 RELATED RESEARCH
There has been a lot of interest in value modeling,
which has lead to various extensions of e3-value. One
particular line of research concerns the translation of
the relatively abstract value models to more opera-
tional process models and coordination models. Here
we mention (Derzsi et al., 2007), as well as the work
Figure 5: Bayesian Network for Scenario 3 down payment,
with conditional probability tables.
Figure 6: e3-control model with likelihood estimates for
scenario 3 down payment
instalment) can now be estimated. In other words, the
dashed lines, which until now only indicated a control
problem, have been given a proper semantics. The
meaning of a ‘sub-ideal’ dashed line, like that of an
‘ideal’ value transfer, is the relative size of the risk
associated with it. This solves the second limitation
of current conceptual modeling techniques like e3-
control. Such risk estimates can be made for all pos-
sible control solutions, such as the various scenarios
discussed here. This makes it possible to compare and
prioritize the scenario’s. Given assumption about the
relative preferences of the participants, we can predict
what the most probably outcome of the negotiation
about control measures will be. This solves the first
limitation of current conceptual modeling techniques.
5 CONCLUSIONS
Governance and control issues of a network organiza-
tion, determine the design of inter-organizational sys-
ICEIS 2010 - 12th International Conference on Enterprise Information Systems
318

tems in a business relation. There are various concep-
tual modeling tools for network organizations. Some
model the transfer of objects of value between ac-
tors (Gordijn and Akkermans, 2003), whereas others
model the dependencies between goals of actors (Yu,
1997). In this paper we extend one of these methods,
namely e3-control (Kartseva et al., 2005), with risks.
Risk estimates are needed to make informed decisions
about implementation of a control measure. A rep-
resentation of the relative effectiveness of alternative
control scenarios should facilitate the negotiation pro-
cess between network participants.
We propose to replace the meaning of a value
transfer by the expected value: the probability of the
value transfer succeeding, multiplied by the value it-
self. The risk then becomes the probability of the
value transfer not succeeding, multiplied by the miss-
ing value. Using an example of different interaction
protocols in an e-commerce setting, we have argued
that it is feasible to make estimates of such probabil-
ities, based on general assumptions about the partici-
pants and the domain.
Moreover, we present a systematic method for
generating a Bayesian Network, based on the value
model and the execution paths allowed by the under-
lying coordination model. The Bayesian network pro-
vides conditional probabilities for each of the value
transfers or dependency paths. The example shows
that reasonable conditional probabilities can in fact be
estimated, based on available design knowledge and
general assumptions.
Extending value models with probabilities solves
two limitations of current conceptual modeling tools
for dealing with governance and control. First, calcu-
lating the net expected value for each scenario, which
includes the probability of lost value, provides a nice
measure for prioritizing or selecting control scenar-
ios. Second, sub-ideal value transfers (dashed arrows)
which represent a control problem, are now provided
with a proper semantics. The risk exposure is exactly
the meaning of a sub-ideal value transfer.
There is some related research. Asnar et al use an
extension of TROPOS with risk assessment, to com-
pare alternative business solutions in a network orga-
nization (Asnar et al., 2008). Their work is similar
to us, because it uses dependencies to model the net-
work. However, they cannot express the impact of a
control problem in terms of the lost value.
Our research has limitations. We showed that our
approach is feasible using an example, but we cannot
say much about scalability or portability to other do-
mains. Tool support only becomes necessary for com-
plex applications. Future research will have to point
out whether our approach is helpful for large cases.
ACKNOWLEDGEMENTS
We would like to thank Vera Kartseva and Yao-Hua
Tan for their contributions.
REFERENCES
Asnar, Y., Moretti, R., Sebastianis, M., and Zannone, N.
(2008). Risk as dependability metrics for the evalua-
tion of business solutions: A model-driven approach.
In Agent-Oriented Software Engineering VII (ARES
2008), pages 1240–1247. Springer Verlag.
Bons, R. W. H., Lee, R. M., and Wagenaar, R. W. (1998).
Designing trustworthy interorganizational trade pro-
cedures for open electronic commerce. International
Journal of Electronic Commerce, 2(3):61–83.
Gambetta, D. (1988). Trust, chapter Can we trust trust?,
pages 213–237. Basil Blackwell, New York.
Gordijn, J. and Akkermans, J. (2003). Value-based require-
ments engineering: Exploring innovative e-commerce
ideas. Requirements Engineering, 8(2):114–134.
Gordijn, J., Yu, E., and van der Raadt, B. (2006). E-service
design using i* and e3-value modeling. IEEE Soft-
ware, 23(3):26–33.
Hu, X., Lin, Z., Whinston, A., and Zhang, H. (2004). Hope
or hype: On the viability of Escrow services as trusted
third parties in online auction environments. Informa-
tion Systems Research, 15(3):236–249.
Kartseva, V. (2008). Designing Controls for Network
Organization: A Value-Based Approach. PhD
thesis, Vrije Universiteit Amsterdam. Available at
http://docs.e3value.com/bibtex/pdf/Kartseva2008.pdf.
Kartseva, V., Gordijn, J., and Tan, Y.-H. (2005). Towards
a modelling tool for designing control mechanisms in
network organisations. International Journal of Elec-
tronic Commerce, 10(2):57–84.
Mylopoulos, J., Borgida, A., and Yu, E. (1997). Repre-
senting software engineering knowledge. Automated
Software Engineering, 4(3):291–317.
Pearl, J. (1986). Fusion, propagation, and structuring in be-
lief networks. Artificial Intelligence, 29(3):241–288.
Romney, M. and Steinbart, P. (2006). Accounting Informa-
tion Systems, 10e. Prentice Hall, NJ.
Tapscott, D., Lowy, A., and Ticoll, D. (2000). Harnessing
the Power of Business Webs. Harvard Business School
Press, Boston, MA.
Weigand, H. and de Moor, A. (2003). Workflow analysis
with communication norms. Data and Knowledge En-
gineering, 47(3):349–369.
Wieringa, R. (2008). Operational business-it alignment in
value webs. In Kaschek, R., Kop, C., Steinberger,
C., and Fliedl, G., editors, Information Systems and
e-Business Technologies (UNISCON 2008), LNBIP 5,
pages 371–378. Springer Verlag.
RISK ANALYSIS FOR INTER-ORGANIZATIONAL CONTROLS
319

Williamson, O. E. (1979). Transaction cost economics: The
governance of contractual relations. Journal of Law
and Economics, 22:3–61.
Yu, E. (1997). Towards modelling and reasoning support for
early-phase requirements engineering. In Proceedings
of the 3rd IEEE International Symposium on Require-
ments Engineering (RE’1997), pages 226–235. IEEE
CS Press.
ICEIS 2010 - 12th International Conference on Enterprise Information Systems
320
