
A GRAPHICAL WORKBENCH FOR KNOWLEDGE WORKERS
Heiko Haller, Andreas Abecker and Max V
¨
olkel
FZI Research Center for Information Technology, Haid-und-Neu-Str. 10-14, D-76131 Karlsruhe, Germany
Keywords:
Zooming user interface, Diagrammatic knowledge representation, HCI design, Knowledge worker.
Abstract:
We present iMapping, a novel approach for visually structuring information objects on the desktop. iMapping
is developed on top of semantic desktop technologies and particularly supports personal knowledge man-
agement of knowledge workers. iMapping has been designed to combine the advantages of the three most
important visual mapping approaches, Mind-Mapping, Concept Maps and Spatial Hypertext. We describe
the design and prototypical implementation of iMapping—which is fundamentally based on deep zooming
and nesting. iMapping bridges the gap between unstructured content (like informal text notes) and semantic
models by allowing to easily create on-the-fly annotations with the whole range of content links, from vague
associations to formal relationships. Our first experimental evaluations indicate a favorable user experience
and functionality, compared with state-of-the-art, commercial Mind-Mapping software.
1 INTRODUCTION
1.1 Motivation
While practically all enterprise information systems,
as well as most knowledge management (KM) ini-
tiatives, address the level of inter-personal knowl-
edge storage and exchange, recent efforts also address
the level of the individual knowledge worker who—
though being embedded in organisational processes
and communities—nevertheless is in many respects
a relatively autonomous “knowledge processing unit”
with many personal notes, ideas, and artifacts which
shall not and need not to be shared within a bigger
organizational context. The knowledge worker has
not only to be embedded and aligned with community
and organisational information streams and processes,
he or she also needs personal knowledge manage-
ment (Abecker et al., 2009) methods and tools which
support individual task and time management, indi-
vidual creativity, individual lifelong learning, as well
as personal information management in the widest
sense. If one wants to simply use organizational KM
systems and approaches for personal KM, this often
falls short; especially those approaches which rely on
highly-structured information and meta data to be en-
tered and maintained by the user, fail because nobody
wants to make such additional effort with immediate,
visible benefit. For instance, this may be one of the
reasons why semantic technologies have not found
very widespread use, so far, although semantic meta
data would undoubtedly improve findability, interop-
erability and, in general, automated processing of in-
formation and knowledge items.
With our approach, we pursue the hypothesis that
(1) the expected immediate, visible benefit might
be experienced when users manage their everyday
knowledge resources like personal notes, files, book-
marks etc. (like in the setting of a semantic desktop
environment; cp. (Sauermann et al., 2009)), but that
(2) it is also crucial to leave it to the user, how much
effort she wants to put into formalizing content and
meta data.
So, we aim at building an environment that (a) is
able to cover the full range from informal note-taking
over more structured graphical representations up to
formal semantic knowledge models, but that (b) pro-
vides semantic functionalities without restricting the
user’s modeling freedom that is offered in informal
(‘non-semantic’) tools.
When formal semantic knowledge structures are
used, content is typically fine grained and highly
structured. Such content structures are typically more
complex than plain text or classical hypertext struc-
tures. Even with the relatively simple structures
in classical hypermedia, where we just have inter-
linked information objects on the granularity level
of whole pages or documents, hypertext research has
shown that users often get “lost in hyperspace” when
browsing without additional navigational help (Ter-
180
Haller H., Abecker A. and Völkel M. (2010).
A GRAPHICAL WORKBENCH FOR KNOWLEDGE WORKERS.
In Proceedings of the 12th International Conference on Enterprise Information Systems - Human-Computer Interaction, pages 180-185
DOI: 10.5220/0002968601800185
Copyright
c
SciTePress

gan, 2002). This stresses the need for user interfaces
that facilitate navigation and authoring of such struc-
tures without losing orientation.
Using graphical environments for structuring ex-
ternalized knowledge enables the users to employ
their highly efficient sense of spatial orientation on
their personal knowledge and information space, and
it enhances the link between their mental and exter-
nal models—because it enables the use of diagram-
matic depictions whose obvious structure corresponds
more closely to the structure of the content because
(unlike text) diagrammatic knowledge representations
carry a structural analogy to the content they represent
(Schnotz and Bannert, 2003).
So, we developed iMapping as a new visual map-
ping approach that unites the strengths of established
mapping techniques and combines them with seman-
tic technologies and modern HCI approaches like
deep zooming. iMapping supports the whole range
from easy informal note-taking to formalized knowl-
edge engineering in the same powerful, yet easy-to-
use, environment. The basic metaphor of an iMap
is that of a large pin-board where information items
can be spatially arranged, enabling users to gain a vi-
sual overview over collections of items at once. These
items can represent bits of text as well as (in the near
future) any kind of external resources like files, Web
pages, pictures or other maps. They can also be nested
into each other and interlinked in various ways. Be-
sides browsing by links, users can navigate an iMap
by zooming through it.
In this article, we provide a list of requirements
for a next generation visual knowledge mapping ap-
proach which was created from literature studies,
state-of-the-art analysis, and use case requirements
elucidation (Section 1.2). After that, the design of
iMapping is discussed in Sections 2. Section 3 illus-
trates our ongoing evaluation efforts and first promis-
ing results. Finally, we conclude with Section 4 which
contains a summary and some plans for future work.
1.2 Requirements
Based on the analysis of existing tools and approaches
in (Haller, 2003) and literature from the areas of de-
sign and cognitive science, we have identified a set of
functional requirements to be met by diagrammatic
knowledge mapping techniques and tools in order to
be cognitively adequate for extensive personal knowl-
edge management. This collection of requirements
and its rationale is published in (Haller and Abecker,
2009) and will here only be listed in brief:
Requirements for Diagrammatic Knowledge Map-
ping Approaches.
• Free Placing (Items should be freely placeable
anywhere and should maintain their positions—at
least relative to their surrounding.)
• Free Relations: Interlinking items in different lev-
els of formality:
– Formalized / semantic links (Like in ontology
editors)
– Informal labeled links (like in concept maps)
– Unlabeled links (e.g. just of plain arrows or
lines)
– Free nodes, that do not have any explicit rela-
tion to others.
• Annotations: optionally hideable additional notes
or highlights
• Overview / Abstraction through clustering and hi-
erarchical sub-maps
• Scalability (Ability to visually deal with large
amounts of items)
Requirements for Diagrammatic Knowledge Map-
ping Software.
• Simple Editing: Adding or modifying items with-
out additional interaction needed.
• Connecting External Content (e.g. local files or
remote web pages)
• Focus / Filter: deliberately narrowing down visi-
bility to the essential
• Integration of Detail and Context through smooth
and steady zooming, overview functions, levels of
detial.
• Interoperability with other related tools
2 DESIGN
2.1 Visual Knowledge Mapping
In the design of the iMapping approach and software
tool, we aimed at combining the advantages of the
classical mapping approaches and simultaneously ful-
filling to the greatest possible extent the requirements
both listed above.
We began with the requirement of free placing.
Items can be freely created at or they can be moved
to any position in the map. An iMap can be seen as
a virtually infinite pin board. Usually (e.g., for per-
sonal note-taking or idea management), these items
A GRAPHICAL WORKBENCH FOR KNOWLEDGE WORKERS
181

will be short text passages. The size can vary from
just a keyword to a short note or whole paragraphs in-
cluding rich text marked up by using a Wiki syntax
provided by the back end.
These items can contain other items such that one
can use microcontent rather than long, unstructured
text passages. Longer texts are then a sub-map con-
taining a sequence of smaller text-items. The iMap
hierarchy goes down into deeply nested nodes which
can be zoomed into (see Fig. 1) such that a basic hi-
erarchy of information items is created.
The hierarchical structure is represented by visual
inclusion: nested items are shown inside one another.
Compared to a classical tree view like it is used, e.g.,
in Mind-Maps, this has the following benefits:
• It leaves more freedom to place items according
to gestalt principles (Metzger, 1953) (e.g., group-
ing).
• Node-and-link representations (like in classical
concept maps and many other visual languages)
are still possible without interfering with the hier-
archical structure.
• The layout principle stays the same on all levels of
the hierarchy (in concentric trees like Mind-Maps,
all sub-branches point in one direction). Like that,
each part of the map can be treated like a self-
contained sub-map which largely helps clustering
and modularization.
• Nesting by inclusion (which is also widespread,
e.g., in the use of parentheses, Venn diagrams,
tree-maps), is closer to natural orientation where
details are parts of their surrounding. In real life,
when we want to see the big picture, we take a step
back to see the surrounding context of something.
Of course, this kind of nesting is not new in itself.
However, traditional, paper-and-pencil based map-
ping techniques can not cover many levels of hierar-
chy like this. Today, however, with computer-based
mapping approaches, very deep nesting and zooming
is possible which opens up a virtually infinite amount
of space for iMaps to grow over time when used, e.g.,
as personal knowledge repositories.
Adding and creating content to an iMap is done by
clicking anywhere in the map and typing some text.
It is always possible to add vague and unstructured
content. Although allowing for semantic knowledge
management, it has been a fundamental design deci-
sion to never force the user to specify any semantics.
Content can later be refined and formalised incremen-
tally.
There can be multiple visual instances of one and
the same information object, because it may be rele-
vant in different contexts.
For establishing link structures, we distinguish
several different ways of interrelating items which can
be used in an iMap:
1. explicit linking on an item level (stating a rela-
tion between two objects); each of these can be
mere navigational links or carry formal semantics
if specified; in particular, we can distinguish four
kinds of links and ways of establishing them:
(a) labeled links: If no pre-existing relation type is
suitable, the user can always just enter the full
label of the link to be displayed, e.g., along the
arrow. By that, in the back-end a new relation
type with that name is automatically created;
(b) unlabeled links: Links do not have to be labeled
at all;
(c) relating items by short semantic statements
with the QuiKey tool explained below: When
relating two items, the user gets a choice of
existing relation types selectable by an incre-
mental text search over their names, support-
ing reuse of existing relation types and avoiding
misspellings;
(d) hyperlinks: Links do not have to be drawn as
arrows; hyperlinks go from within the text con-
tent of an item to any other item.
2. implicit linking: Following the principle of Spa-
tial Hypertext, items can also be loosely placed in
spatial relations to one another without explicitly
linking them at all. These spatial relations can be
parsed to extract implicit relations, like sequence,
grouping or hierarchy. Currently, the only actu-
ally implemented way of implicit linking is that
of nesting items into another (i.e. placing the link
target inside at a specified position) in order to in-
dicate their hierarchical ordering.
In classic graph-based approaches, nodes usually
have to be arranged in a layout that minimizes edge-
crossings in order to reduce visual complexity. But
even then, maps with large amounts of nodes and
links often suffer from tangled links (aka “spaghetti
syndrome”). To avoid that, unless selected otherwise,
links are only shown on demand. Like that, the links
of current interest are more salient and easier to visu-
ally integrate with the nodes they connect. Depending
on user settings, links can, for instance, become visi-
ble on an mouse-over event (see Fig. 1).
While iMaps can be freely navigated by panning
(scrolling) and zooming like it is known, e.g., from
Google maps, our user tests have shown that users
much prefer navigation guided by content structure
like directly zooming to specific items by point-and-
click or following links. Additional to that, a search
ICEIS 2010 - 12th International Conference on Enterprise Information Systems
182
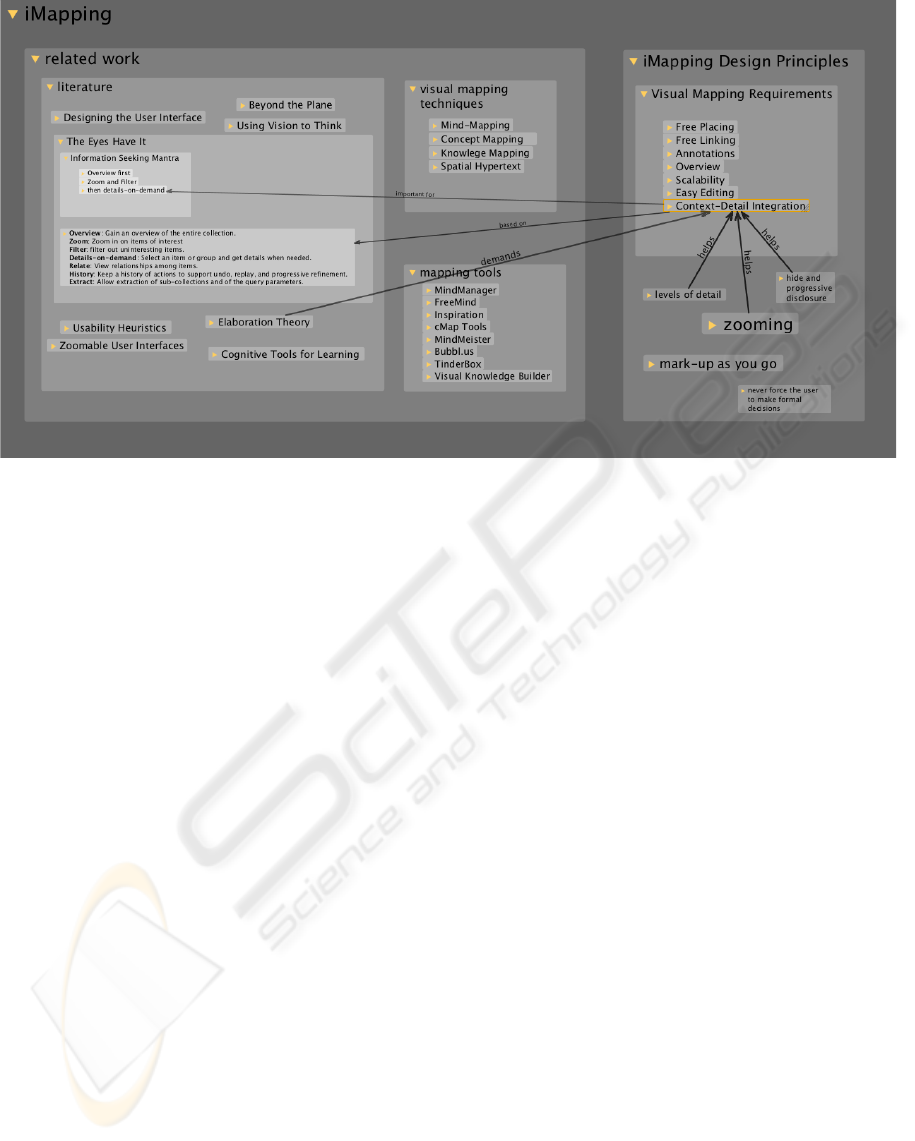
Figure 1: Screen shot with part of an iMap (about iMapping). Only links from and to one item are visible.
function lets users jump to any item directly. How-
ever, any transition to another place in the iMap is car-
ried out by smooth panning and zooming to maintain
a sense of spatial orientation while moving through
the map.
While iMapping focuses on overview and intu-
itive use through a visual approach, this can also
be a burden because every item needs to be deliber-
ately positioned. Hence, it is desirable to complement
such a visual tool by techniques that provide map-
independent access to the same structured informa-
tion. iMapping is complemented by QuiKey, a kind
of smart semantic command-line that focuses on high-
est interaction-efficiency to browse, query and author
semantic knowledge bases in a step-by-step manner.
Among other things, QuiKey allows to jump to any
item in an iMap with just a few keystrokes through a
incremental search function. QuiKey is explained in
more detail in (Haller, 2008); for further information,
see http://quikey.info/.
3 EVALUATION
We carried out a comparative evaluation study to
specifically test the suitability of the nesting and
zooming approach for personal knowledge manage-
ment tasks on a larger scale, because this seems to
be the biggest difference to the classical approaches
discussed in (Haller, 2003) For that purpose, we com-
pared the iMapping prototype with MindManager 7,
the most wide-spread state-of-the-art Mind-Mapping
application. The details of this evaluation are de-
scribed in (Haller and Abecker, 2010).
Test users were presented with pre-filled maps
in both applications: A small biological taxonomy.
Both maps contained the same content in the same
structure—once as a classical Mind-Map and once as
a nested iMap.
The sample of testers consisted of 12 rather het-
erogenous individuals (6 male and 6 female), aged
23 – 64. Their primary occupations were: painter,
journalist, interactive media engineer, photo model,
students (english and biology, computer science,
psychology, economical engineering), PhD students
(healthcare, economics, logistics, semantic web).
The average time each user needed for the dif-
ferent kinds of tasks and the ratings given by the
users were compared between the two tools and tested
for statistical significance with a dependent t-test for
paired samples.
3.1 Results and Discussion
There was no statistically significant difference in the
interaction times measured. However, as Table 1
shows, there was a clear tendency of all editing tasks
(adding, rearranging and interlinking of content) be-
ing carried out slightly faster in the iMapping appli-
cation. This could be explained by users’ comments
that in the iMap, the topology was clearer and eas-
ier to grasp, which is also reflected in the ratings (see
Table 2).
The exact mean times and percentages in compar-
A GRAPHICAL WORKBENCH FOR KNOWLEDGE WORKERS
183

Table 1: Mean times and percentages for groups of tasks in comparison (rounded values)—None of them are significant at the
5% level.
Mind Manager iMapping difference
practice time 5,8 min 8,6 min 2,8 min
adding content 28,0 sec 23,6 sec -4,4 sec
rearranging content 25,5 sec 21,8 sec -3,7 sec
drawing links 27,4 sec 25,7 sec -1,7 sec
visually finding and reading 25,9 sec 33,0 sec 7,1 sec
remembering number without map 33,3% 62,5% 29,2%
remembering content without map 30,8% 37,1% 6,3%
Table 2: Mean ratings given as german school grades for both tools: iMapping is rated better en every category surveyed
(1=“very good”, 2=“good”, 3=“satisfactory”, 4=“sufficient”, 5=“insufficient”).
Mind Manager iMapping difference sig. (p)
navigation 2.4 2.1 0.3 .275
overview 3.0 1.9 1.1
∗∗
.003
structure / interrelations 2.7 2.1 0.6 .270
aesthetics 3.3 2.2 1.1
∗
.038
look and feel 2.5 2.0 0.5 .065
suitability for brainstorming 2.5 2.0 0.5 .137
suitability for note-taking 3.0 1.9 1.1
∗∗∗
.001
suitability for personal KM 3.3 2.0 1.3
∗∗∗
.000
overall rating 3.0 2.0 1.0
∗∗∗
.000
average 2.9 2.0 0.9
∗∗∗
.001
ison can bee seen in table 1. The average subjective
ratings that were given as german school grades for
both tools are listed in table 2. iMapping was rated
better in every surveyed aspect and almost one full
grade better in average. Most of these findings were
statistically significant—in particular: overview and
aesthetics were rated better in iMapping, which was
also perceived to be more suitable for note taking and
personal knowledge management in general. Espe-
cially in the overall rating, iMapping was rated ‘good’
in average as opposed to only ‘satisfactory’ Mind-
Manager.
The good rating for overview is also backed by
many spontaneous comments made during testing, in
the direction of iMapping providing an easier way to
get an overview over especially the coarse structure—
through the general approach of nested items, the pos-
sibility to arrange them freely and through the facility
to zoom all the way out and back in a gain with only
two keystrokes.
The good rating for aesthetics came somewhat as
a surprise, since three of the female testers had vehe-
mently complained about the lack of color in the pre-
dominantly grey iMapping prototype. But even so,
the current visual design of the iMapping application
seems to be quite well-received.
We proudly note that the best rating and highest
advantage has been given for the aspect suitability
personal knowledge management in general. How-
ever this is not surprising, since MindManager is not
designed for very large maps whereas it was a core
requirement for iMapping to be able to scale up to ex-
tremely large maps as they can evolve over years of
personal knowledge management.
All in all we are satisfied with the result that iMap-
ping is in objective measures of time needed for inter-
action for typical tasks comparabe and in subjective
measures even superior to MindManager, which can
be regarded as state of the art, has millions of users
and is on the market since 1994.
Since the intended usage scenarios for iMap-
ping exceed those overlapping with MindManager,
some hypothesized advantages could not be tested in
this setting and are subject to ongoing investigation.
Namely: Longterm use for personal knowledge man-
agement, the use of much larger maps with thousands
of items, the use of QuiKey and using semantic links
and queries.
4 SUMMARY AND OUTLOOK
Semantic knowledge management technologies
might in the future be able to significantly increase
interoperability between applications even across
context boundaries and they might leverage the
ICEIS 2010 - 12th International Conference on Enterprise Information Systems
184

creative and productive power of knowledge work-
ers. However, if knowledge management does not
start at the personal level, and starts with provid-
ing immediate benefit to the individual knowledge
worker, it is questionable whether semantic knowl-
edge management systems will ever spread very
far. Focusing on user interaction and cognitive er-
gonomics is obviously an important issue there, es-
pecially because in knowledge-intensive tasks, a user
can barely afford to sacrifice much of his limited cog-
nitive capacity (Miller, 1956) to dealing with the tool
instead of dealing with the content itself. Especially
for large knowledge repositories with highly inter-
linked information items of different levels of for-
malization, iMapping-based user interfaces can make
knowledge management more intuitive, on one hand,
and more powerful, on the other hand, because it pro-
vides a medium that fosters the use of visual orienta-
tion in a flexible and easy way and yet supports more
structured knowledge modeling in just the desired de-
gree of formalization.
While we continue improving our first iMapping
tool, we hope the general approach will find more
widespread application. Its flexible, zooming-based
approach, e.g., also makes iMapping a candidate for
mobile use on rather small displays. Of course, a cen-
tral focus of our immediate next working steps is on a
broader and deeper qualitative and quantitative evalu-
ation of the approach and its implementation.
ACKNOWLEDGEMENTS
This work has been partially funded by the Euro-
pean Commission in the projects NEPOMUK, MA-
TURE and myUI, by the German Federal Ministry for
Economy BMWi within the THESEUS research pro-
gramme, and by the German Federal State of Baden-
W
¨
urttemberg. Special thanks go to Henning Sperr for
the implementation work of iMapping.
REFERENCES
Abecker, A., V
¨
olkel, M., and Haller, H. (2009). 1st Work-
shop on Personal Knowledge Management (PKM-
2009). In Hinkelmann, K. and Wache, H., editors,
WM2009: 5th Conference on Professional Knowledge
Management. GI-Edition Lecture Notes in Informat-
ics (LNI), Bonner K
¨
ollen Verlag.
Haller, H. (2003). Mappingverfahren zur Wissens-
organisation. http://www.knowledgeboard.com/. Last
access: 2010-02-10. In German.
Haller, H. (2008). Quikey. In Bloehdorn, S., Grobelnik,
M., Mika, P., and Duc, T. T., editors, Proceedings of
the Workshop on Semantic Search (SemSearch 2008)
at the 5th European Semantic Web Conference (ESWC
2008), volume 334, pages 74–78. CEUR-WS.
Haller, H. and Abecker, A. (2009). Requirements
for Diagrammatic Knowledge Mapping Techniques.
In Conference Proceedings of I-KNOW’09 and I-
SEMANTICS’09. Online Proceedings, URL: http://i-
know.tugraz.at/. Last access: 2010-02-10.
Haller, H. and Abecker, A. (2010). imapping – a zoom-
ing user interface approach for personal and semantic
knowledge management. In Toms, E., Bernstein, M.,
and Millard, D., editors, Proceedings of the Hypertext
Conference. ACM. in print.
Metzger, W. (1953). Gesetze des Sehens. Kramer, Frank-
furt. In German.
Miller, G. A. (1956). The magical number seven, plus or
minus two: Some limits on our capacity for processing
information. Psychological Review, 63:81–97.
Sauermann, L., Kiesel, M., Schumacher, K., and Bernardi,
A. (2009). Semantic Desktop. In Blumauer, A. and
Pellegrini, T., editors, Social Semantic Web, pages
337–362. Springer-Verlag, X.media.press.
Schnotz, W. and Bannert, M. (2003). Construction and
interference in learning from multiple representation.
Learning and Instruction, 13:141–156.
Tergan, S. (2002). Hypertext und Multimedia: Konzeption,
Lernm
¨
oglichkeiten, Lernprobleme und Perspektiven.
In Issing, L. J. and Klimsa, P., editors, Information
und Lernen mit Multimedia und Internet. Beltz, PVU,
third, completely revised edition. In German.
A GRAPHICAL WORKBENCH FOR KNOWLEDGE WORKERS
185
