
NEMO
A Network Monitoring Framework for High-performance Computing
Elio P
´
erez Calle
Department of Modern Physics, University of Science and Technology of China, 96 Jinzhai Road, Hefei, Anhui, China
Keywords:
High energy physics, Distributed computing, High-performance computing, Monitoring, Security.
Abstract:
The volume of data generated by the Large Hadron Collider (LHC), several PetaBytes (PB) per year, requires a
distributed tier-organised structure of computing resources for mass storage and analysis. The complexity and
diversity of the components of this structure (hardware, software and networks) require a control mechanism
to guarantee high-throughput high-reliability computing services. NEMO is a monitoring framework that has
been developed in one of the computing clusters that receive data from LHC and has been designed to measure
and publish the state of a cluster resources, maximize performance and efficiency and guarantee the integrity
of the cluster.
1 INTRODUCTION
Located in the border between Switzerland and
France, at the European Laboratory for Particle
Physics (CERN, Geneva), the Large Hadron Collider
(LHC) is the largest and most ambitious particle ac-
celerator installation ever built. LHC resumed opera-
tions last February, and the volume of data recorded
for off-line reconstruction and analysis will be of the
order of several PetaBytes (PB) per year.
This imposes a computing challenge at the level of
management and access of the data to be analyzed by
all physicists over the world. To archive and analyze
this large amount of data, the LHC depends on the
biggest world-wide computer resource available: the
World-wide Large Hadron Collider Computing Grid
(WLCG).
The WLCG combines the computing resources
of more than 130 computing centers in 34 countries,
aiming to harness the power of 100,000 CPUs to pro-
cess, analyze and store data produced from the LHC,
making it equally available to all partners, regardless
of their physical location. In the case of the LHC, a
novel globally distributed model for data storage and
analysis computing and data Grid was chosen because
it provides several key benefits.
The key features of the WLCG are making possi-
ble multiple copies of data to be kept in different sites,
allowing an optimum use of spare capacity for multi-
ple computer centres, avoiding single points of failure
and making easier round-the-clock work by having
computer centres in multiple time zones.
An additional benefit is the distribution of the cost
of maintainance and upgrades, since individual in-
stitutes fund local computing resources and retain-
responsibility for these, while still contributing to
the global goal. Finally, independently managed re-
sources have encouraged novel approaches to com-
puting and analysis. Some of these approaches, ini-
tially developed to be used in the WLCG, have been
extended to other computing clusters in the collabo-
rating institutes.
The computing architecture of the WLCG is based
on a tier-organised structure of computing resources,
based on a Tier-0 (T0) centre at CERN; 11 Tier-1 (T1)
centres, including one at CERN, for organized mass
data processing and storage, and more than one hun-
dred Tier-2 (T2) and Tier-3 (T3) centres where user
physics analysis over data products from T1s.
The T0 is in charge of storing the data com-
ing from the detector onto mass storage, performs a
prompt reconstruction of the data and distributes the
data among the T1 centres. The T1 sites archive on
mass storage its share of data, run data reprocessing,
organized group physics analysis for data selection
and distribute down the selected data to T2s and T3s
for user analysis.
The WLCG has run around 185 million jobs in the
twelve months since July 2008, and this number is
constantly increasing as new technologies and meth-
ods become available (CERN, 2010).
61
Pérez Calle E. (2010).
NEMO - A Network Monitoring Framework for High-performance Computing.
In Proceedings of the International Conference on Data Communication Networking and Optical Communication Systems, pages 61-66
DOI: 10.5220/0002968700610066
Copyright
c
SciTePress
2 MONITORING: A KEY ISSUE
The WLCG environment is potentially a complex
globally distributed system that involves large sets of
diverse, geographically distributed components used
for a number of applications. These components in-
clude all the software and hardware services and re-
sources needed by applications. The diversity of these
components and their large number of users render
them vulnerable to faults, failure and excessive loads.
Suitable mechanisms are needed to monitor the com-
ponents, and their use, hopefully detecting conditions
that may lead to bottlenecks, faults or failures. Moni-
toring is a critical facet for providing a robust, reliable
and efficient environment.
The goal of monitoring is to measure and publish
the state of resources at a particular point in time. To
be effective, all components in an environment must
be monitored. This includes software (e.g. operating
systems, services, processes and applications), host
hardware (e.g. CPUs, disks, memory and sensors) and
networks (e.g. routers, switches, bandwidth and la-
tency). Monitoring data is needed to understand per-
for mance, identify problems and to tune a system for
better overall performance, and thereby monitoring is
a key issue to achieve high-throughput high-reliability
computing services required for WLCG.
In addition, a monitoring system can guarantee the
cluster security acting as a intrusion detection system,
allowing to detect an intruders presence in the system
as soon as possible. A quick detection will minimize
any damages produced to the system and will avoid
the platform to be used as a base for further attacks
to other systems. Monitoring can provide this early
detection of any unauthorized access by seeking for
changes in local files and looking at network traffic
for predened patterns and specific packets.
2.1 Previous Developments
Since the first deployments of the WLCG in 2003,
several software tools have been employed to mon-
itor the computing cluster. Before the deployment
of NEMO, these tools were based on Nagios (Perez-
Calle, 2004a), an open source intrusion detection sys-
tem, and Tripwire (Perez-Calle, 2004b), a file in-
tegrity scanner. This approach was mainly focused
on host and network security, although the state of
hardware and sotware resources was also taken into
account.
In this environment, Nagios acted as an umbrella
for other monitoring software (mainly Tripwire, Chk-
rootkit and Logcheck), offering a web interface with
graphing capabilities where the information provided
by other software could be displayed. This central-
ized information server simplified system administra-
tion tasks and reached an important milestone in mon-
itoring for the WLCG and EGEE (Enabling Grids for
E-SciencE) projects (Wartel, 2005).
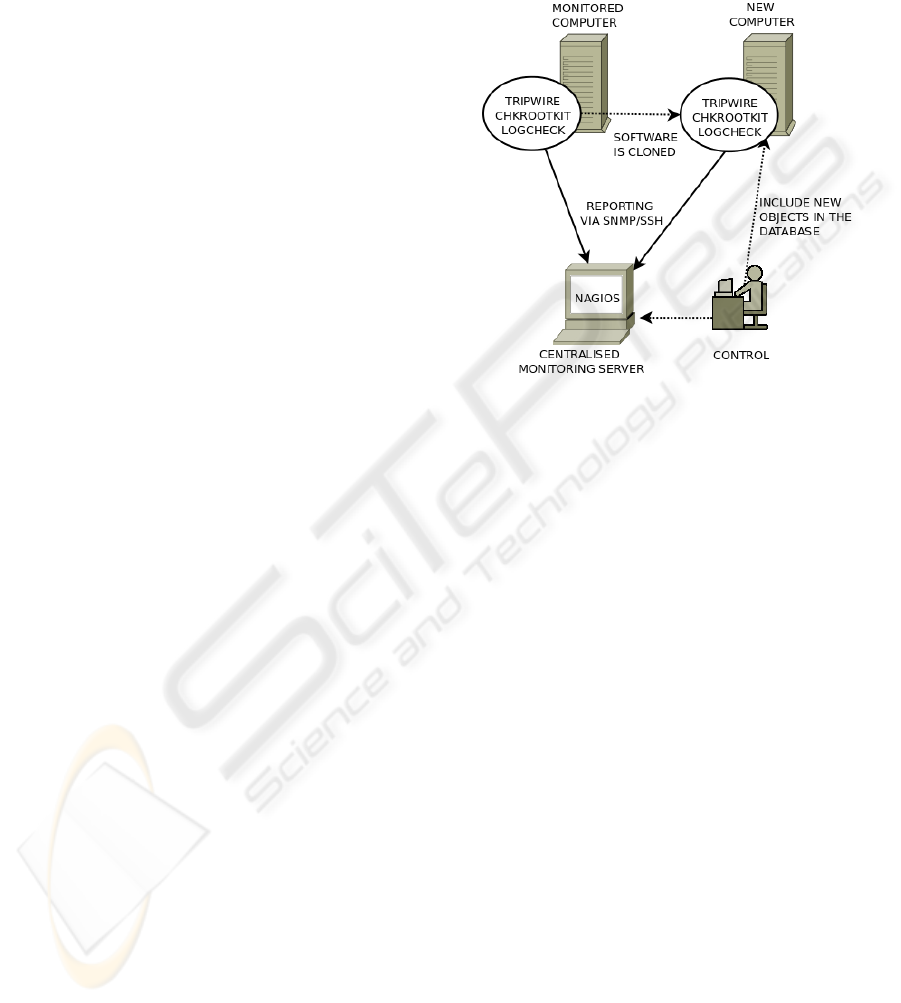
Figure 1: Diagram of a Nagios-based monitoring system.
Dotted lines show monitoring tasks, straight lines show in-
formation flow.
However, this approach showed some limitations
in such a heterogeneous environment as WLCG is,
where fast-growing clusters are composed by differ-
ent computing machines. The Nagios-based toolkit
was relatively easy to deploy, but maintainance turned
to be complex. This software toolkit lacked a tool to
discover newly added machines (so they are automati-
cally added to the application’s database), so new ma-
chines had to be added in the database by operators,
as shown in figure 1.
In addition to this “passive” behaviour, system ad-
ministrators required a better processing of the mon-
itoring data, so it could be easily turned into relevant
information by detailed sorting. A way to estimate
trends based on the statistic data stored in the database
was also required, as it was considered useful to es-
timate the consequences of cluster ampliations and
helpful to spot future bottlenecks.
2.2 Overview of NEMO
The guidelines of the NEMO framework are designed
to overcome the limits of the previous deployment re-
ducing system administration tasks. Therefore, the
main objectives of this research project are the fol-
lowing:
• Develop an automatic system to measure and pub-
lish the state of the cluster resources, including
DCNET 2010 - International Conference on Data Communication Networking
62
hardware, software and networks, performing an
“active” behaviour.
• Maximize the cluster performance and efficiency
to meet WLCG computing level requirements.
• Guarantee the integrity of the cluster deploy-
ing software inspired by the security-by-design
paradigm.
• Simplify cluster system administration, reducing
unnecessary tasks and obtaining more information
on future trends.
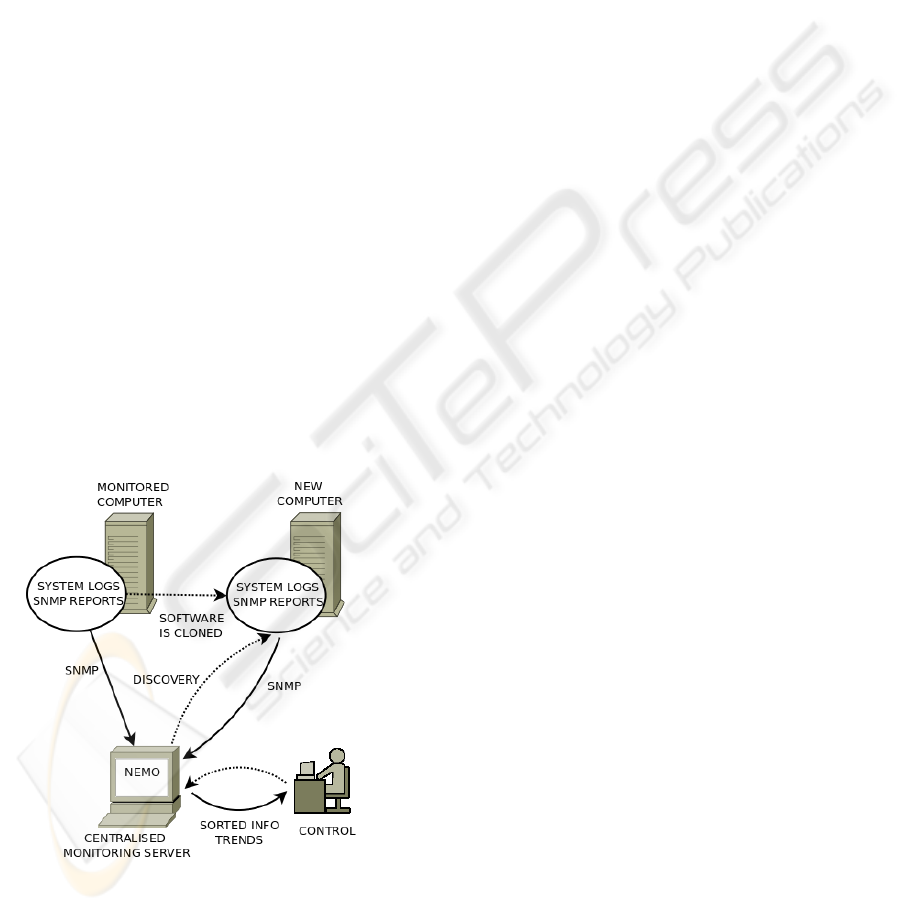
The basic diagram of NEMO is shown in figure 2.
NEMO performs an active behaviour detecting new
added hardware and is able to process statistical data
recorded to help operators to anticipate future trends.
Once a machine has been detected, its monitoring data
is automatically retrieved, using specific procedures,
and stored in several centralized servers.
Afterwards this data can be processed and pre-
sented to operators using graphic tools and thereby
simplifying system administration. In addition to
monitoring information, NEMO performs also in-
bound and outbound connection performance mea-
surements, which were not present in previous de-
ployments. These measurements are shared with
other centres in Europe and the USA to obtain a bet-
ter knowledge of the Tier network. Infomation is also
retrieved from those centres, so network performance
measurements are not considered private.
Figure 2: Basic diagram of NEMO. Dotted lines show mon-
itoring tasks, straight lines show information flow.
On the contrary, any information regarding the
state of the cluster resources will be only stored on
local servers and will not be released to the Inter-
net. The data considered private contains detailed
information about system users, processes and hard-
ware capabilities, so every one of these operations
has to be performed with the highest conditions of
safety, security and reliability. In order to achieve this
goal, NEMO combines software designed to provide
a secure environment to transfer monitoring informa-
tion. In summary, public data is retrieved from mon-
itored computers, stored in a central server and avail-
able though the Internet. Private monitoring data is
retrieved, stored in centralised servers and available
only to the system administrators.
3 GENERAL DESCRIPTION
The monitoring information processed by NEMO can
be divided into three different types: operating system
logs analysis (private data), monitoring reports and
graphs (private data), and network performance mea-
surements (public and available through the Internet).
These three kinds of information are handled by three
different software applications: Syslog/NG (retrieves
and classifies system logs), Cacti (obtains monitoring
reports and graphs) and Perfsonar (performs network-
ing measurements).
These three types of information are mainly re-
lated to evaluate the cluster performance and to iden-
tify possible failures. As previous developments were
used, NEMO is also employed as a intrusion detec-
tion system. The functional components of NEMO
are depicted in figure 3.
3.1 Operating System Logs
Every computer in the cluster runs Scientific Linux, a
operating system based on RedHat Enterprise Linux.
The operating system records a wide range of infor-
mation produced by the programs, applications and
daemons, including source, priority, date and time of
every message, in the system logs. These logs pro-
vide a valuable source of information in order to iden-
tify any malfunction that could lead to a underperfor-
mance or a system vulnerability that could be used by
a malicious user to cause damage to the computing
cluster.
System logs are stored locally by default, so ev-
ery computer has to be accessed by operators to anal-
yse the information contained. Therefore, the man-
agement of a big computing cluster can be simpli-
fied if all the logs are recorded and centralized in just
one server to be analysed afterwards. Using the Sys-
logng (Balabit, 2010) software, NEMO transfers sys-
tem logs via TCP protocol from the computing nodes
to a remote server. Transport Layer Security (TLS)
NEMO - A Network Monitoring Framework for High-performance Computing
63

is used to encrypt the communication, and mutual au-
thentication is based on X.509 certificates. This pro-
cedure guarantees the integrity and the security of the
information from its source to its destination.
After being securely transferred to a central server,
operating system logs coming from multiple comput-
ers can be sorted and classified based on their content
and various parameters, such as source host, appli-
cation and priority. Directories, files, and database
tables can be created dynamically using macros. In
addition, complex filtering using regular expressions
and boolean operators offers almost unlimited flexi-
bility to forward only the important log messages to
the selected destinations.
These tools allow operators to transform the data
contained in the system logs in easily readable infor-
mation. Once this information is properly classified,
trivial messages will be discarded and any important
message will rapidly pop up. Operators can spot any
current situation and anticipate future problems, espe-
cially those related to the cluster overall performance
and the security and integrity of the scientific data
stored.
3.2 Reports, Graphs and Trends
Operating system logs provide a valuable source of
information about programs, applications and dae-
mons. Nevertheless, they provide very little informa-
tion about the system hardware, not to mention other
devices such as routers and switches. In a complex
computing cluster, another tool has to be used to mon-
itor local hardware and network devices and thereby
guarantee a proper use of the computing resources.
In addition to the information provided by op-
erating systems logs, specific information will be
recorded:
• Hardware health, e.g. CPUs, mass storage devices
and memory.
• Specific software, e.g. communication services
and scientific applications.
• Network devices, e.g. routers, switches, band-
width and latency.
In order to track these parameters, NEMO uses
Cacti (Berry, 2007), a graphing program for network
statistics. Cacti provides a fast poller, advanced graph
templating, and multiple data acquisition methods.
This is a system to store and display time-series data
such as network bandwidth, machine-room tempera-
ture, and server load average, which is a perfect com-
plement to the centralized and classified system logs
and together provide a complete image of the system.
Cacti provides both another way to retrieve informa-
tion from the computing nodes and a way to present
this information.
3.2.1 Retrieving the Information
Data is retrieved via Simple Network Management
Protocol (SNMP) (Harrington, 2004) or external shell
scripts. Monitored systems (also called Slaves), ex-
ecute locally a software component called an agent,
which reports information via SNMP to the moni-
toring systems (also called Masters). SNMP agents
expose management data on the monitored systems
as variables (such as “free memory”, “system name”,
“number of running processes”, “number of users”).
SNMP also permits active management tasks, such as
modifying and applying a new configuration.
The monitoring system can retrieve the informa-
tion through several protocol operations or the agent
(installed on the monitored system) will send data
without being asked. Monitored systems can also
send configuration updates or controlling requests to
actively manage a system. The variables accessible
via SNMP are organized in hierarchies to simplify
management.
3.2.2 Presenting the Information
In a complex network, made of hundreds or even
thousands of different devices, all the collected in-
formation is useful only if it is presented properly.
Therefore, the information provided by the SNMP
agent is displayed by Cacti using graphs. These
graphs allows the operator to quickly check the over-
all status of the cluster, and its short-time and long-
time evolution, and therefore any malfunction can be
easily spotted. Threshold alerts can be set up to au-
tomatically identify any anomaly, e.g. free memory
below a previously defined limit, and notify the oper-
ator immediately.
Presenting the information is the last but not the
least step of monitoring after retrieving and storing
it. In a similar fashion as system logs are submit-
ted to intense classification in the centralised mon-
itoring node, all other information retrieved from
the managed nodes is processed to be shown using
graphs. This graphs allow to better identify current
performance and easily compare it with historic data.
NEMO makes use of Cacti trending capabilities to es-
timate possible future evaluation of performance.
3.3 Intrusion Detection
As it was shown in section 2.1, previous develop-
ments were mainly focused on host and network secu-
DCNET 2010 - International Conference on Data Communication Networking
64
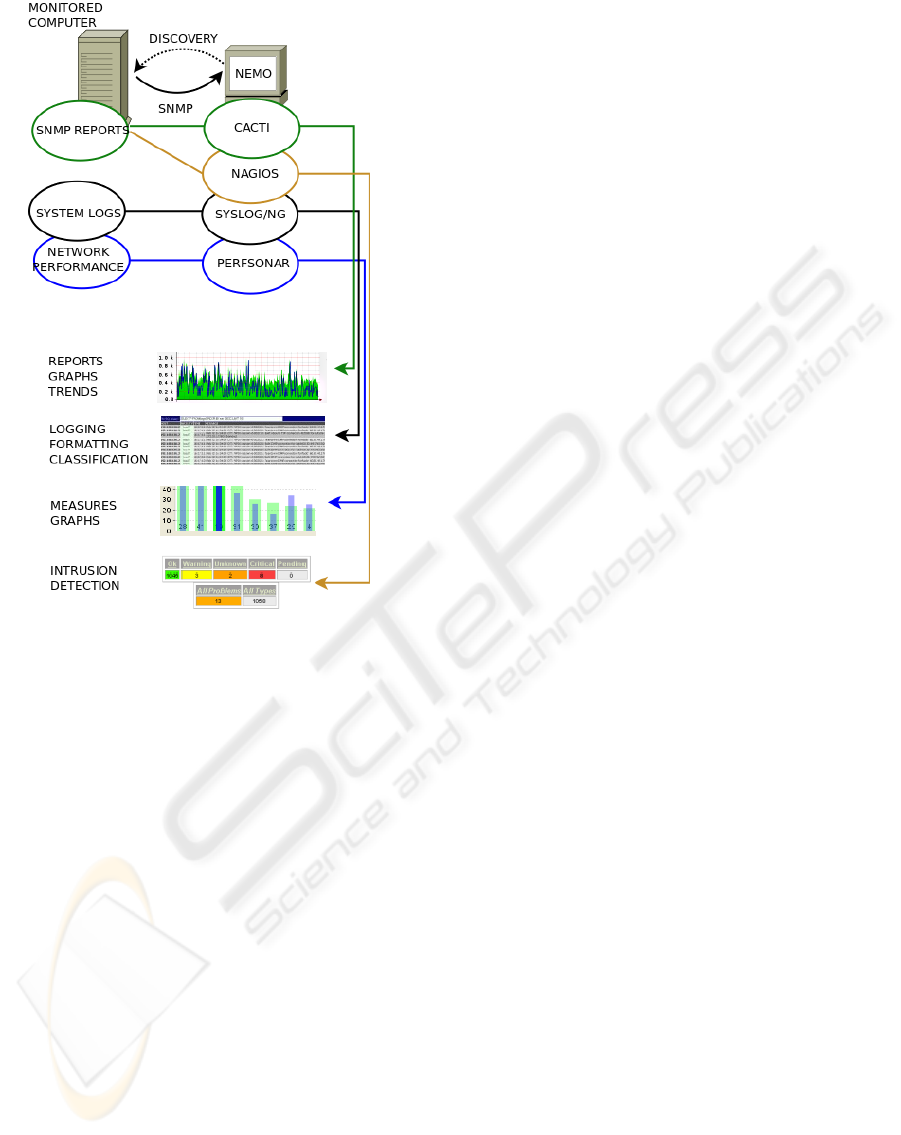
Figure 3: Functional components of NEMO. Dotted lines
show monitoring tasks, straight lines show information
flow. One of this functional components, Nagios, is actu-
ally operating under Cacti’s umbrella.
rity, acting as intrusion detection systems. The graph-
ing capabilities of Nagios made it an umbrella for
other monitoring sofware, presenting the retrieved in-
formation in its web interface. However, the limita-
tions of a Nagios-based monitoring system regarding
automatic discovery and trend prediction are too im-
portant to continue using Nagios as the base of a het-
erogeneous environment such as WLCG.
Nevertheless, the intrusion detection system capa-
bilities of Nagios can be still used integrating it in
Cacti as a add on. In this situation, Nagios can be
used to spot a failure o malfunction and Cacti can
obtain information over time and present it using de-
tailed graphs –Cacti would be acting as an umbrella
in this case, retrieving information from Nagios as
it does from other sources. Actually, one of Cacti’s
main strengths is the posibility of upgrading it using
plugins, such as the Nagios-Cacti integration one, and
this way some of the code developed for Nagios can
be reused.
3.4 Network Performance
In addition to the performance monitoring and the in-
trusion detection service, NEMO includes a specific
tool to monitor network performance. As WLCG is a
distributed environment, data has to be sent over the
Internet form LHC to the Tier centers. The measure-
ment of network bandwidth and throughput is a key
priority, and a specific tool has been set up to monitor
network connections to other Tier centers.
PerfSONAR (Tierney, 2009) is the infrastructure
used by NEMO for network performance monitoring.
PerfSONAR contains a set of services delivering per-
formance measurements in a federated environment.
These services act as an intermediate layer, between
the performance measurement tools and the diagnos-
tic or visualization applications. This layer is aimed at
making and exchanging performance measurements
between networks, using well-defined protocols.
The information provided by PerfSONAR is used
to analyse bandwidth and throughput performance,
and thereby evaluate the efficiency of external com-
munication networks. This information is shared with
our project partners through a dedicated server in or-
der to facilitate an overall comprehension of the data
flow, which is a key issue in the WLCG structure of
distributed computing.
3.5 Further Development
NEMO is currently coping all the monitoring neces-
sities of the computing cluster. However, the adqui-
sition of new hardware such as routers with spefi-
cic characteristics is continuously offering new chal-
lenges to the system administrators. New features,
mainly related to hardware needs, are currently un-
der study and will be probably added to NEMO in
the near future, as a plugin for Cacti. This approach
allows other members of the community to add this
feature to their deployments and think of NEMO as a
possible solution for their monitoring needs.
4 ALTERNATIVES TO NEMO
Once it was decided that the previous monitoring
framework had to be upgraded, a few alternatives
to NEMO were studied before deciding to build this
software toolkit. The first and best known software
to be evaluated was Ganglia (Becker, 2008). Ganglia
is a system monitor widely used in computing clus-
ters and grids that allows the operators to remotely
view historical statistics of the monitored machines.
Despite its widespread aceptation (Ganglia is used at
NEMO - A Network Monitoring Framework for High-performance Computing
65

CERN itself), Ganglia cannot be fully adapted to the
need of our project, as it is mainly focused on uti-
lization and performance metrics of computer nodes,
rather than focusing on service availability and prob-
lem notification, being the latter a important part of
our monitoring needs.
Another alternative to NEMO is Lemon (CERN,
2008), a server/client based monitoring system. On
every monitored node, a monitoring agent launches
and communicates using a push/pull protocol with
sensors which are responsible for retrieving monitor-
ing information. The extracted samples are stored on
a local cache and forwarded to a central Measurement
Repository than can be accessed through a RRDTool-
based web interface. Lemon is a useful tool to detect
failures and malfunctions using the so-called “sen-
sors” but lacks the flexibility of NEMO, provided by
Cacti and the functionality of its plugins. Additionaly,
trend prediction and autodiscovery are not present in
Lemon at this moment.
5 CONCLUSIONS
The NEMO tookit provides a monitoring framework
for a computing cluster, including hardware, software
and networks, allowing a continuous and exhaustive
analysis of the cluster status and its inbound and out-
bound connections in order to maximize running time
and minimize failures. Therefore higher standards of
performance and efficiency can be met and a better
use of the computing resources can be achieved, de-
tecting and eliminating possible bottlenecks.
NEMO performs its tasks in a more efficient
way than previous developments. This is possible
by reducing the number of operation tasks enabling
new equipment automatic discovery and making use
of intense classification of the information provided
by system logs. The improved efficiency facilitates
large-scale centralized execution. The flexibility of
Cacti, NEMO’s main component, allows adapting it
to the needs of a given cluster. This flexibility made
possible the use of previously deployed software, and
therefore NEMO acts also as a intrusion detection
system, providing an extra layer of security to the
computing environment.
Finally, the inclusion of a graphing system sim-
plifies administration providing the operators current
and historic data about the cluster performance. The
statistical data provided by the different tools intre-
grated in NEMO can be used to predict future trends
and therefore simplify the monitoring of large, com-
plex and heterogeneous clusters such as WLCG.
ACKNOWLEDGEMENTS
This work received the support of the EU Science and
Technology Fellowship Programme China.
REFERENCES
Balabit (2010). The Syslog-ng Administration Guide. Bal-
abit IT Security Ltd, 10th edition.
Becker, J. (2008). Marching Penguins: Monitoring Your
HPC Cluster. Linux Magazine.
Berry, I. (2007). The Cacti Monitoring Tool. The Cacti
Group, http://www.cacti.net.
CERN (2008). Lemon: Large Hadron Collider Era Moni-
toring. http://lemon.web.cern.ch/lemon/index.shtml.
CERN (2010). The Worldwide Large Hadron Col-
lider Computing Grid project (WLCG). Euro-
pean Organisation for Nuclear Research, CERN.
http://lcg.web.cern.ch/LCG/.
Harrington, D. (2004). An Architecture for Describing Sim-
ple Network Management Protocol (SNMP) Manage-
ment Frameworks. Internet Engineering Task Force
Request for Comments 3411.
Perez-Calle, E. (2004a). Using Nagios for Intrusion De-
tection. The International Conference on Comput-
ing in High Energy and Nuclear Physics, Interlaken,
Switzerland.
Perez-Calle, E. (2004b). Using Tripwire to Check Clus-
ter System Integrity. The International Conference on
Computing in High Energy and Nuclear Physics, In-
terlaken, Switzerland.
Tierney, B. (2009). Instantiating a Global Network Mea-
surement Framework. BNL Technical Report LBNL-
1452E.
Wartel, R. (2005). Security Monitoring. Second WLCG/
EGEE Grid Operations Workshop, Bologna, Italy.
DCNET 2010 - International Conference on Data Communication Networking
66
