
STATISTICAL ASSOCIATIVE CLASSIFICATION OF
MAMMOGRAMS
The SACMiner Method
Carolina Y. V. Watanabe
1,2
1
Department of Informatics, Federal University of Rondˆonia, Porto Velho, RO, Brazil
Marcela X. Ribeiro
Computer Department, Federal University of S˜ao Carlos, S˜ao Carlos, SP, Brazil
Caetano Traina Jr., Agma J. M. Traina
2
Department of Computing, University of S˜ao Paulo, S˜ao Carlos, SP, Brazil
Keywords:
Statistical association rules, Computer-aided diagnosis, Associative classifier, Breast cancer.
Abstract:
In this paper, we present a new method called SACMiner for mammogram classification using statistical asso-
ciation rules. The method employs two new algorithms the StARMiner
∗
and the Voting classifier (V-classifier).
StARMiner
∗
mines association rules over continuous feature values, avoiding introducing bottleneck and in-
consistencies in the learning model due to a discretization step. The V-classifier decides which class best rep-
resents a test image, based on the statistical association rules mined. The experiments comparing SACMiner
with other traditional classifiers in detecting breast cancer in mammograms show that the proposed method
reaches higher values of accuracy, sensibility and specificity. The results indicate that SACMiner is well-suited
to classify mammograms. Moreover, the proposed method has a low computation cost, being linear on the
number of dataset items, when compared with other classifiers. Furthermore, SACMiner is extensible to work
with other types of medical images.
1 INTRODUCTION
The technological progress on acquiring medical im-
ages increased the need of classification methods to
speed-up and to assist the radiologists in the image
analysis task. Hence, there is an increasing need of
more accurate and low computational cost computer-
aided methods. In this scenario, new approaches have
been developed and employed in the computer-aided
diagnosis (CAD) field. One of these approaches is
the association rule mining, which has become an ef-
fective way to develop classification methods for en-
hancing the accuracy of medical image analysis. In
most of these approaches,images are submitted to im-
age processing algorithms to produce a feature vector
representation of them. The images, represented by
a set of continuous features, are submitted to associ-
ation rule mining algorithms to reveal their intra- and
inter-class dependencies. These rules are then em-
ployed for classification. In general the association-
rule based approaches reach higher values of accu-
racy when compared to other rule-based classification
methods (Dua et al., 2009).
In this paper, we present a new method, called
Statistical Associative Classifier Miner (SACMiner),
for mammogram classification using statistical asso-
ciation rules. The method employs statistical asso-
ciation rules to build a classification model. First,
the images are segmented and submitted to a feature
extraction process. Each image is represented by a
vector of continuous visual features, as texture, shape
and color. In the training phase, statistical associa-
tion rules are mined relating continuous features and
image classes. The rules are mined using a new al-
gorithm called StARMiner*, which is based on the
feature selection algorithm StARMiner, proposed by
(Ribeiro et al., 2005), to produce more semantically
significant patterns. StARMiner* does not require
121
Y. V. Watanabe C., X. Ribeiro M., Traina Jr. C. and J. M. Traina A. (2010).
STATISTICAL ASSOCIATIVE CLASSIFICATION OF MAMMOGRAMS - The SACMiner Method.
In Proceedings of the 12th International Conference on Enterprise Information Systems - Artificial Intelligence and Decision Support Systems, pages
121-128
DOI: 10.5220/0002970501210128
Copyright
c
SciTePress

the discretization step, like the other methods. This
avoids embedding the inconsistencies produced by
the discretization process in the mining process and
also, makes the whole process faster. In the test phase,
a voting classifier decides which class best represents
a test image, based on the statistical association rules
mined. The experiments comparing SACMiner with
traditional classifiers show that the proposed method
reaches high values of accuracy, sensitivity and speci-
ficity. These results indicate that SACMiner is well-
suited to classify mammograms. Another advantage
of SACMiner is that it builds a learning model that is
easy of understanding, making the user aware of why
an image was assign to a given class. Moreover, the
proposed method has a low computation cost (linear
on the number of dataset items) when compared to
other classifiers.
This paper is structured as follows. Section 2
presents concepts and previous work related to this
paper. Section 3 details the proposed method. Sec-
tion 4 shows the experiments performed to evaluated
the method. Finally, Section 5 gives the conclusion
and future directions of this work.
2 BACKGROUND AND RELATED
WORKS
The problem of mining association rules consists in
finding sets of items that frequently occurs together
in a dataset. It was first stated in (Agrawal et al.,
1993) as follows. Let I = {i
1
, . . . , i
n
} be a set of liter-
als called items. A set X ∈ I is called an itemset. Let R
be a table with transactions t involving elements that
are subsets of I. An association rule is an expression
of the form X → Y, where X and Y are itemsets. X is
called body or antecedent of the rule, and Y is called
head or consequent of the rule.
Let |R| be the number of transactions in relation
R. Let |Z| be the total number of occurrences of the
itemset Z in transactions of relation R. The Support
and confidence measures (Equations 1 and 2) are used
to determine the rules returned by the mining process.
Support =
|X ∪Y|
|R|
(1)
Confidence =
|X ∪Y|
|X|
(2)
The problem of mining association rules, as it was
first stated, involves finding rules on a database of
categorical items that satisfy the restrictions of min-
imum support and minimum confidence specified by
the user. This problem involves finding rules that
correlate categorical (nominal) data items. However,
images are represent by feature vectors of continu-
ous values. Thus, an approach that handles quan-
titative values should be more appropriated to work
with images. In (Aumann and Lindell, 1999; Ribeiro
et al., 2005; Srikant and Agrawal, 1996) procedures
for mining quantitative association rules, which relate
continuous-valued attributes, are presented.
In fact the association rules have been employed
in mining images using discrete and categorical at-
tributes. One of these works was presented in (Or-
donez and Omiecinski, 1999). In this work, a proce-
dure for discovering association rules in image con-
tent from a simple image dataset is presented. The im-
ages are previously segmented in blobs. The segmen-
tation process grouped pixels according to their sim-
ilarity. After these processes, a feature vector is gen-
erated to represent each blob. A similarity function is
applied to compare blobs from different images, and
if they are considered similar, they are represented
by the same object identifier (OID). The OIDs from
the objects of each image compose the image records.
The image records are used to represent the images
during the mining process. An association rule min-
ing algorithm is applied to the image records, generat-
ing rules relating the object identifiers. The resulting
rules show the relationship between the most frequent
objects.
Works applying association rules to classify mam-
mograms were also developed showing promising re-
sults. In general, these methods have two mainly
phases: association rule mining and an associative
classifier step. An associative classification is a clas-
sification that uses a set of association rules as the
learning model. For example, (Wang et al., 2004) pre-
sented an association rule method to classify mammo-
grams based on categorical items. In this method, a
record combining three features of shape and the im-
age classification is generated for each image. The
features are discretized in ten equal-sized intervals
in order to be applied to an association mining al-
gorithm. The rules are mined with the restriction of
not having a classification item in the body part. A
new image is classified according to a kind of voting
classifier, where the number of rules matched and the
confidence of the rules is employed to decide which
class the test is. A drawback of this technique is the
discretization process, which may embed inconsisten-
cies in the data, reducing the accuracy of the classifier.
In (Antonie et al., 2003), an associative classifier
was presented to classify mammograms. In the pre-
processing phase, images are cropped and enhanced
using histogram equalization. Features of mean, vari-
ance, skewness and kurtosis are extracted from the
ICEIS 2010 - 12th International Conference on Enterprise Information Systems
122
images, and together with some other descriptors (e.g.
breast position and type of tissue), compose the im-
age records that are used in the process of association
rule-mining. The rules are mined using low confi-
dence values and the classifier label is restricted, so
that it occurs only in the head of the rules. The as-
sociative classifier employed are based on the voting
strategy, i.e. the classifier counts the number of rules
that a new image satisfies and chooses its class.
In (Ribeiro et al., 2009), a method that employs
association rules in a set of discretized features of
mammogram images was proposed. The method
uses a discretized feature vector and keywords from
the image diagnosis to compose the image register.
The training image registers were submitted to an
association-rule mining algorithm, restricting the key-
words to occur only in the head of the rule. The
mined rules were submitted to an associative classi-
fier to give a score for each keyword. If the score is
greater than a given value the keyword is returned to
compose the diagnosis of the feature, otherwise the
keyword is discarded.
In (Dua et al., 2009), a method for the classifi-
cation of mammograms was presented. The method
uses a weighted association-rule based classifier.
First, the images are preprocessed and from each re-
gion of interest texture features were extracted. Sec-
ond, the features are discretized and submitted to an
association-rule algorithm. The produced rules are
employed for mammogram classification. In fact,
most works in literature require the discretization of
continuous data before applying the association rule
mining.
In this work, we propose to employ statistical as-
sociation rules to improve computer-aided diagno-
sis system without depending on discretized features.
Our method, called SACMiner, suggests a second
opinion to the radiologists. Two algorithms were de-
veloped to support the method. The first one is the
Statistical Association Rule Miner
∗
(StARMiner
∗
),
which mines rules selecting the features that best rep-
resent the images. The second algorithm is the Voting
Classifier (V-Classifier), which uses the rules mined
by the StARMiner
∗
to classify images. To validate the
proposed method, we performed experiments using
two different datasets of breast cancer, and we com-
pared SACMiner with well-known classifiers from lit-
erature. The results indicate that the statistical associ-
ation rules approach presents high-quality in the task
of diagnosing medical images.
3 PROPOSED METHOD:
SACMiner
The proposed method employs statistical association
rules to suggest diagnosis of medical images. The
method selects features that best discriminate images
into categorical classes. It avoids the discretization
step, which is necessary in most association rules al-
gorithms, reducing the complexity of the subsequent
steps of the method. Also, the method promotes an
easier comprehension of the learning model, making
it easy to understand the process of classification.
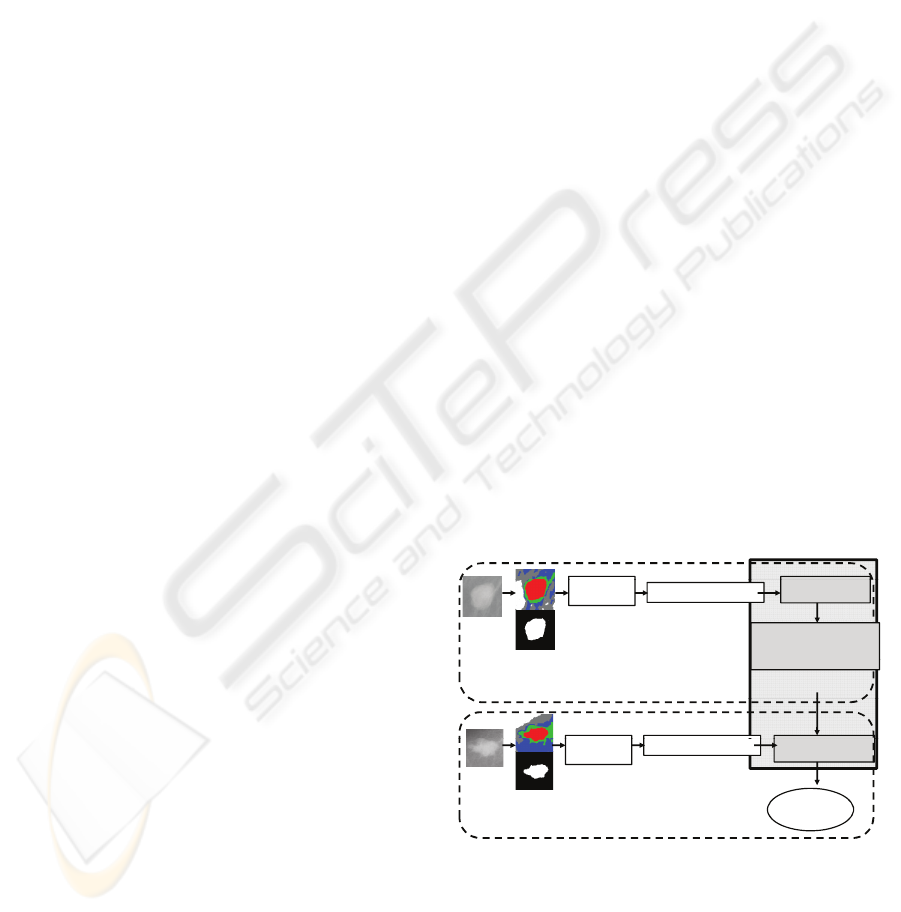
The pipeline and the algorithm of the proposed
method are presented in Figure 1 and Algorithm 1, re-
spectively. The method works in two phases: training
and test. In the first one, features are extracted from
the images and place in the correspondingfeature vec-
tors. This step includes the image pre-processing.
After that, the feature vectors are the entry for the
SACMiner method. Two algorithms were developed
to support the method: the StARMiner
∗
and the Vot-
ing classifier (V-classifier). StARMiner
∗
uses the fea-
ture vectors and the classes of the training images to
perform statistical association rule mining. It selects
the most meaningful features and produces the sta-
tistical association rules. In the test phase, the feature
vectors from the test images are extracted and submit-
ted to the V-classifier, which uses the statistical asso-
ciation rules produced by the StARMiner
∗
to suggest
a diagnosis class for the test image. We discuss each
step of the SACMiner method in the following sub-
sections.
F t
SACMINER
F
ea
t
ure
extraction
StARMiner*
I
Im1 0.13,0.28,0.24
Feature Vector
I
mages
Pre
-
Processing
C1-> 1[-0.012,0.178],
6[-0.0075,0.1825]
C2
> 2[0 2973 0 4873]
Pre
Processing
TRAINING
C2
-
> 2[0
.
2973
,
0
.
4873]
Statistical Association
Rules
F t
Classification
F
ea
t
ure
extraction
Im2 0.17,0.48,0.26
Feature Vector
Images
“Second
Opinion
”
TEST
Images
Pre-Processing
Opinion
TEST
Figure 1: Proposed method.
3.1 The StARMiner
∗
Algorithm
StARMiner
∗
is a supervised classification model
whose goal is to find statistical association rules over
the feature vectors extracted from images, providing
the attributes that best discriminate images into cate-
STATISTICAL ASSOCIATIVE CLASSIFICATION OF MAMMOGRAMS - The SACMiner Method
123
gorical classes. It returns rules relating feature inter-
vals and image classes.
Formally, let us consider x
j
an image class and
f
i
an image feature (attribute). Let V
min
and V
max
be the limit values of an interval. A rule mined by
StARMiner
∗
algorithm has the form:
f
i
[V
min
,V
max
] → x
j
(3)
An example of rule mined by StARMiner
∗
is
5[−0.07, 0.33] → benignant mass
This rule indicates that images having the 5
th
fea-
ture value in the closed interval [-0.07,0.33]tend to be
images of benignant masses. Algorithm 2 shows the
main steps of StARMiner
∗
.
To performthe association rule mining, the dataset
under analysis is scanned just once. StARMiner
∗
cal-
culates the mean and the standard deviation for each
attribute and the Z value, used in the hypotheses test.
Two restrictions of interest in the mining process must
be satisfied. The first restriction is that the feature
f
i
must have a behavior in images from class x
j
dif-
ferent from its behavior in images from the other
classes. The second restriction is that the feature f
i
must present a uniform behavior in every image from
class x
j
.
The restrictions of interest are processed in line
7. Let T be the image dataset, x
j
an image class,
T
x
j
∈ T the subset of image class x
j
, and f
i
the i
th
fea-
ture of the feature vector. Let µ
f
i
(T
x
j
) and σ
f
i
(T
x
j
) be,
respectively, the mean and the standard deviation of
feature f
i
in images from class x
j
; µ
f
i
(T − T
x
j
) and
σ
f
i
(T − T
x
j
) corresponds to, respectively, the mean
and the standard deviation of feature f
i
values of the
images that are not from class x
j
.
A rule f
i
[V
min
,V
max
] → x
j
is computed by the al-
gorithm, only if the rule satisfies the input thresholds:
∆µ
min
, σ
max
and γ
min
:
• ∆µ
min
is the minimum allowed difference between
the average of the feature f
i
in the images from
class x
j
and the remaining images in the dataset;
Algorithm 1: Steps of the proposed method.
Input: Training images, a test image
Output: Report (class of the image test).
1: Extract features of the training images
2: Execute StARMiner
∗
algorithm to mine associa-
tion rules
3: Extract features of the test image
4: Execute the Classifier
5: Return the suggested report (class)
• σ
max
is the maximum standard deviation of f
i
val-
ues allowed in the class x
j
;
• γ
min
is the minimum confidence to reject the hy-
pothesis H
0
. The hypothesis H
0
states that the
mean of f
i
values inside and outside the class x
j
are statistically equal:
H0 : µ
f
i
(T
x
j
) = µ
f
i
(T − T
x
j
). (4)
The values of V
min
and V
max
are compute as:
V
min
= µ
f
i
− σ
max
(5)
V
max
= µ
f
i
+ σ
max
(6)
StARMiner
∗
has the interesting property that the
maximum number of rules mined by a class x
j
is the
total number k of image features.
The complexity of this algorithm is Θ(ckN),
where N is the number of instances of the dataset, k is
the number of features and c is the number of classes.
StARMiner
∗
is based on the idea of the feature
selection algorithm StARMiner. The main difference
between StARMiner and StARMiner
∗
algorithms is
that the second has the advantage of mining more se-
mantically significant rules. While StARMiner only
relates classes to features that best discriminate them,
StARMiner
∗
finds rules relating class and the feature
intervals where particular behavior has occurred.
Algorithm 2: The StARMiner
∗
algorithm.
Input: Database T: table of feature vectors {x
j
, f
1
,
f
2
,..., f
n
}, where x
j
is the image class and f
i
are
the image features; thresholds ∆µ
min
, σ
max
and γ
min
.
Output: Mined rules
1: Scan database T;
2: for each class x
j
do
3: for each feature f
i
do
4: Compute µ
f
i
(T
x
j
) and µ
f
i
(T − T
x
j
);
5: Compute σ
f
i
(T
x
j
) and σ
f
i
(T − T
x
j
);
6: Compute Z value Z
ij
;
7: if (µ
f
i
(T
x
j
) − µ
f
i
(T − T
x
j
)) ≥ ∆µ
min
AND σ
f
i
(T
x
j
) ≤ σ
max
AND (Z
i
j
< Z
1
OR Z
i
j
> Z
2
) then
8: Write x
j
→ f
i
[µ
f
i
− σ
max
, µ
f
i
+ σ
max
];
9: end if
10: end for
11: if any rule is found then
12: Choose the feature f
i
which Z value is
the biggest
13: Write f
i
[µ
f
i
− σ
max
, µ
f
i
+ σ
max
] → x
j
;
14: end if
15: end for
ICEIS 2010 - 12th International Conference on Enterprise Information Systems
124
3.2 The Proposed Classifier
We develop a classifier that uses the mined rules by
StARMiner
∗
. The main idea is counting ‘votes’. For
each class, we count the number of rules that are sat-
isfied. This counting is normalized by the number of
rules of the class. The output is the class that obtain
more votes. Algorithm 3 shows the algorithm of the
V-Classifier method.
Algorithm 3: The V-classifier.
Input: Mined Rules in the form f
i
[µ
f
i
− σ
max
, µ
f
i
+
σ
max
] → x
j
, and a feature vector g from a test im-
age, where g
i
are the features
Output: Report (class of the image test).
1: for each class x
j
do
2: vote
x
j
=0;
3: for each feature f
i
do
4: if g
i
is in [µ
f
i
− σ
max
, µ
f
i
+ σ
max
] then
5: vote
x
j
= vote
x
j
+ 1;
6: end if
7: end for
8: Divide vote
x
j
by number of rules of the
class x
j
;
9: end for
10: Return the class of max(vote
x
j
).
We can observe that the computational cost of
SACMiner is low, since StARMiner
∗
is linear on the
number of images (dataset items) and the V-Classifier
is linear on the number of rules. The low computa-
tional cost of the method is stressed by the fact that
StARMiner
∗
has the property that the maximum num-
ber of rules mined by a class x
j
is the total number k
of image features.
4 EXPERIMENTS
We performed several experiments to validate the
SACMiner method. Here, we present two of them
in the task of suggesting diagnosis for Regions Of
Interest (ROIs) of mammograms, considering benig-
nant and malignant masses. We use two different ap-
proaches. In the first one, the experiments were per-
formed using the holdout approach, in which we em-
ployed 25% of the images from the datasets for test-
ing and the remaining images for training. The second
approach was the leave-one-out.
To show the efficacy of this method, we compare it
with well knownclassifiers: 1-NN, C4.5, Naive Bayes
and 1R. The 1-nearest neighbor (1-NN) is a classifier
that uses the class label of the nearest neighbor to clas-
sify a new instance, using the Euclidean distance. The
C4.5 (Quinlan, 1993) is a classifier that builds a de-
cision tree in the training phase. The Naive Bayes
(Domingos and Pazzani, 1997) is a classifier that uses
a probabilistic approach based on the Bayes theorem
to predict the class labels. And finally, the last one, 1R
(Holte, 1993), is a classifier based on rules that clas-
sify an object/image on the basis of a single attribute
(they are 1-level decision trees); it involves discrete
attributes.
To compare the classifiers, we compute measures
of accuracy, sensitivity and specificity. The accuracy
is the portion of cases of the test dataset that were
correctly classified. The sensitivity is the portion of
the positive cases that were correctly classified. And
the specificity is the portion of the negative cases that
were correctly classified. An optimal prediction can
achieve 100% sensitivity (i.e. predict all images from
the malignant group as malignant) and 100% speci-
ficity (i.e. not predict any image from the benignant
class as malignant). To compute these measures, let
us considering the following cases:
• True positive: malignant masses correctly diag-
nosed as malignant;
• False positive: benignant masses incorrectly iden-
tified as malignant;
• True negative: benignant masses correctly identi-
fied as benignant;
• False negative: malignant masses incorrectly
identified as benignant.
Let the number of true positives be TP, the number
of false positive be FP, the number of true negative be
TN and the number of false negative be FN. Equations
7, 8 and 9 present the formula of accuracy, sensitivity
and specificity, respectively.
accuracy =
TP+ TN
TP+ TN + FP+ FN
(7)
sensitivity =
TP
TP+ FN
(8)
specificity =
TN
TN + FP
(9)
Experiment 1: the 250 ROIs Dataset. This dataset
consists of 250 ROIs taken from mammograms col-
lected from the Digital Database for Screening Mam-
mography - DDSM dataset
1
. The dataset is composed
of 99 benignant and 151 malignant mass images.
1
http://marathon.csee.usf.edu/Mammography/Database
.html
STATISTICAL ASSOCIATIVE CLASSIFICATION OF MAMMOGRAMS - The SACMiner Method
125
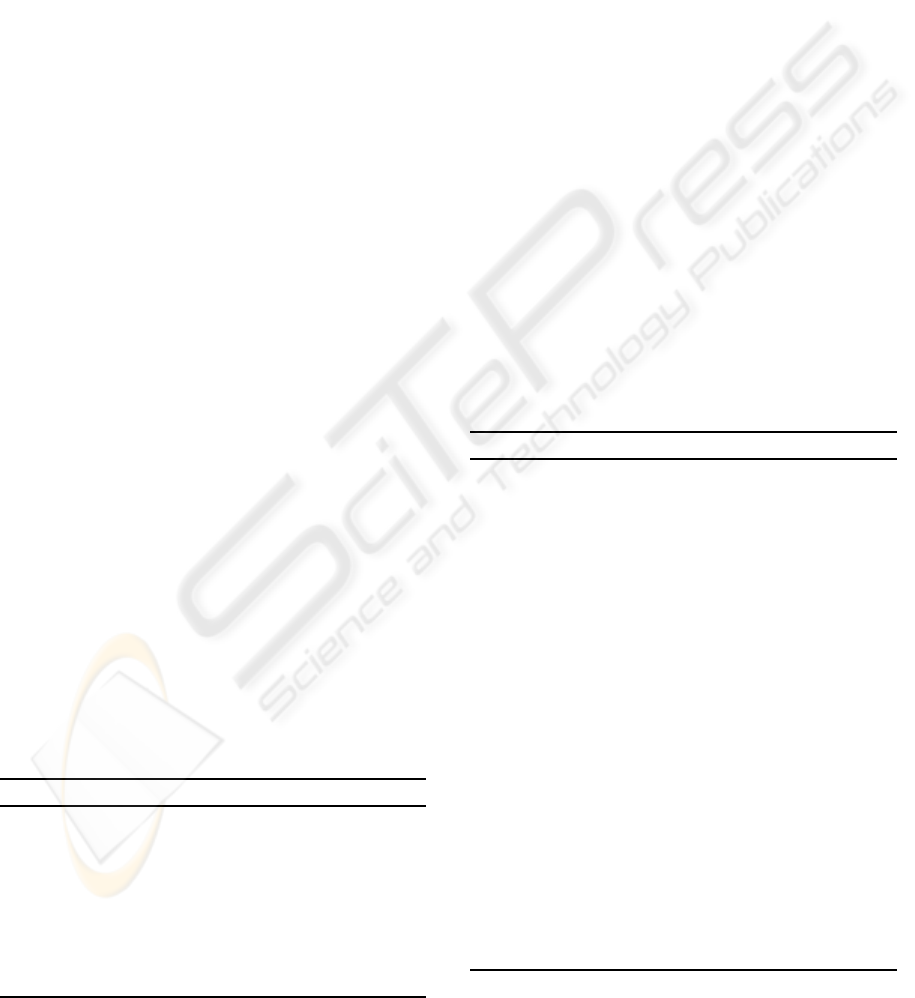
(a) (b) (c)
Figure 2: (a) Original image. (b) Image segmented in 5
regions. (c) Mask of the main region.
In the image pre-processing step, the images were
segmented using an improved EM/MPM algorithm
proposed in (Balan et al., 2005). This algorithm seg-
ments the images using a technique that combines a
Markov Random Field and a Gaussian Mixture Model
to obtain a texture-based segmentation. The segmen-
tation of images are accomplished accordingto a fixed
number of different texture regions. In this experi-
ment, we segmented the images in five regions. After
the segmentation step, the main region is chosen for
the feature extraction. This choice is based on the vi-
sual characteristics that all these ROIs are centered.
Hence, our algorithm uses the centroid of the image
to choose the main region. The Figure 2 illustrates the
pre-processing step.
For the segmented region, eleven features based
on the shape are extracted: area, major axis length,
minor axis length, eccentricity, orientation, convex
area, filled area, Euler number, solidity, extent and
perimeter. It is important to highlight that the feature
vector generated is quite compact.
In step 2, the feature vectors from the training im-
ages set were submitted to StARMiner
∗
to mine sta-
tistical association rules. This algorithm mined the
following rules:
A[−0.0120, 0.1770] → Benignant (10)
C[− 0.0075, 0.1825] → Benignant (11)
F[−0.0133, 0.1767] → Benignant (12)
L[0.2973, 0.4873] → Malignant (13)
In these rules, A represents the feature of tu-
mor mass area; C, the convex area feature; F, the
filled area feature; and L, the major axis length fea-
ture. These rules mean that masses whose area are
in the interval [-0.0120,0.1770], convex area in [-
0.0075,0.1825] and filled area in [-0.0133,0.1767]
tend to be benignant. On the other hand, masses
whose major axis length is in [0.2973,0.4873] tend to
be malignant. For this experiment, we considered an
confidence level of 90% to the Z-test and to compute
the intervals of rules.
The four mined rules and the feature vectors of
the test images were introduced to the classifier. The
results using the holdout and the leave-one-out ap-
proaches are shown in the Tables 1 and 2, respec-
tively.
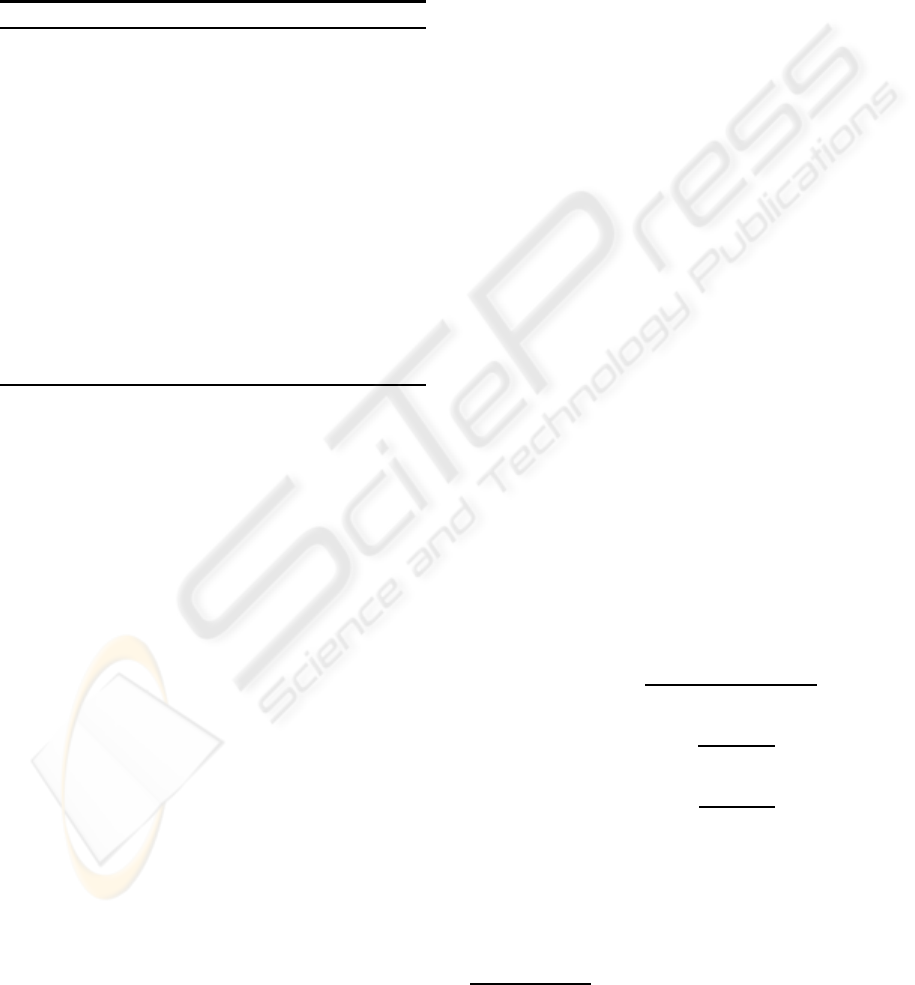
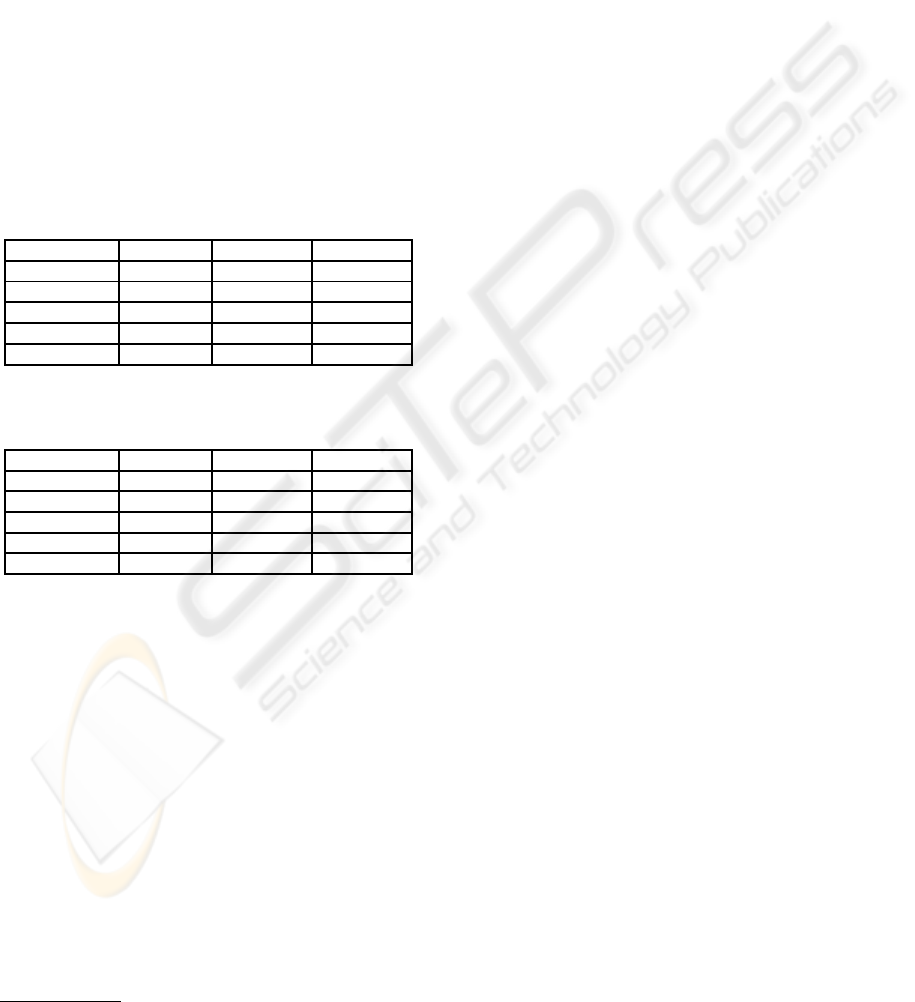
Table 1: Comparison between SACMiner and other well-
known classifiers using the holdout approach.
Classifiers Accuracy Sensitivity Specificity
SACMiner 0.8548 0.8461 0.8611
1R 0.7258 0.8260 0.6666
Naive Bayes 0.6290 0.9130 0.4615
C4.5 0.7585 0.7391 0.7692
1-NN 0.6129 0.6521 0.5897
Table 2: Comparison among SACMiner and other well-
known classifiers using the leave-one-out approach.
Classifiers Accuracy Sensitivity Specificity
SACMiner 0.7680 0.7788 0.7603
1R 0.7680 0.7885 0.7534
Naive Bayes 0.7360 0.8750 0.6370
C4.5 0.7440 0.6154 0.8356
1-NN 0.6760 0.6154 0.7192
Analyzing Table 1, we observe that SACMiner
presented the highest values of accuracy and speci-
ficity in the holdout approach. When we analyze the
sensitivity, we can note that Naive Bayes obtained
the best result. However, when we analyze it with
its specificity, we observe that Naive Bayes has a low
power to classify the benignant images.
In Table 2, SACMiner leaded to the highest value
of accuracy together to the 1R Classifier. In this case,
the association rule approach is the best one to clas-
sify masses. One advantage of SACMiner over 1R is
that SACMiner does not demands the data discretiza-
tion step. Besides, SACMiner produced just four
rules, while 1R produced eight. All the rules mined
by 1R were from the feature major axis length (L),
the second attribute of the feature vector, and they are
describe as:
if L < 0.1840 then Benignant (14)
else if L < 0.2181 then Malignant (15)
else if L < 0.2367 then Benignant (16)
else if L < 0.2572 then Malignant (17)
else if L < 0.2716 then Benignant (18)
else if L < 0.3126 then Malignant (19)
else if L < 0.3424 then Benignant (20)
else if L ≥ 0.3424 then Malignant. (21)
Experiment 2: the 569 ROIs Dataset. This dataset
consists of 569 feature vectors obtained from the UCI
ICEIS 2010 - 12th International Conference on Enterprise Information Systems
126
Machine Learning Repository (Asuncion and New-
man, 2007)
2
. These features describe characteristics
of the cell nuclei present in the image. Features were
computed from breast masses and they are classified
in benignant and malignant masses. For each of the
three cell nucleus, the following ten features were
computed: mean of distances from center to points
on the perimeter, standard deviation of gray-scale val-
ues, perimeter, area, smoothness, compactness, con-
cavity, concave points, symmetry and fractal dimen-
sion. Thus, the feature vectors have 30 features, and
the classes are distributed in 357 benignant and 212
malignant.
In the step 2, StARMiner
∗
mined 19 rules for each
class. The results using the holdout and the leave-
one-out approaches are shown in Tables 3 and 2 4,
respectively.
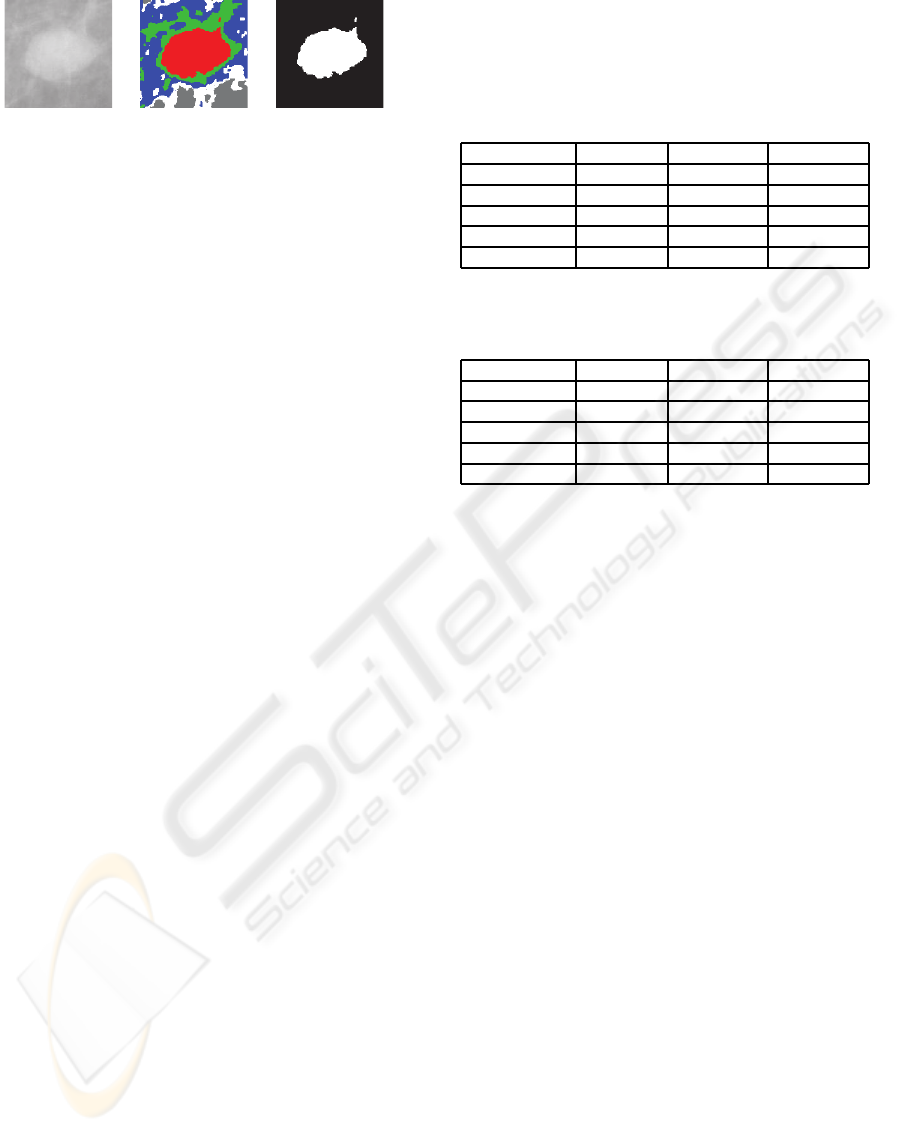
Table 3: Comparison etween SACMiner and other well-
known classifiers using the holdout approach.
Classifiers Accuracy Sensitivity Specificity
SACMiner 0.9859 0.9888 0.9811
1R 0.8943 0.9186 0.8571
Naive Bayes 0.9155 0.9186 0.9107
C4.5 0.9295 0.9419 0.9107
1-NN 0.9577 0.9767 0.9286
Table 4: Comparison between SACMiner and other well-
known classifiers using the leave-one-out approach.
Classifiers Accuracy Sensitivity Specificity
SACMiner 0.9525 0.9860 0.8962
1R 0.9015 0.9356 0.8443
Naive Bayes 0.9349 0.9580 0.8962
C4.5 0.9384 0.9524 0.9151
1-NN 0.9525 0.9580 0.9434
When we analyze the results using the holdout ap-
proach in Table 3, we can note that SACMiner leads
the highest values of accuracy, sensitivity and speci-
ficity. Thus, when we consider the results using the
leave-one-out approach, we also observe that the ac-
curacy measure is one of the highest, presenting the
same result that 1-NN, and leads the value of sensi-
tivity.
5 CONCLUSIONS
In this paper we proposed SACMiner, a new method
that employs statistical association rules to support
computer-aided diagnosis for breast cancer. The re-
sults of using real datasets show that the proposed
method achieves the highest values of accuracy, when
2
http://archive.ics.uci.edu/ml/datasets.html
compared with other well-known classifiers (1-R,
Naive Bayes, C4.5 and 1-NN). Moreover, the method
shows a proper balance between sensitivity and speci-
ficity, being a little bit more specific than sensitive,
what is desirable in the medical domain, since it is
more accurate to spot the true positives. Two new
algorithms were developed to support the method,
StARMiner
∗
and V-Classifier. StARMiner
∗
does not
demands the discretization step and generates a com-
pact set of rules to compose the learning model of
SACMiner. Moreover, the computational cost is low
(linear on the number of dataset items). V-classifier
is an associative classifier that works based on the
idea of classes votes. The experiments showed that
the SACMiner method produces high values of ac-
curacy, sensitivity and specificity when compared to
other traditional classifiers. In addition, SACMiner
produces rules that allow the comprehension of the
learning process, and consequently, it makes the sys-
tem more reliable to be used by the radiologists, since
they can understand the whole process of classifica-
tion.
ACKNOWLEDGEMENTS
We are thankful to CNPq, CAPES, FAPESP, Univer-
sity of S˜ao Paulo and Federal University of Rondˆonia
for the financial support.
REFERENCES
Agrawal, R., Imielinski, T., and Swami, A. N. (1993). Min-
ing association rules between sets of items in large
databases. In Proceedings of the 1993 ACM SIGMOD
ICMD, pages 207–216, Washington, D.C.
Antonie, M.-L., Zaane, O. R., and Coman, A. (2003). Asso-
ciative classifiers for medical images. In LNAI 2797,
MMCD, pages 68–83. Springer-Verlag.
Asuncion, A. and Newman, D. (2007). ”UCI machine learn-
ing repository”.
Aumann, Y. and Lindell, Y. (1999). A statistical theory
for quantitative association rules. In Press, A., edi-
tor, The fifth ACM SIGKDD international conference
on Knowledge discovery and data mining, pages 261–
270, San Diego, California, United States.
Balan, A. G. R., Traina, A. J. M., Traina Jr., C., and Mar-
ques, P. M. d. A. (2005). Fractal analysis of im-
age textures for indexing and retrieval by content. In
18th IEEE Intl. Symposium on Computer-Based Med-
ical Systems - CBMS, pages 581–586, Dublin, Ireland.
IEEE Computer Society.
Domingos, P. and Pazzani, M. (1997). On the optimality
of the simple Bayesian classifier under zero-one loss.
Machine Learning, 29(2-3):103–130.
STATISTICAL ASSOCIATIVE CLASSIFICATION OF MAMMOGRAMS - The SACMiner Method
127

Dua, S., Singh, H., and Thompson, H. W. (2009). Asso-
ciative classification of mammograms using weighted
rules. Expert Syst. Appl., 36(5).
Holte, R. C. (1993). Very simple classification rules per-
form well on most commonly used datasets. Machine
Learning, 11:63–91.
Ordonez, C. and Omiecinski, E. (1999). Discovering asso-
ciation rules based on image content. In IEEE Forum
on Research and Technology Advances in Digital Li-
braries (ADL ’99), pages 38 – 49, Baltimore, USA.
Quinlan, R. (1993). C4.5: Programs for Machine Learning.
San Mateo, CA. Morgan Kaufmann.
Ribeiro, M. X., Balan, A. G. R., Felipe, J. C., Traina, A.
J. M., and Traina Jr., C. (2005). Mining Statistical As-
sociation Rules to Select the Most Relevant Medical
Image Features. In First International Workshop on
Mining Complex Data (IEEE MCD’05), pages 91–98,
Houston, USA. IEEE Computer Society.
Ribeiro, M. X., Bugatti, P. H., Traina, A. J. M., Traina Jr.,
C., Marques, P. M. A., and Rosa, N. A. (2009). Sup-
porting content-based image retrieval and computer-
aided diagnosis systems with association rule-based
techniques. Data & Knowledge Engineering.
Srikant, R. and Agrawal, R. (1996). Mining quantitative
association rules in large relational tables. In ACM
SIGMOD International Conference on Management
of Data, pages 1–12, Montreal, Canada. ACM Press.
Wang, X., Smith, M., and Rangayyan, R. (2004). Mammo-
graphic information analysis through association-rule
mining. In IEEE CCGEI, pages 1495–1498.
ICEIS 2010 - 12th International Conference on Enterprise Information Systems
128
