
FINDING AND CLASSIFYING PRODUCT RELATIONSHIPS USING
INFORMATION FROM THE PUBLIC WEB
Daniel Schuster
1
, Till M. Juchheim
2
and Alexander Schill
1
1
Computer Networks Group, Technische Universit
¨
at Dresden, Helmholtzstr. 10, 01062 Dresden, Germany
2
Facultad de Informatica, Universidad Politecnica de Madrid
Campus de Montegancedo, 28660 Boadilla del Monte, Madrid, Spain
Keywords:
Product information systems, Web information extraction, Product relationships, Semantic relatedness, Clas-
sification and clustering.
Abstract:
Relationships between products such as accessory or successor products are hard to find on the Web or have
to be inserted manually in product information systems. Finding and classifying such relations automatically
using information from the public Web only offers great value for customers and vendors as it helps to improve
the buying process at low cost. We present and evaluate algorithms and methods for product relationship
extraction on the Web requiring only a set of clustered product names as input. The solution can be easily
implemented in different product information systems most useful in but not necessarily restricted to the
application domain of online shopping.
1 INTRODUCTION
Interaction with other products is often an essential
part in a product’s existence, since such product re-
lationships may influence the actions of producers,
vendors but mostly customers. Common examples
for such relations are two products competing for the
same market segment or products that complement
each other (a main product and an accessory). Hav-
ing knowledge about the existence of these relations
enables a customer to change his shopping behavior
in order to get the best deal for himself, could trigger
producers to draw more attraction to one of their prod-
ucts or may help vendors to have a better overview on
a market segment in order to properly assemble their
offers.
Today, such relations are either mined manually
using expert knowledge or depend on shopping his-
tories such as ”frequently bought together” or ”What
do customers ultimately buy after viewing this item?”
(examples from amazon.com). But in many prod-
uct information systems (especially in federated PIS),
this information is often not available. Furthermore,
shopping histories are not able to identify all possi-
ble product relationship nor is it possible to correctly
classify connections. All the information necessary
to find and classify such relations is available on the
Web, but distributed along different websites and of-
ten unstructured (e.g., a newspaper article about Win-
dows 7 being the successor of Windows Vista).
This leads to the following research question: Is
it possible to find and classify connections between
products in an automated, efficient way, relying on
information from the public Web only? The term
efficient implies that we do not want to check each
available product pair for a possible relationship, as
this causes a quadratic growth of tests with a growing
number of products. Thus we have to find a method
that has only linear or even logarithmic complexity.
This paper contributes detailed algorithms to find
product relationships efficiently using only groups of
product names as input (Section 4). The approach
uses semantic relatedness of products as well as key-
word similarity of product descriptions as useful indi-
cators of product relationships. Furthermore, in Sec-
tion 5 we provide a methodology to classify these
connections using a combination of neural network
and decision trees. The evaluation in Section 6 shows
the feasibility of our approach.
2 RELATED WORK
Finding and classifying product relationships is an
important research topic with many promising appli-
300
Schuster D., M. Juchheim T. and Schill A. (2010).
FINDING AND CLASSIFYING PRODUCT RELATIONSHIPS USING INFORMATION FROM THE PUBLIC WEB.
In Proceedings of the 12th International Conference on Enterprise Information Systems - Databases and Information Systems Integration, pages
300-309
DOI: 10.5220/0002973603000309
Copyright
c
SciTePress

cation scenarios. Up to our best knowledge, no cur-
rent system is however able to automatically discover
and describe product relationships as proposed in this
paper.
A well known related area are recommender sys-
tems that are nowadays commonly found in all large
online shops such as Amazon or Buy.com. A de-
cent overview on the state of the art in this field can
be found in (Adomavicius and A., 2005). The au-
thors interpret recommender systems as a way to help
customers deal with the information overload caused
by modern information technology. Other sources
like (Han and Karypis, 2005) show that deploying a
decent reommender system may directly result in a
commercial gain. Traditionally these systems mainly
fall into the two categories Content-Based-Filtering
(CBF) or Collaborative Filtering (CF).
CBF suggests items from different categories
based upon the similarity of the currently viewed
item X to each item category (van Meteren and van
Someren M., 2000). Such systems requires an item-
to-category similarity matrix which is usually built by
analyzing items’ textual descriptions. CF or people-
to-people correlation (Schafer et al., 1999) recom-
mends items to users based on what other people with
similar interests found interesting, so it does not di-
rectly relate products but people. Besides these two
approaches there exist many systems that try to com-
bine them like Amazon’s modern appraoch in (Lin-
den et al., 2003) or (Shen et al., 2007) where the user
provides an initial scenario which is then matched to
previous choices of other users. These systems have
in common that, in the eyes of a user, they appear to
relate products to each other. In contrast to our system
this relation is however not based on relevance seman-
tics (Product A is relevant to Product B) but shopping
behaviour and does not further explain the relation-
ships, either.
Another class of interesting systems are Product
Comparison Agents (PCA), online applications that
retrieve, process and re-format product information to
aid a customer’s decision making process (Wan et al.,
2007). A prime example is CNetShopper.com (CBS
interactive, 2010) where a product is related to similar
ones and popular accessories. The website also offers
a detailed comparison tool that relates products on the
level of features. A shortcomming of most PCA sys-
tems is however that they do not gather data automat-
ically from independent sources but rely on manually
tagged data sources.
A different type of product comparison is done
by (Liu et al., 2005) and (Kawamura et al., 2008).
Both systems extract customer opinions on products’
features and then compare products to each other,
based on these opinions, feature by feature. While the
first system extracts from rather well known sources
such as CNet reviews, the second one is able to ex-
tract opinions from random blogs, a characteristic that
makes it very powerful and interesting for this work.
A rather new subfield of Information Extrac-
tion (IE) is Relationship Extraction (RE) (Bach and
Badaskar, 2007), whose task is to extract related en-
tities from documents and eventually also specify the
relationship that holds between them. The TextRun-
ner system (Banko and Etzioni, 2008) with its un-
derlying theory is a famous example of state of the
art work in that area. It uses two input terms and
searches large document collections in order to ex-
tract text pieces that relate the terms. Up to now
the system does not interpret its results semantically.
In (Schutz and Buitelaar, 2005) the authors present an
interesting system that searches documents from soc-
cer game news tickers in order to extract relationship
triples containing two concept terms and the relation
between them. Both systems are very unique and in-
teresting but do not yet provide enough foundation for
the task of this work, as they either are incapable of
semantic interpretation of relations or are too fixed on
a special domain and therefore bound to a specific tex-
tual representation of relationship facts.
3 MAIN CONCEPT
Our concept for relationship classification consists of
the three main steps of
1. Setting up a hierarchically clustered product tree,
2. Dicovering connections between these products,
3. Classifying the product relationships found in
step 2.
The rationale behind the first step is to limit the
number of necessary comparison operations by ex-
ploiting relatedness of products. It is though very un-
likely to find any connection between a digital cam-
era and stilettos so it does make sense to cluster
products before finding relationships between them.
This can be done either using an existing hierarchi-
cal classification like the Amazon catalogue classifi-
cation or without any dependency on external classi-
fication schemes using k-means clustering. The latter
approach was used for the prototype implementation
shown in Section 6. We describe this method in a sep-
arate companion paper.
In this paper we focus on steps 2 and 3, i.e., con-
nection discovery and classification. These steps do
not depend on how the hierarchical clusters where
built in step 1. Thus we only assume to already have a
FINDING AND CLASSIFYING PRODUCT RELATIONSHIPS USING INFORMATION FROM THE PUBLIC WEB
301

hierarchically clustered network of products (product
name, producer name and price) as a starting point.
Producer name and price are only needed for connec-
tion classification, so product names are sufficient to
find the product links in the first place.
4 CONNECTION DISCOVERY
The central question to be asked for discovering con-
nections between products is where and how do prod-
uct relationships usually occur? Many related prod-
ucts tend to be quite similar such as they might both
be phones with similar features, music from the same
band, or clothes of similar style. Other product re-
lationships occur between products that complement
each other such as batteries for a phone, lenses for a
camera, or pants that fit with a set of shirts.
We transfer this model to a two-staged approach
for connection discovery. In the first stage we try
to identify the primary link structure between simi-
lar products in the clusters as mentioned before. In
the second stage we use these connections to discover
secondary links crossing the boundaries of the clus-
ters.
4.1 Primary Link Structure
To detect the primary link structure, there are two
main tasks to be solved: A heuristics to select the
most promising relationship candidates for each prod-
uct from the product network and a test to measure the
relevance of a connection between two products.
As can be seen in Algorithm 1, we first try to find
relevant groups on the same level in the tree as the
group R the actual product p belongs to. We pick
all these candidate groups and test a random sam-
ple of products from each group against a sample of
products from R to check for group similarity (line
9). If the average similarity of the sample products
passes the threshold t, the group is added to the rele-
vant groups H (lines 10-12). Finally, all products in
all groups of H are tested for similarity again to fur-
ther reduce the candidate set (lines 14-18). Only those
products that again pass the threshold t make it to the
next stage. At the end, each remaining candidate is
extensively checked against product p to examine the
actual product relationships (lines 19-21).
The algorithm mentions two testing functions
similarityTest(x, y) and relationTest(x,y). The for-
mer is an easy-to-compute function giving a first but
not at all sufficient indication of product relation-
ships. The second function relationTest involves
calls to Web search engine APIs and is very reliable
but time-consuming. Our main idea is thus to use
similarityTest to reduce the number of candidates and
finally use the more reliable relationTest only on this
smaller set. We describe both algorithms in detail
starting with similarityTest (Algorithm 2).
Algorithm 1: Detecting primary link structure.
1: p = product to test;
2: R = leaf group p belongs to;
3: relevant products P = {};
4: relevant groups H = {R};
5: t = similarity threshold;
6: Pick n representative products R
0
from R;
7: for all groups S
i
on lowest tree level do
8: Pick n representative products S
0
i
from S
i
;
9: l
i
= average similarityTest(R
0
,S
0
i
);
10: if l
i
> t then
11: add G
i
to H;
12: end if
13: end for
14: for all products c
i
in H do
15: if similarityTest(p,c
i
) > t then
16: add c
i
to P;
17: end if
18: end for
19: for all candidate products d
i
in P do
20: relationTest(p,d
i
);
21: end for
Algorithm 2 : Testing product similarity (similari-
tyTest).
1: if Index
re f
= [] then
2: Create reference word index Index
re f
by Web
random sampling;
3: end if
4: if Index
a
= [] then
5: Retrieve document set Docs
a
describing prod-
uct a from the Web;
6: for all words word
i
in Docs
a
do
7: Index
a
[word
i
] =
f requency(word
i
,Docs
a
)
Index
re f
[word
i
]
8: end for
9: end if
10: if Index
b
= [] then
11: Retrieve document set Docs
b
describing prod-
uct b from the Web;
12: for all words word
i
in Docs
b
do
13: Index
b
[word
i
] =
f requency(word
i
,Docs
b
)
Index
re f
[word
i
]
14: end for
15: end if
16: K
a
= top m keywords of Index
a
;
17: K
b
= top m keywords of Index
b
;
18: return
1
m
·
|
K
a
∩ K
b
|
;
Algorithm 2 is based on the idea of content sim-
ICEIS 2010 - 12th International Conference on Enterprise Information Systems
302

ilarity, or more precisely, the non-weighted keyword
similarity of two collections of web pages describing
the two products to compare. The keyword indexes
have to be computed only once per product, i.e., when
the product network is initialized at the beginning or
when a new product is added to the network. Once
the indexes are built, only lines 16 to 18 have to be
processed to test the similarity of two products.
A reference index Index
re f
is needed to weigh the
keywords in analogy to the TF-IDF measure (Singhal
et al., 1996). This index is built using a Web random
sampling tool like NLSampler (Schuster and Schill,
2007) and by building up a generic text index like
Lucene (Apache Foundation, 2009). The index holds
the occurence frequency for each word that appears in
the collected documents. This task is only executed
once when a product relationship network is created,
at the very beginning.
The indexes Index
a
and Index
b
for products a and
b are built using a sample of pages describing the re-
spective product (lines 5 and 13). This sample is not
chosen randomly but selected with the help of a web
search index like Yahoo! Search. Our method uses a
product’s name as the search query and then retrieves
the top n ranked documents. A number of n = 50
has shown to be an adequate sample size concerning
method quality and performance. The index vectors
Index
a
and Index
b
do not contain absolute frequency
values. The frequency for each word is divided by
the frequency of word word
i
in the reference index
(lines 7 and 13). The actual comparison in lines 16 to
18 defines two sets of keywords K
a
and K
b
each with
the top m keywords of the product indices. As result
of similarityTest(a,b), the number of keywords oc-
curing in both sets divided by the total number m of
keywords in each of the sets is returned. This results
in a number between 0 and 1 indicating the level of
keyword similarity between products a and b.
The function relationTest(x, y) performs a num-
ber of different tests as can be seen in Algorithm 3.
It is modeled after the idea of semantic relatedness
and combines this measure with the similarity. The
method requires a search engine API like Yahoo!
Search Boss (Yahoo! Inc., 2010). It gathers the num-
ber of total hits of search requests for each of the in-
dividual product names (lines 1 and 2), as well as the
number of their common hits (line 3). The seman-
tic relatedness d
rel
is then calculated as the fraction
of the number of documents where both products oc-
cur and the minimum number of total documents with
one of the products. If two products are unrelated,
it is very unlikely that they are discussed together in
many web documents, thus d
rel
will be very small.
However, if they are in fact related the product names
will occur together more frequently which will natu-
rally result in a larger semantic relatedness. At the end
of relationTest, d
rel
is combined with similarityTest
using arithmetic mean. The resulting number w
link
refers to the link weight of the connection between
both products. The principle ideas is, that two re-
lated products will show a high semantic relatedness,
or a high similarity, or even both. The system holds a
threshold value t
linkweight
, which defines the minimum
weight a relationship must have to be considered rel-
evant. By increasing the threshold t
linkweight
, we can
increase the recall of the system (finding more links)
but meanwhile decreasing the precision (finding more
false connections).
4.2 Secondary Link Structure
Creating the secondary link structure is the second
big part of the link discovery. Our approach for de-
tecting primary links relies on group similarity and
works quite well to identify groups of highly simi-
lar products and their neighbors but it fails in find-
ing non-similar but related groups like mobile phones
and their batteries. We could discover connections be-
tween such products using relationTest (Algorithm 3)
between each pair of products but this is very time-
consuming and should be carried out only on a re-
duced set of promising candidates.
Algorithm 3 : Testing product connections (relation-
Test).
1: a = number of search index hits for product x;
2: b = number of search index hits for product y;
3: s = number of search index hits for ”x AND y”;
4: d
rel
=
s
min(a,b)
;
5: w
link
= 0.5 · (similarityTest(x,y) + d
rel
);
6: if w
link
> t
linkweight
then
7: return true;
8: end if
9: return false;
The main idea of determining secondary link
structure is to use the network from the primary link
detection and test for transitivity relations. Thus, if a
product A links to product B and product B links to
product C there is a high probability of finding a di-
rect connection between A and C. As can be seen in
Figure 1, this is done using a tree search.
The algorithm is formally described in Algo-
rithm 4. It keeps a list l
open
of all nodes (products)
that still need to be examined and a closed list l
closed
to remember all products that have already been ex-
amined. Additionally, the method also keeps a candi-
date list l
candidate
. In this list it stores all potential in-
FINDING AND CLASSIFYING PRODUCT RELATIONSHIPS USING INFORMATION FROM THE PUBLIC WEB
303

Figure 1: Discovering secondary links.
direct connections that were encountered on the way.
The fourth list l
connected
is only used temporarily to
identify all nodes connected to the node currently pro-
cessed.
In each iteration, the algorithm picks the first item
from l
open
until it is empty (lines 7 and 8). The
similitarityTest mentioned above is used again to
check for a potential connection from the input prod-
uct to the current item from l
open
(line 9). If it passes
the test, its children not yet visited before are added to
the open list l
open
(lines 13-17). The closed list l
closed
is updated in lines 10 and 19 to keep track of all nodes
already visited.
All nodes that reached the temporary open list
l
open
also make it to the permanent candidate list
l
candidate
(line 11). These nodes are finally tested
against the product p (lines 22-26) to find secondary
connections using the time-consuming relationTest
as described in Algorithm 3.
Algorithm 4 is a very effective approach to dis-
cover relevant but hard to find relationships. It has
clear advantages over na
¨
ıve solutions such as increas-
ing the amount of candidates for the primary link
tests. It is quite easy to implement and if implemented
with care does not cause much additional computa-
tion.
4.3 Improving Discovery Rates
One potential problem of the algorithms presented
above is that certain very rare relationships might
never be discovered. This results from the way the
primary and secondary link structures interact. If a
product does not get connected to anything else within
the primary link structure the second step will not be
able to discover any distant but relevant connections
for it either. Hence, if a product does not get linked
into the primary link structure it will never be linked
to anything. Therefore a modification of the algo-
rithms can be used to try to link each product first to
at least one product before starting with Algorithm 4.
This attempt to improve the recall intentionally
lowers the threshold t
linkweight
in Algorithm 3 step
by step, thus accepting a number of irrelevant con-
nections that may lead to relevant connections using
Algorithm 4 afterwards. Later, all found connections
may be tested with Algorithm 3 again (but this time
with a proper value for t
linkweight
) to filter out irrele-
vant connections. This may lead to a strong improve-
ment of the quality of the link detection at the price
of additional computation. When implementing the
approach described here one should thus optionally
decide to use this pre- and post-processing and vary
the threshold parameters according to the concrete re-
quirements.
Algorithm 4: Discovering secondary connections.
1: p = input product;
2: t = similarity threshold;
3: list l
open
=all primary connections of p;
4: list l
closed
= [];
5: list l
candidate
= [];
6: list l
connected
= [];
7: while l
open
6= [] do
8: node
0
= l
open
[0];
9: if similarityTest(p,node
0
) > t then
10: add node
0
to l
closed
;
11: add node
0
to l
candidate
;
12: l
connected
= all products connected to node
0
;
13: for all candidates c
i
in l
connected
do
14: if c
i
/∈ l
closed
∧ c
i
/∈ l
open
then
15: add c
i
to l
open
;
16: end if
17: end for
18: else
19: add node
0
to l
closed
;
20: end if
21: end while
22: for all candidates c
i
in l
candidate
do
23: if relationTest(p,c
i
) then
24: create link p −→ c
i
;
25: end if
26: end for
5 CONNECTION
CLASSIFICATION
While the previous section explained methods for dis-
covering and creating connections between products
this section deals with the semantics of product rela-
tionships. A connection can have such diverse seman-
tics as successor or incompatible product. Thus, the
semantics is an essential part of the product relation-
ship network as the user may ask different questions
such as ”Is there a successor of product A?”, ”What
types of accessory products are available for product
B?”. Before we define a method for classifying con-
ICEIS 2010 - 12th International Conference on Enterprise Information Systems
304
nections, we first define the types of connections we
want to distinguish.
5.1 Product Meta Relationships
We call these connection types meta relationships as
they are rather general and occur in nearly all poten-
tial product domains. Unfortunately, there is only lit-
tle reference as to how product relationships can be
described. Online shops often use marketing terms
like cross-sells or up-sells, while other systems use
domain-specific connection types. As can be seen
in Figure 2, a product connection can be first clas-
sified to be one of the main types alternative prod-
uct or complementary product. We further divide the
class of alternative products to be either competitor
products, competing for the same market segment or
successor/predecessor products of the same producer.
Complementary products may be of the type acces-
sory or incompatible products.
Product A Product B
ComplementaryAlternative
Competitor
Successor /
Predecessor
Accessory
Incompatible
Figure 2: Product meta relationship structure.
5.2 Classification Criteria
The classification concept requires a number of tests
to be executed in order to decide for the correct meta
relationship of a connection. Thus we define the fol-
lowing tests:
Product Name, Price, Similarity. The first crierion
used for connection classification is the product name.
In some cases the names of the involved products al-
ready indicate a lot about their relationship. One ex-
ample for this is the product name ”premium messen-
ger bag carrying case for Nintendo Wii console” as
it occured in the product training set used for devel-
oping the algorithms and methods described in this
paper. The relationship between the two products is
already identified and actually even completely ex-
plained in the name of this product. Such patterns
occur frequently in different product domains and can
be used as one feature for connection classification.
The next important information to classify a prod-
uct link is the price of the two products. If the meth-
ods described here are used in online shops, the price
is already part of the input product set. Thus we as-
sume the price to be available as an input parameter.
Gathering average prices from the Web is difficult as
there are a lot of advertisements and identification of
the correct product is often error-prone.
Additionally, the item similarity as calculated in
Algorithm 2 can be used as a feature for the classifi-
cation.
Date of Market Entry. Another remarkable attribute
of a product is the date a product was introduced to the
market. It is especially important for classification of
the successor and predecessor relationships. Natural
language pre-processing (e.g., using LingPipe (Alias-
I, 2009)) allows to extract years from texts quite re-
liably. We use this functionality to build an index of
years from product documents similar to the general
word index in Algorithm 2. The oldest year from the
index with a certain frequency threshold is returned
as the year of market entry.
Product Manufacturer. The product manufacturer
name is necessary to check if two products are man-
ufactured by the same company. We assume this in-
formation to be already available in the input product
set.
Hierarchical Distance. As we order products hier-
achically, the distance in the hierarchy can also be
used as a classification feature. The hierarchical dis-
tance of two products a and b thus refers to the num-
ber of steps it takes to reach product b in the tree start-
ing at product a.
Language Indicators. If search engine indexes are
queried using a conjunctive query containing the
product names of a and b, the result set contains
links to documents describing both products in a sam-
ple document. Sometimes such documents contain
phrases describing the nature of the link between the
two products such as ”Playstation 3 Versus Nintendo
Wii: Which is Right for You” or ”Zune HD is a bet-
ter choice than iPod Touch”. While the phrase ”better
choice” in the latter example only represents the opin-
ion of this one web source and can not be interpreted
as a fact without understanding its whole context, it is
possible to interpret it as a clue to the information that
Zune HD and iPod Touch are alternative products.
Research on relationships in natural language (Et-
zioni et al., 2008) has indicated that most relation-
ships are expressed in text pieces in between two en-
tities. The method used here extracts key phrases used
between the two products a and b and compares them
to terms frequently used for describing the four dif-
ferent relationship classes.
FINDING AND CLASSIFYING PRODUCT RELATIONSHIPS USING INFORMATION FROM THE PUBLIC WEB
305
Semantic Relatedness. The semantic relatedness as
defined in Algorithm 3 can be modified to not only
indicate the degree of relatedness but also the roles
of the two partners within this relation. If we measure
the shared search engine hits for the query ”a AND b”
compared to the total hits returned for ”a” as well as
for ”b”, the two numbers indicate the relevance of the
relationship for each one of the products individually.
With the help of these values it is possible to deter-
mine the roles in a relationship, i.e., which product is
the main product and which one is the accessory in an
accessory relationship.
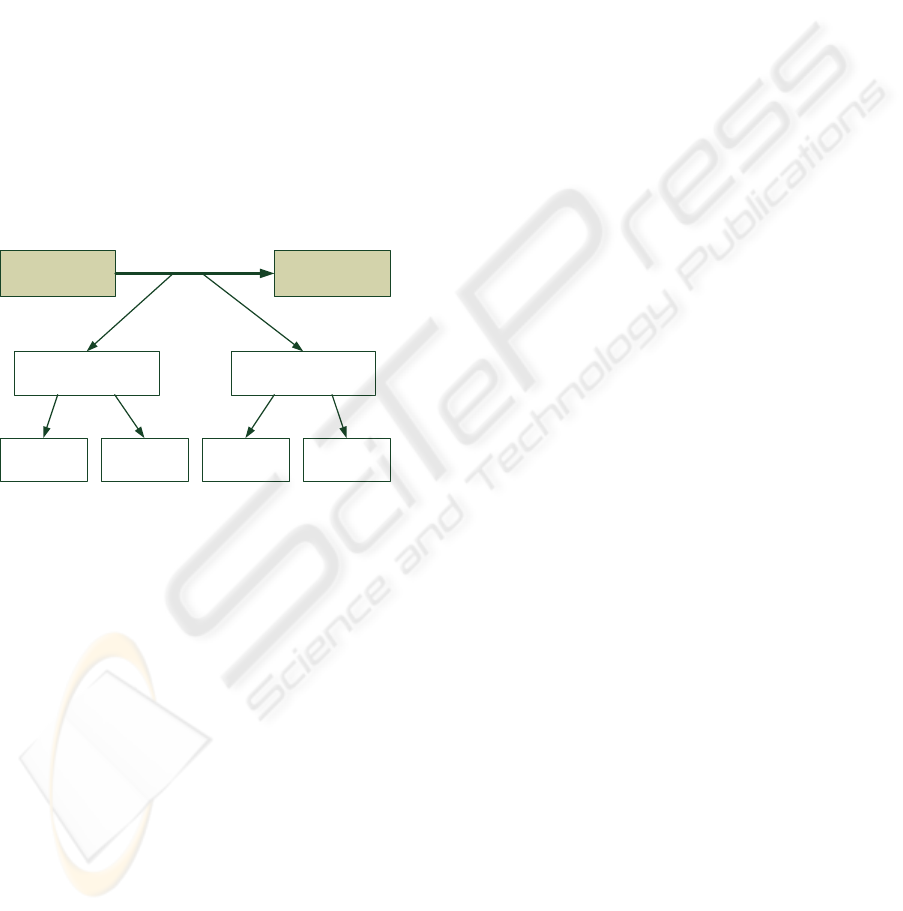
5.3 Classification
As can be seen in Figure 3, we use a combination of
a neural network and decision trees for classification
of product relationships. It turned out during testing
that the four criteria product similarity, hierarchical
distance, price similarity, and link weight are best ap-
propriate to distinguish between the two main classes
alternative and complementary product. The network
has to be trained with a labelled training set where the
label 0 is used for alternative products and the label
1 for complementary products. After training phase,
the network returns a value between 0 and 1 for each
new product pair and we define the threshold to be
0.5. We chose for the neural network as the inter-
action between the four criteria is very complex and
thus vector distance measures or decision trees do not
perform well for this problem.
Figure 3: Product relationship classification.
The further refinement of the two main classes at
the next level is more straightforward. We use spe-
cialized decision trees to decide for either competitor
vs. successor/predecessor or accessory vs. incompat-
ible product. The different criteria used are described
in Figure 3. Both decision trees contain the possibility
to reject the decision if there is not enough evidence.
Though the result of the overall classification process
is either one of the four classes of the lower layer or
one of the two classes of the upper layer.
6 EVALUATION
To evaluate the concepts presented here we took a
two-staged approach. We first implemented the algo-
rithms in a prototype implementation visualising the
product relationship networks and thus enabling hu-
man users to assess the usefulness of such a system.
In a second phase we did several runs on a test collec-
tion to assess the measurable quality (precision/recall)
of the algorithms.
6.1 Implementation
Our implementation is a protoype programmed in
Java using the Processing framework (Fry and Casey,
2010) to visualize the product relationship network.
The coarse layout is split into two applications, one
web application to configure the system and to present
the results, and one larger management application
that is responsible for building and maintaining the
networks.
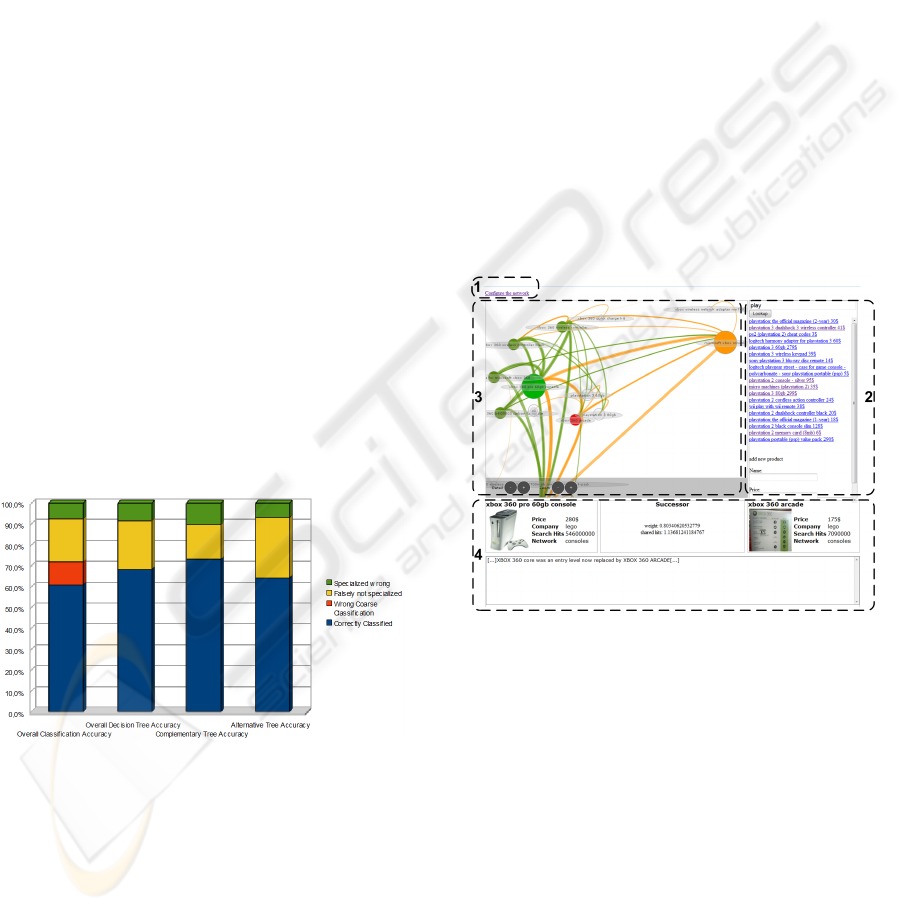
Figure 4: Screenshot of prototype implementation.
Figure 4 shows a screenshot of the prototype
implementation. The management interface can be
reached by a link (1) where new products can be
added to the network. The relationship network is
then updated for each new product. The right part of
the screen (2) contains a search form and displays the
search results. In the example all products in the net-
work containing ”play” are shown. If the user clicks
on an instance (here ”XBox 360 60 GB console”)
the relationships of the product to other products are
shown. If clicking on a link, more information (like
the link classification) is shown in the bottom screen
(4).
ICEIS 2010 - 12th International Conference on Enterprise Information Systems
306
6.2 Relationship Discovery
Effectiveness
To measure the quality of the relationship discovery
algorithms, a dataset consisting of 150 products con-
taining 630 relevant relationships was used. The prod-
ucts originated from 7 different product groups: dig-
ital cameras, gaming consoles, mp3 players, mobile
phones, shoes, notebooks and software. Each group’s
share in the dataset is between 7% and 23%. The
relevance assessment for the gold standard was done
manually starting from a test run of the system with
parameters set to produce a very high recall of around
4000 product links that were manually downsized to
630 actually relevant connections.
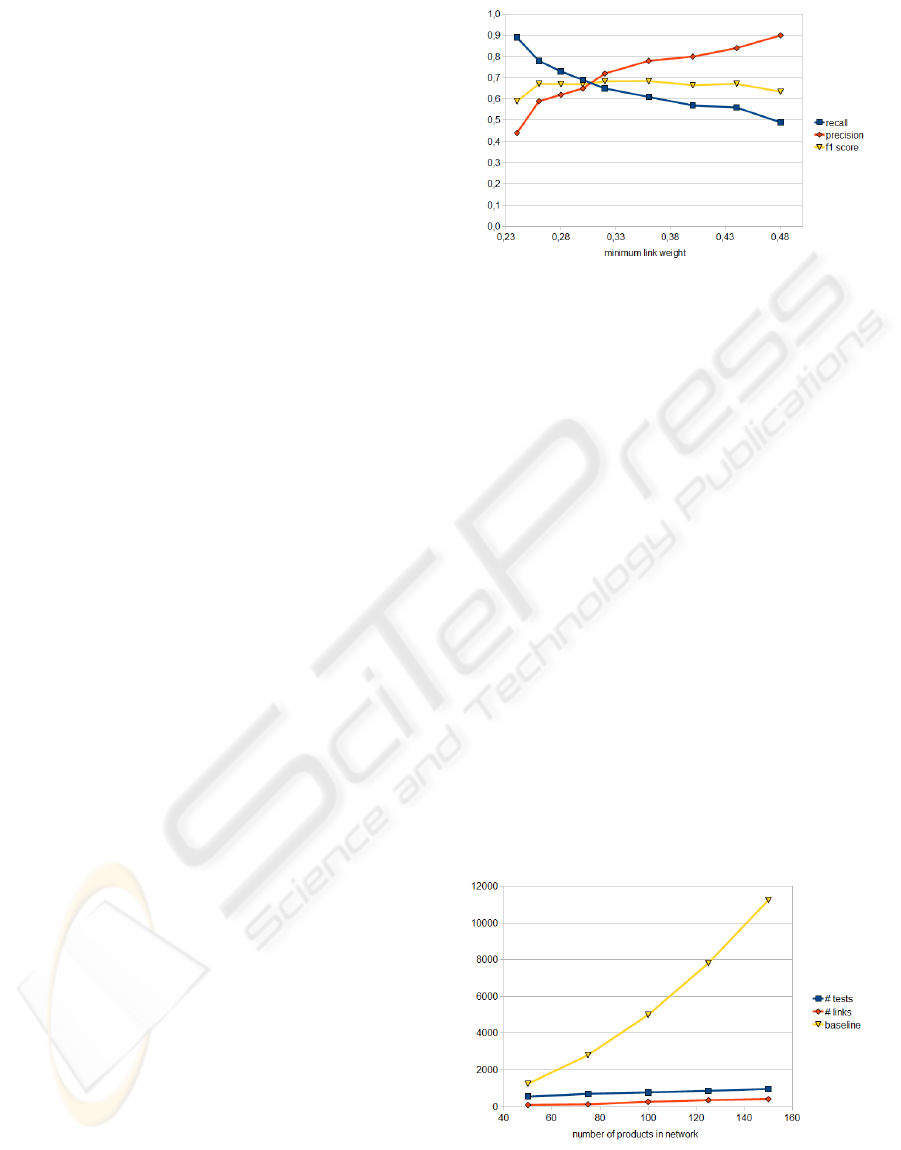
Figure 5 shows the results from different test runs
with the parameter minimal link weight set between
0.2 and 0.5. The diagram shows three curves, one
for the recall, another for the precision and the last is
the F
1
score as the harmonic mean between the two.
These are the standard measures in evaluation of IR
systems (Manning et al., 2008). In our scenario the
recall refers to the fraction of relevant product links
found by the algorithms while precision means the
fraction of relevant product links among the product
links found.
Thus, if we increase the minimal link weight nec-
essary to classify a link as relevant, more product
links are recognized by the system. But also the num-
ber of false positives increases lowering the precision.
If we take the F
1
measure as the metric to decide
which link weight performs best, the optimal value
is at w = 0.36. At this point the F
1
measure is 0.69,
the precision reaches 0.78 and the recall 0.61.
While these results are already good regarding the
unprecise, heterogeneous and often contradictionary
information about product relations in the Web, we
made an in-depth error analysis to identify the best
candidates for further improvement. The distribution
of errors is very uneven among the different cate-
gories, e.g., gaming consoles account for 50% of the
false positives while only 21% of the products where
gaming consoles. On the other hand, relations be-
tween MP3 players where quite hard to find: almost
50% of the false negatives result from MP3 players
while they make only 23% of the product collection.
If we remove gaming consoles from the network, we
get an optimal configuration with F
1
=0.8, recall=0.84
and precision=0.76. Interestingly, if the network con-
sists only of gaming consoles we also reach quite
good scores with F
1
, recall and precision all being
0.78.
This example shows that relationship discovery is
highly domain-dependent and a domain-neutral clas-
Figure 5: Relationship discovery efficiency.
sification is not likely to reach more than the roughly
70% efficiency (F
1
measure) shown above. But if we
restrict the network to special product domains, 80%
efficiency and more can be reached easily. Thus the
algorithms are of better use if applied inside a prod-
uct information system specializing on a product do-
main (like special online stores). But nevertheless
the domain-independent efficiency is good enough to
provide an added value for many application areas of
product information systems.
6.3 Relationship Discovery Efficiency
Besides presenting methods for finding product rela-
tionships, one major goal of our approach is to be far
more efficient than the baseline approach of compar-
ing each product with each other product to find a
link. Thus we measured the number of tests neces-
sary with different number of products in the test set.
The results are shown in Figure 6.
As can be seen in the graph the number of tests
increases linearily with the number of links in the net-
work and is always far below the baseline approach.
The baseline approach shows quadratic growth, thus
Figure 6: Relationship discovery performance.
for a network of 150 products, the baseline approach
already needs more than 10 times (11250) as much
tests than our approach (968).
FINDING AND CLASSIFYING PRODUCT RELATIONSHIPS USING INFORMATION FROM THE PUBLIC WEB
307
6.4 Relationship Classification
Effectiveness
The quality of the relationship classification was eval-
uated with the same dataset as the discovery. All en-
tries were additionaly tagged with a target classifica-
tion. The prototype implementation was then used to
classify all entries itself and the outcome was com-
pared to the gold standard.
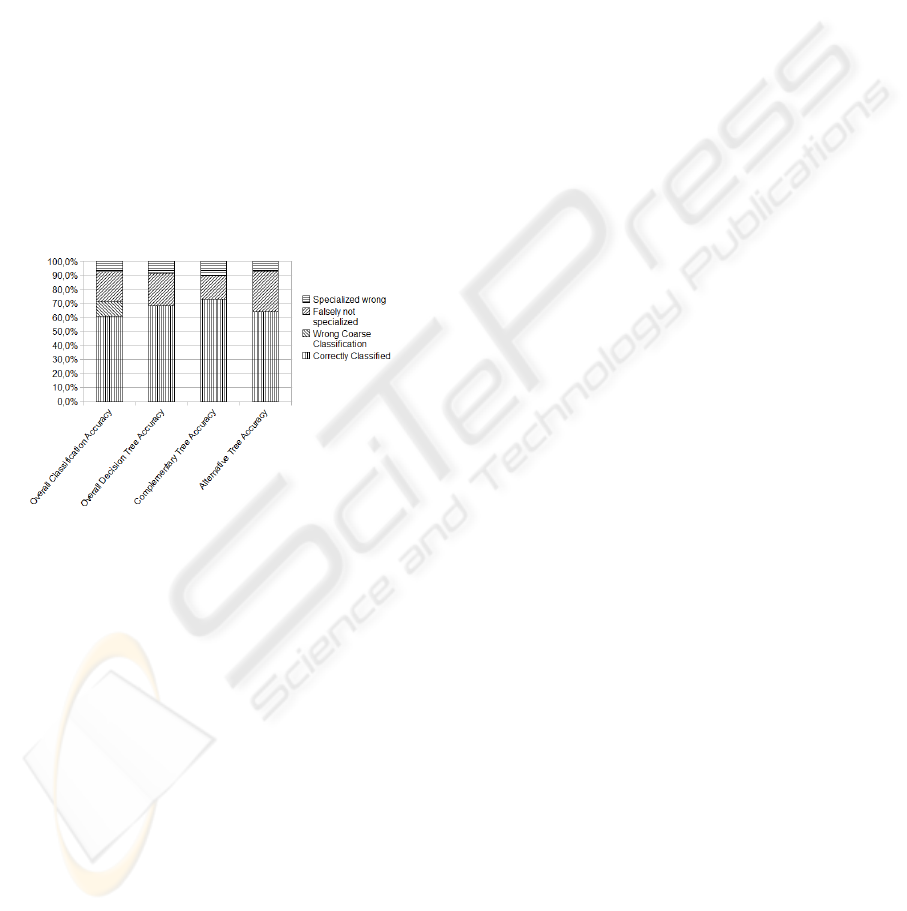
The results are described in Figure 7. We present
our results divided into four central measurements,
the overall classification accuracy (presents the clas-
sification quality of the system as a whole), the ac-
curacy of the second classification step using the de-
cision trees and two measurements representing the
accuracy of each decision tree by itself. The last
three measurements are meant to precisely indicate
strenghts and weaknesses of the system. Each bar
does not only show the total accuracy, but also clearly
distinguish the kinds of mistakes that were made.
Figure 7: Relationship classification efficiency.
Our analysis based on these results showed that
the system’s classification already performs remark-
ably well, with an overall accuracy of about 60 per-
cent. Especially the first stage of the classification
(using the neural network) performs very well, with
an accuracy of slightly over 90 percent. In fact the
system only made very little critical mistakes. Most
mistakes were done by not being able to further spe-
cialize a classification and less than 10 percent of its
mistakes were done by falsely specializing a classifi-
cation, leading to an erroneous class assignment.
Analysis of the results from measuring the deci-
sion trees’ individual accuracy showed that the al-
ternative decision tree branch is responsible for most
mistakes. The results indicate some problems with its
specialization design, so improvements at this point
could potentially boost the overall accuracy signifi-
cantly.
7 CONCLUSIONS AND FUTURE
WORK
Based on the assumption that product relationships
can be found and classified using information from
the public Web only, we presented algorithms and
methods to carry out this complex Web information
extraction task starting with a hierachically clustered
tree of product names.
The link discovery algorithms presented in Sec-
tion 4 are the main contribution of this paper and
thus described in a very detailed manner to enable the
readers to implement this method in their own prod-
uct information systems. We believe that this method
is quite powerful and unique and despite its current
prototypical status the results of our evaluation have
been very positive with precision and recall values be-
ing above 0.7 even for the hard to solve general case
of finding relationships in diverse product categories.
The connection classification part as provided in
Section 5 leaves more room for discussion as this is a
first step towards giving product relations a meaning
based on information available in the Web. The main
contribution here is the description of features used
for classifying product relations and the layered ap-
proach of first assessing a main category (alternative
or complementary) and then using a specialized clas-
sification method. We choose the combined approach
of neural networks and decision trees based on our
experience and some basic tests with our test set. It
is beyond the scope of this paper if other classfication
methods like Latent Semantic Indexing (LSI) or Sup-
port Vector Machines (SVM) would further improve
the results of these steps.
Especially in terms of scalability the design ful-
filled its purpose by operating way faster than an or-
dinary brute-force approach, causing at most a linear
growth of computation effort.
The approach offers many possibilities for future
reasearch. It would be very interesting to especially
invest more work into advancing the classification ap-
proach to become more open, if not completely self-
learning. Such a system would not require pre-defined
relationship classes anymore but could learn them it-
self, maybe based upon a sizeable tagged set of exam-
ples.
In fact, the latter suggestion provokes the ques-
tion if our approach might be applicable for finding
and describing relationships outside the product do-
main, too. Except of our classification design, all
other parts are already product independent (meaning
they require no product-specific background knowl-
edge). First small tests have indicated that with ad-
ditional work the method may indeed be used to find
ICEIS 2010 - 12th International Conference on Enterprise Information Systems
308

relationships between all entities that are sufficiently
discussed in open document collections like the Web.
REFERENCES
Adomavicius, G. and A., T. (2005). Toward the next gener-
ation of recommender systems: A survey of the state
of the art and possible extensions. IEEE Transaction
on Knowledge and Data Engineering, 17(6):734–749.
Alias-I (2009). Lingpipe. http://alias-i.com/lingpipe/.
Apache Foundation (2009). Apache Lucene.
http://lucene.apache.org/java/docs/.
Bach, N. and Badaskar, S. (2007). A survey on relation
extraction. Technical report, Language Technologies
Institute, Carnegie Mellon University.
Banko, M. and Etzioni, O. (2008). The tradeoffs between
open and traditional relation extraction. In Proceed-
ings of ACL-08: HLT, pages 28–36, Columbus, Ohio.
Association for Computational Linguistics.
CBS interactive (2010). Cnet shopper.
http://shopper.cnet.com/.
Etzioni, O., Banko, M., Soderland, S., and Weld, D. S.
(2008). Open information extraction from the web.
Commun. ACM, 51(12):68–74.
Fry, B. and Casey, R. (2010). Processing 1.0.
http://processing.org/.
Han, E.-H. S. and Karypis, G. (2005). Feature-based rec-
ommendation system. In CIKM ’05: Proceedings
of the 14th ACM international conference on Infor-
mation and knowledge management, pages 446–452,
New York, NY, USA. ACM.
Kawamura, T., Nagano, S., and Mizoguchi, Y. (2008).
Ontology-based wom extraction service from we-
blogs. In SAC ’08: Proceedings of the 2008 ACM
symposium on Applied computing, pages 2231–2236,
New York, NY, USA. ACM.
Linden, G., Smith, B., and York, J. (2003). Amazon.com
recommendations: Item-to-item collaborative filter-
ing. IEEE Internet Computing, 7(1):76–80.
Liu, B., Hu, M., and Cheng, J. (2005). Opinion observer:
analyzing and comparing opinions on the web. In
WWW ’05: Proceedings of the 14th international con-
ference on World Wide Web, pages 342–351, New
York, NY, USA. ACM.
Manning, C. D., Raghavan, P., and Sch
¨
utze, H. (2008). In-
troduction to Information Retrieval. Cambridge Uni-
versity Press, Cambridge, UK.
Schafer, J. B., Konstan, J., and Riedi, J. (1999). Recom-
mender systems in e-commerce. In EC ’99: Proceed-
ings of the 1st ACM conference on Electronic com-
merce, pages 158–166, New York, NY, USA. ACM.
Schuster, D. and Schill, A. (2007). NL sampler: Ran-
dom sampling of web documents based on natural lan-
guage with query hit estimation. In SAC ’07: Proceed-
ings of the 2007 ACM symposium on Applied comput-
ing, pages 812–818, New York, NY, USA. ACM.
Schutz, E. and Buitelaar, P. (2005). Relext: A tool for re-
lation extraction from text in ontology extension. In
Proceedings of the 4th International Semantic Web
Conference (ISWC).
Shen, E., Lieberman, H., and Lam, F. (2007). What am i
gonna wear?: scenario-oriented recommendation. In
IUI ’07: Proceedings of the 12th international con-
ference on Intelligent user interfaces, pages 365–368,
New York, NY, USA. ACM.
Singhal, A., Buckley, C., and Mitra, M. (1996). Pivoted
document length normalization. In SIGIR ’96: Pro-
ceedings of the 19th annual international ACM SIGIR
conference on Research and development in informa-
tion retrieval, pages 21–29, New York, NY, USA.
ACM.
van Meteren, R. and van Someren M. (2000). Using
content-based filtering for recommendation. In ML-
net / ECML2000 Workshop, Barcelona, Spain.
Wan, Y., Menon, S., and Ramaprasad, A. (2007). A classifi-
cation of product comparison agents. Commun. ACM,
50(8):65–71.
Yahoo! Inc. (2010). Yahoo! search boss.
http://developer.yahoo.com/search/boss/.
FINDING AND CLASSIFYING PRODUCT RELATIONSHIPS USING INFORMATION FROM THE PUBLIC WEB
309
