
STOOG
Style-Sheets-based Toolkit for Graph Visualization
Guillaume Artignan and Mountaz Hascoët
Univ. Montpellier II, LIRMM, UMR 5506 du CNRS, 161, rue Ada 34392 Montpellier Cedex, France
Keywords: Graph Visualization, Style Sheets, Simple Clustered Graphs, Multivariate Graphs.
Abstract: The information visualization process can be described as a set of transformations applied to raw data to
produce interactive graphical representations of information for end-users. A challenge in information
visualization is to provide flexible and powerful ways of describing and controlling this process. Most work
in this domain address the problem at either application level or toolkit level. Approaches at the toolkit level
are devoted to developers while approaches at the application level are devoted to end-users. Our approach
build on previous work but goes one step beyond by proposing a unifying view of this process that can be
used by both developers and end-users. Our contribution is a system named STOOG with a three-fold
contribution: (1) a style-sheets based language for the explicit description of the transformation process at
stake in information visualization, (2) an application that automatically builds interactive and graphical
visualization of data based on style-sheet descriptions, (3) a user interface devoted to the conception of style
sheets. In this paper, we present STOOG basic concepts and mechanisms and provide a case study to
illustrate the benefits of using STOOG for the interactive and visual exploration of information.
1 INTRODUCTION
Over the past years, the visualization process has
been described as a set of transformations that
applies to data to produce interactive graphical
representations. Several models including dataflow
model (Haeberli 1988) can be used to describe these
transformations. A large amount of systems are
based on the data flow model. In (Card et al. 1999,
Baudel 2003) information visualization takes as
input one or more data tables. In (Heer 2005) raw
data is transformed to abstract data composed of
entities: nodes or edges.
More precisely, we are interested in data
represented by clustered graphs and multivariate
graphs. A multivariate graphs is a graph where each
data element, node or edge, is associated to several
attributes. A simple clustered graph is a graph where
each node is associated to a group named cluster.
Fig. 1 shows a sample of a simple clustered and
multivariate graph.
We define a dataset as a set of data elements. In
our case of simple clustered graphs, data elements
are either nodes, edges or clusters. We define a
graphical representation as the view displayed on
the computer screen. We name the coding function
the description of transformations that produce
graphical representations of non graphic data by,
taking as input both datasets and user interactions
and coding functions. The rational for these coding
function has its origins in the seminal work of Bertin
(Bertin, 1977) on the semiology of graphics. General
purpose toolkits for information visualization such
as Prefuse (Heer 2005) make coding function key
elements for the developers eager to build interactive
visualizations of information. Other approaches for
building visualization such as interpreted languages
like DOT (Gansner and North 2000) for example
handle coding as the basis for building views.
Most approaches comes with different
characterizations of the coding functions at stake. By
building on previous work, our aim in this paper is
to provide a powerful and flexible way for the
description of coding functions for information
visualization of multivariate clustered graphs both at
the level of the developer and at the level of the end-
user.
Our approach is to propose a system named
STOOG with a three-fold contribution: (1) a style-
sheet based language for the explicit description of
coding functions, (2) an application that
automatically builds interactive and graphical views
from STOOG style-sheet based on coding
descriptions and raw data, (3) a user interface aimed
123
Artignan G. and Hascoët M. (2010).
STOOG - Style-Sheets-based Toolkit for Graph Visualization.
In Proceedings of the 12th International Conference on Enterprise Information Systems - Information Systems Analysis and Specification, pages
123-131
DOI: 10.5220/0002975101230131
Copyright
c
SciTePress

at end-users to support the conception and
generation of style sheets.
The mix of the three contributions is important in
order to bridge the gap between usually two
complementary yet separated approaches: on the one
hand the toolkit approach devoted to developers and
on the other hand the application approach devoted
to end-user. It is important to stress that bridging the
gap between these two approaches is important to
gain in flexibility and expressivity for the end-user
and at the same time save efforts and development
time for the developers.
In this regard, our approach compares to the
approach of Tableau Sotware (Hanrahan, 2007)
project (http://www.tableausoftware.com/). The
main differences between their approach and our
contribution lies in the fact that we consider multi-
level graphs as the basis for representing data and
that we propose to make the style-sheet language
that describes the coding functions both explicit and
open.
Hence, STOOG presents several strengths over
existing work. Firstly, the high level language makes
semiotic analysis possible thanks to the
manipulation of abstract concepts. Secondly,
STOOG interprets the description language and
builds an interactive visualization of any data set
accordingly. Thirdly, the user interface makes
dynamic customizations of existing representation
possible and easy.
The style-sheet based language of STOOG
enables the manipulation of high level concepts such
as graphical representations, graphical structures or
properties by the user. Four mechanisms are
proposed in this language: (1) the matching
mechanism which makes possible the association of
one or more representations to a set of data
elements, (2) the coding mechanism corresponding
to the association of data attributes and visual
variables, (3) the cascading mechanism
implementing the inheritance of properties and
structures and (4) the interaction mechanism
defining the representation of data during the
interaction.
It is important to stress that these mechanisms
were meant to be coherent with other approaches
where form are explicitly described independently of
its content such as in HTML/CSS or XML/XSLT
approaches but our approach is STOOG is different
and more general because the data handled in
STOOG is not limited to HTML/XML documents.
Indeed, STOOG handles any raw data set. Another
analogy with STOOG style sheets can be found in
SVG stylesheets but here again, SVG style sheets
are limited to SVG documents. They do not handle
the coding functions for any set of multivariate and
clustered data as is the case of STOOG.
STOOG is implemented using Java and supports the
generation of views from raw data and coding
functions. It further supports the rendering and
interaction with these views. Moreover, if useful,
extending STOOG style-sheet based language can
be performed by a developper to account for more
specific types of coding. STOOG is available for
download on the web and directly reusable in any
Java application.
This paper is divided in five sections. We firstly
present related work. Secondly, we define STOOG
style sheet language, the concepts and the
mechanisms to handle these concepts. Thirdly, we
present STOOG throught a use case. Fourthly, we
expose the user interface devoted to the conception
and generation of style sheets for end-users. We then
conclude and discuss future work.
2 RELATED WORK
Over the past year, several approaches have
demonstrated the importance of providing adapted
tools for data visualization. We detail previous work
on tools for data visualization and situate our
contribution in the domain.
2.1 Visualization Tools
Jeffrey Heer has shown in (Heer 2005) the interest
of providing toolkits for interactive visualization of
information. One of the first toolkit that he proposed
called Prefuse, transforms raw data to abstract data
and, thanks to actions, further transforms abstract
data to visual items. The visual items are finally
drawn thanks to renderers. The toolkit is used by a
lot of visualization application that build on top of
Prefuse for visualizaing data in various domains:
graph community visualization (Perer et al. 2006),
lexical visualization (Collins 2006), cartographic
visualization (Phan et al. 05), collaborative
visualization (Heer and Viégas 2007) etc.
In (Adar 2006) Guess is another system devoted
to graph visualization. Guess highlights the need to
have interfaces for customizing rendering by visual
attributes. The graph rendering is determined by the
user thanks to queries. These queries are written in
Gython an extension of the Jython system (a Java
interpreter for the Python language). The tool
supports generation of charts, computation of
convex hulls. Selection of data elements helped on
data values criterion or topology criterion.
In GraphViz (Gansner and North 2000) authors
present the DOT language that supports the
generation of views. Graphs are first described in a
file using DOT language, the file is further
ICEIS 2010 - 12th International Conference on Enterprise Information Systems
124

interpreted by GraphViz which gives the rendering
and layout. The DOT language is used mainly for its
simplicity.
The Protovis toolkit (Bostock and Heer 09)
builds upon lessons learned from Prefuse and
proposes visualization by composing simple
graphical marks. Protovis is implemented in
JavaScript with rendering in HTML, SVG and Flash.
The Protovis toolkit constitutes an excellent way to
produce aesthetic charts for websites.
In (Mackinlay et al. 07) ShowMe is described as
a set of user interface commands for the automatic
generation of presentations. Presentations are further
integrated into Tableau Software. Views are
specified in an algebraic language: the VizQL
language. In (Cammarano et al. 07) the authors
propose an automatic technique for the visualization
of heterogeneous data. The authors are more
precisely interested to match data attributes to
visualization attributes. The authors use the RDF
format.
In (Pietriga 2006) the GSS language is presented
Graph Style Sheet language for semantic web data
visualization. The system offers visualization of
RDF data as a directed labeled graph. The author
introduces the idea of using style sheets for graph
visualization.
Cascading style sheets (W3C 2006) are used for
the presentation of HTML documents but also used
in languages as Flex (Kazoun et al. 2007) or in
formats as SVG (Eisenberg 2002).
In (Baudel 2004) the ILOG Discovery tool is
proposed. The tool proposes the description of
interactive charts using style sheets. The tool is
based on model defined in (Baudel 2003). The
model is declarative and defines fixed dataflow
architecture.
2.2 Our Contribution
In this section we situate our contribution amongst
the previously detailed contributions. Over the past
decades several toolkits such as Prefuse or Guess
(Heer 2005, Adar 2006, Bostock et al. 2009) have
provided very thoughtful ways of describing coding
functions. Most toolkit provide flexible and
powerful ways of describing coding but their usage
is devoted to developers not end-users. Therefore to
suit the needs of end-users, applications have to be
developed for different application contexts and
users. Even if these new toolkits help a lot, this is
still very time consuming for developers and
frustrating for end-users. Indeed, our own
experiments with end-users shows that the key
object of interest for many end-users is the coding
functions. However, lots of visualization
applications provide less control over these
functions to the end-users than what is possible at
the toolkit level.
Therefore our contribution is to build on
previous work to provide both end-users and
developers with ways of understanding and
expressing coding functions.
STOOG can be used to generate views pluggable
in other applications or web sites. The view is
initialized by two parameters: graph data and a style
sheet. The aim of the style sheet is to describe the
coding functions.
Style-sheet concepts are easy to understand and
use for both end-users and programmers. STOOG
style sheets can be created and changed on the fly by
end-users. STOOG can either be used as a STOOG
standalone application by end-users or be integrated
in other applications by developers. The style-sheet
language definition of STOOG can also be extended
by developers.
Contrary to toolkits where coding is
implemented in the code, like in Prefuse (Heer
2005), the style-sheet approach makes it possible to
handle different encoding without recompiling
applications. We also propose a representation
based on the composition of graphical
representations or shapes. In the system proposed in
(Adar 2006), only one shape can be associated to
each data element.
In (Bostock et al. 2009, Baudel 2003) the
systems proposed are dedicated to data visualization
and more precisely to charts.
Contrary to (Eisenberg, 2002), we propose
dynamic links between data attribute and visual
variables. We also use a mechanism selecting a
subset of data elements to associate with a graphical
representation.
The approach by Pietriga on graph style sheets
(GSS) (Pietriga 2006) can be considered as very
similar to our approach. However, there are several
differences that justify our contribution. We firstly
propose to account for interaction in coding function
rather than static coding. Secondly, we are not
limited to a set of predefined shapes, STOOG
supports the composition of shapes. Thirdly, the data
managed in (Pietriga 2006) are RDF databases
which can be represented by a simple labeled graph.
We also consider more general models of clustered
graph and multivariate graphs. Fourthly, our
proposed toolkit is pluggable in a web browser or an
existing application. Lastly, we have implemented
the cascading mechanism proposed in CSS for our
style sheets. Moreover, we have improved the
mechanism by adding cascading of graphical
representations.
STOOG - Style-Sheets-based Toolkit for Graph Visualization
125
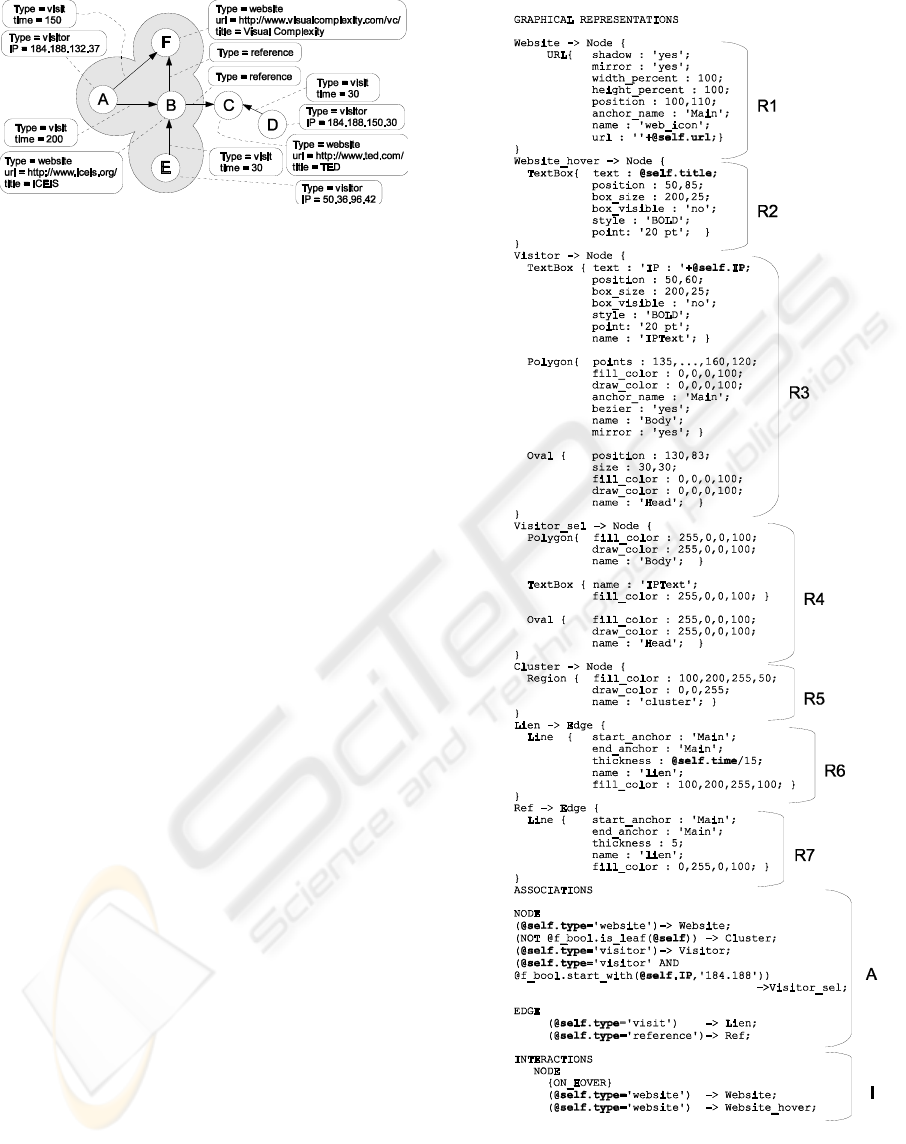
Figure 1: A simple sample of multivariate graph.
3 STYLE SHEET LANGUAGE
In (Bertin 1977), Bertin outlines six visual variables:
shape, size, value, grain, color and orientation.
Similarly, our style sheet language makes the
definition of visual variable possible thanks to
concepts such as graphical representations,
graphical structures and attributes. In this section,
we outline the four core mechanisms that we found
useful for STOOG style-sheets: matching, coding,
cascading and interaction. These mechanisms
enables the association between data and visual
variables.
3.1 Basic Principles
A style sheet describes graphical representations.
Each representation is associated to a class of data
elements. In the precise case of graphs, data
elements are Nodes, Edges or Clusters.
An important difference between our approach
and other approaches like (Adar 2006) is the
possibility of composing data element
representations with graphical structures. Graphical
structures are defined by attributes. Each attribute is
associated to a list of values.
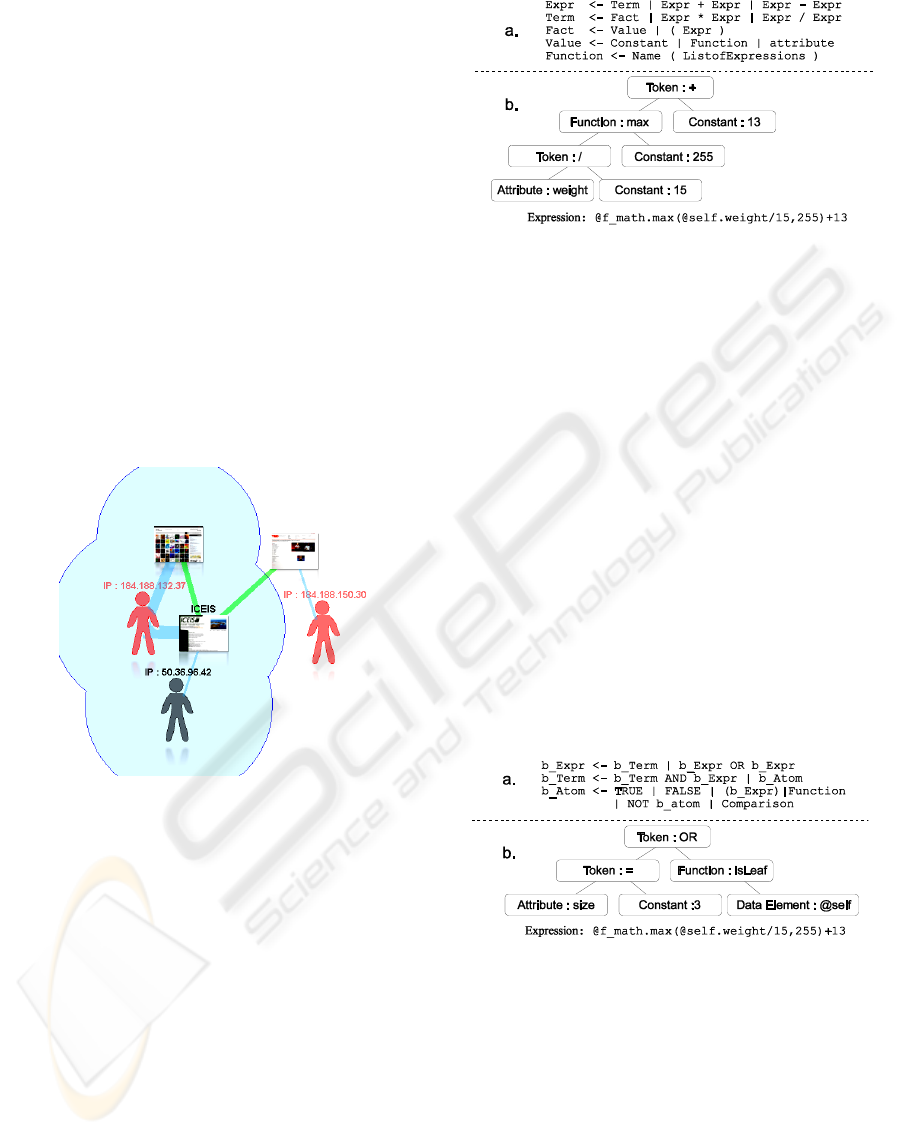
In order to illustrate our discussion, we present a
style sheet sample (Fig. 2) applied on the graph (Fig.
1) and the associated generated visualization (Fig.
3). The Fig. 1 presents visits of websites by internet
users. We decide to represent internet users and
websites by labeled nodes visits and references by
labeled edges. Fig. 3 presents the result after the
application of the style sheet. Internet users are
represented by a schematic person. Internet websites
are represented by thumbs. Visits are represented by
links in blue, the thickness is proportional with the
time spent by a given user on a given website.
References are represented by links in green.
Internet users in pink have an IP address beginning
by ‘184.188’.
Figure 2: A sample of style sheet.
ICEIS 2010 - 12th International Conference on Enterprise Information Systems
126
The style sheet is composed of a list of graphical
representations. Each graphical representation is
composed of graphical structures themselves
composed of attributes. Graphical representations
are noted on Fig. 2 from R1 to R7. The
representation R3 named visitor is composed of
three graphical structures: a text box, a polygon, an
oval. The text box helps for displaying the IP
address. The polygon depicts the visitor body. The
oval depicts the visitor head.
In this style sheet language, edges can be linked
to any structure. When the creation of an edge
representation is done we must specify the name of
the source port and the name of the target port for
binding the edge representation. The name is given
by the anchor-name property.
This section has shown how to define graphical
representations. We are now interested in the four
proposed mechanisms: coding mechanism, matching
mechanism, cascading mechanism and interaction
mechanism.
Figure 3: A simple sample of transformed graph using a
style sheet.
3.2 Coding Mechanism
The coding mechanism consists in defining how data
attributes are represented by visual attributes. Each
visual attribute value is described by an expression.
An expression can be:
- A constant,
- A data attribute or
- A binary operation with two operands
themselves expressions,
- An arithmetic function parameterized by
expressions.
Fig. 4 shows the grammar for arithmetic expression,
an example of accepted expression and the
associated abstract syntax tree.
Figure 4: Simplified grammar for arithmetic expressions.
3.3 Matching Mechanism
The matching mechanism consists in associating a
set of data elements (i.e. nodes, edges or clusters) to
a set of representations. The associated elements are
selected thanks to Boolean expressions. If a Boolean
expression is satisfied, we associate a given
representation to a set of selected data elements.
A Boolean expression can be
- A constant (True or False),
- An operator (Not, And, Or) with for each
operand a Boolean expression,
- A comparison (<=, <, >, >=, <>) composed of
two compared expressions cf. Fig 4,
- An operator testing the existence of an attribute
given as a parameter.
The Fig. 5 presents the followed grammar for
Boolean expression, an example of accepted
Boolean expression and the associated abstract
syntax tree.
Figure 5: Simplified grammar of Boolean expressions.
3.4 Cascading Mechanism
Cascaded representations are processed when a data
element is associated to several representations. The
cascading algorithm takes an ordered set of
representations in parameter and produces a final
representation.
The Cascading of Two Representations A and B
is done by producing a new representation C. The
representation C is made of all structures in A and B.
STOOG - Style-Sheets-based Toolkit for Graph Visualization
127
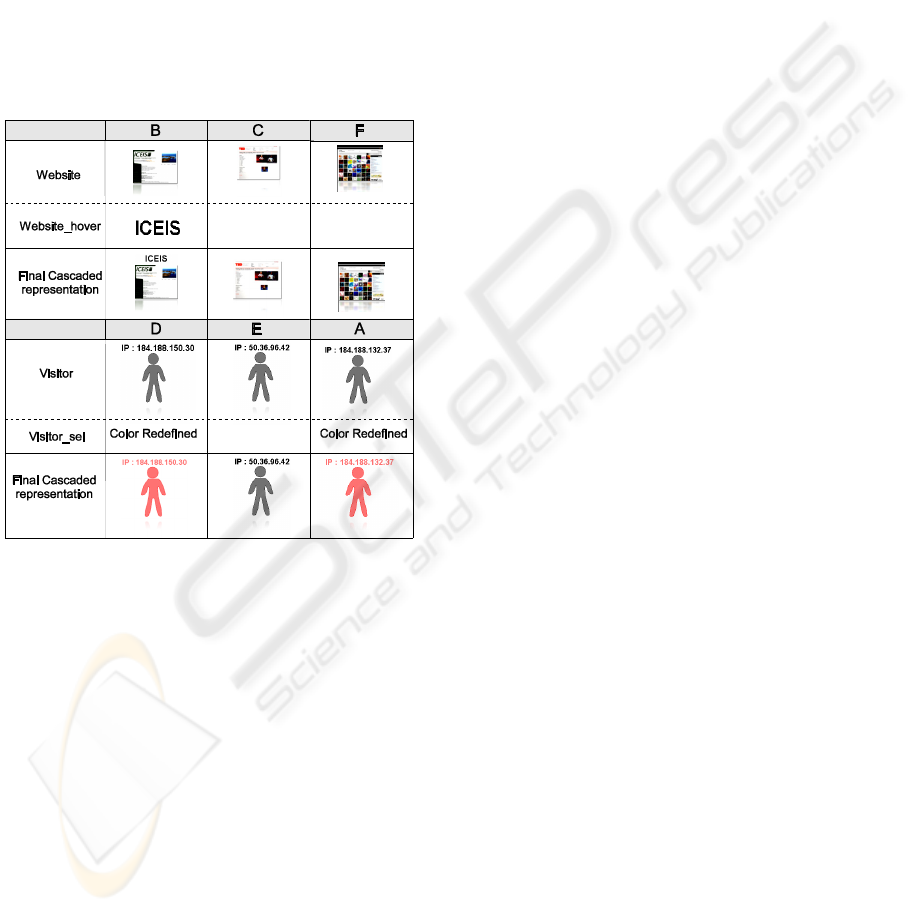
As with other CSS-like languages, a problem might
arise from incompatible definitions occurring in the
distinct representations of A and B. It is solved
similarly: two structures are considered equal if the
two structures have the same name. When two
structures are equal in the representation of A and B
the result in C is a structure of the same name.
However, the definition differs and accounts for
both A and B definitions. If ever these definitions
are contradictory, then the latest definition is kept in
C.
The Cascading of a Set of N Representations is
done by a successive cascade of one representation
after another. Fig. 6 depicts the cascading done
during the rendering of the view (Fig. 3).
Figure 6: A sample illustrate cascading mechanism.
3.5 Interaction Mechanism
The interaction mechanism corresponds to the
modification of the representation during the
interaction. For each possible interaction we select
data elements thanks to Boolean expressions. We
affect to these previously selected data elements a
new representation.
Some interactions are not fully compatible with
the cascading mechanism as explained in the
previous section. We use the notion of dynamic
cascading. Dynamic cascading does not replace the
previous representation by a new representation but
cascade it. In the precise case of interaction as the
selection interaction we want sometimes to add a
color filter in order to outline the selection. The
dynamic cascading makes this modification possible
without knowing in advance the previous
representation. This kind of cascading is
implemented only for the selection of elements.
Dynamic cascading has proven to be very useful and
might extend to other situations. Therefore, we plan
to support it in a more general way in future versions
of the system. We would then add a keyword in
future versions in order to explicit the type of
cascading desired.
4 GRAPH VIEWER
In this section, we present the viewer which is the
part of STOOG responsible for rendering. The
viewer is implemented in Java. Hence the viewer
can be pluggable in any web browser supporting
applets. This section is divided in three parts. Firstly,
we present the properties of the viewer. Secondly,
we expose the simplest interactions. Lastly, through
a use case, we present advanced interactions.
4.1 Properties
The viewer is made of three parts: the parser
transforming style sheets on a syntax tree, the
interpreter transforming this syntax tree on the
structured model, the renderer displaying elements
on the screen.
The Parsing process is implemented using the
SableCC tool. It is a compiler compiler taking a
grammar as a parameter and generating the Java
parser for this grammar. This parser is used to create
the abstract syntax tree of our style sheets.
The Interpreter takes the graph structure
underlying the data to display as a parameter and the
abstract syntax tree generated from the graph style
sheet. It transforms the abstract syntax tree in a
graphical representation model and associates each
data element to a graphical representation.
The Renderer generates the interactive
visualization on the screen in relation with the
model. It is in charge of: drawing the graph,
modifying the representations during user
interaction, and displaying animations such as layout
algorithms or zoom.
The most important aspects of our style sheet
graph viewer are its extensible capacities. The tool
supports dynamic management of structures.
Structures are imported dynamically using the Java
introspection. Each structure must determine the
attributes available and its own rendering. The
arithmetic and Boolean functions, available in
expression, are dynamic and improvable by
specifying the classes containing the functions. A
developer can therefore determine new kinds of
structures. For instance, we can imagine structures
ICEIS 2010 - 12th International Conference on Enterprise Information Systems
128
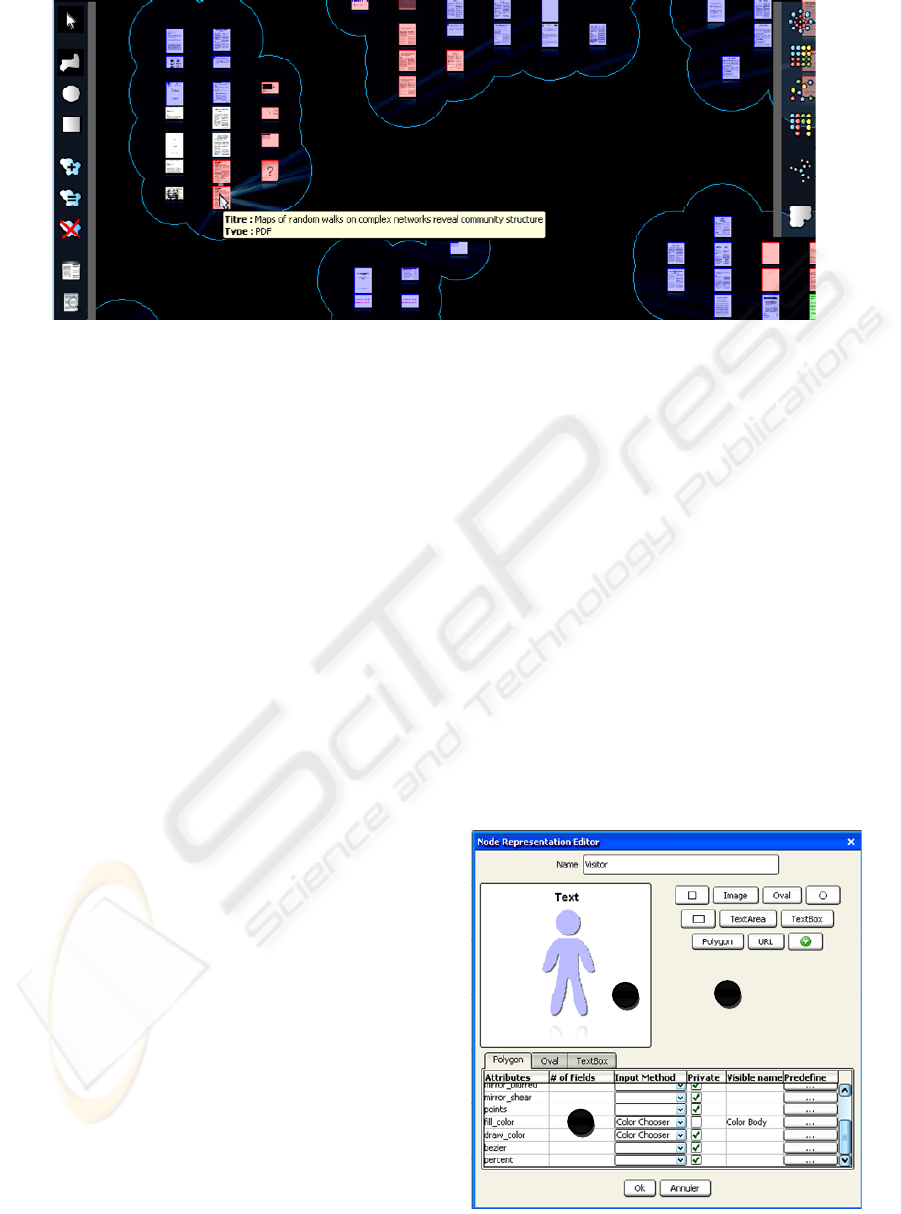
Figure 7: A sample of visualization using STOOG.
using internet such as the structure URL (Fig. 2)
which creates a thumb of web site.
4.2 Simple Usage
A simple way to use our viewer is in the applet
functionality. Indeed, the toolkit is pluggable in a
web browser as an applet parameterized by two
parameters: the graph to display, the graph style-
sheet to use. Other optional parameters are available
as the layout. During the execution both style sheets
and graph can be changed on-the-fly using drag and
drop.
4.3 Advanced Usages
We present in this part the use of STOOG through a
project. This project aims to study user classification
of documents. Each user creates his own database of
web documents. The documents are in relationships
thanks to a similarity function parameterized by two
documents and given a score between 0 and 1. The
score is near to zero if the two documents are far
semantically. The score is close to one if the two
documents are similar. We are eager to visualize and
cluster these documents. The result is visible in the
Fig. 7. The STOOG tool is integrated as a Java
component. The documents are represented by
thumbs. Clusters are represented by bubble shapes
around documents. Links between documents are
visible on mouse over. Documents drawn in blue,
red and green are in three different sets of selection.
Menus have been added on the left side and on the
right side to offer functionalities for selections,
layout, manual clustering and automated clustering.
The clusters can be created either manually or
automatically. Clusters are created manually using
the STOOG selection or automatically using the
Java implementation of the MCL algorithm (Stijn
van Dongen 2000). Some interactions are not
implementable using the graph style sheet such as
the display of incident edges on mouse hover. For
this kind of interaction it is possible to define the
representation using the graph style sheet with a
name of interaction not predefined. The developer
must then simply specify the name of the
modification of representation and of the data
element to modify during the interaction.
5 STYLE SHEET EDITOR
Our style sheet editor is divided in two parts: a
creator and a graph style sheet editor. The creator
makes the creation of representations on-the-shelf
possible. The graph style sheet editor gives a list of
representations possible and enables the association
between data and visual attributes.
A
A
A
A
B
C
Figure 8: Node Representation Editor.
STOOG - Style-Sheets-based Toolkit for Graph Visualization
129
A
A
A
A
A
B
C
D
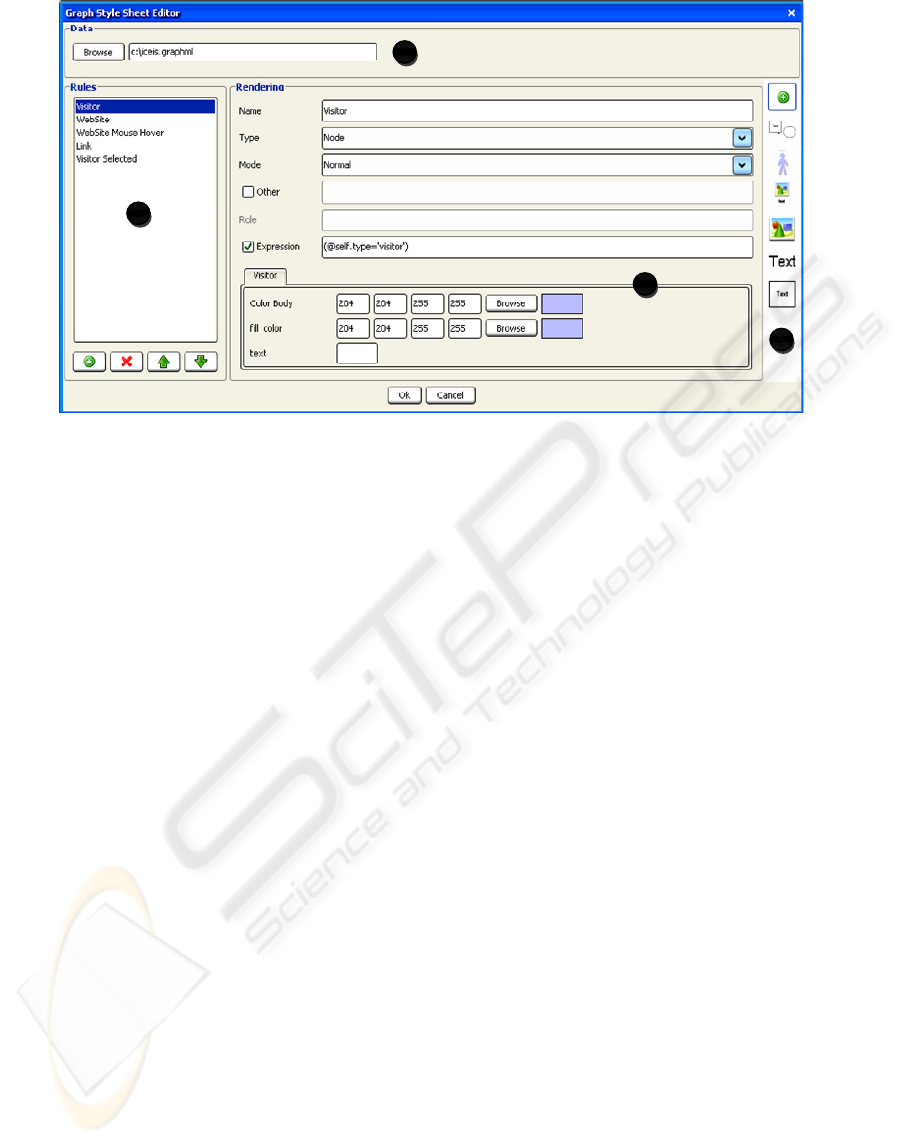
Figure 9: Graph Style Sheet Editor.
5.1 Representation on-the-Shelf
The creator (Fig. 8) proposes the construction of
representations on-the-shelf. It is divided in three
sections: (A) the list of structures, (B) the draw
panel, (C) the list of attributes.
The List of Structures is defined using the import
button. The import button triggers input dialog
asking for a structure class name. The structure is
imported thanks to the Java introspection
mechanism. The list of structures is stored in a for
further uses.
The Draw Panel makes the positioning of structures
possible. It offers a preview of the representation.
The List of Attributes shows all available attributes
for each structure placed on the draw panel. For each
attribute the user can specify predefined values, the
visibility of the attribute (private or not), the visible
name and the input method. For instance the
attribute fill_color of the instance of polygon is
public (i.e. it will appear in the graph style sheet
editor), the visible name is ‘Color Body’. The color
is typed using a color chooser. When the button “ok”
is pressed the representation is available on-the-
shelf.
5.2 Graph Style Sheet Editor
The graph style sheet editor Fig. 9 is divided in four
parts: (A) data, (B) representations, (C) rules and
(D) rendering.
The Data Section makes the specification of a
dataset possible. The data is considered as an
instance nevertheless enables functionalities as auto-
completion of data attributes.
The Representation Section exposes a set of
available representations for graph style sheets. One
click triggers the association of the representation to
the selected rule and the adding of a tab in the
rendering section.
The Rule Section exposes a set of rules created by
the user. The rule is defined by a name, a condition
of application named expression, an application
mode and a kind of data element.
The Rendering Section presents the visual
variables associated to the representation.
In the example in Fig. 9 the user has created a rule
named “visitor”. The rule is applied on the visitor
node. The rendering associated to the rule is a visitor
representation (Fig. 8). The generated form
concatenates the fields of all structures in the
graphical representation. Only public attributes are
visible, with the input method and the name chosen
during the conception.
6 CONCLUSIONS
In this paper we have proposed a toolkit for graph
visualization, more precisely for the visualization of
multivariate graphs and clustered graphs. Our
approach is based on style sheets. We have
introduced a new language for the definition of style
sheets which proposes new concepts and four
mechanisms in order to handle these concepts: the
matching, the coding, the cascading, and the
ICEIS 2010 - 12th International Conference on Enterprise Information Systems
130

interaction. STOOG provides and integrates (1) an
extensible language for style-sheet definition, (2) a
standalone application and an API supporting the
rendering and interaction of visualization resulting
from encoding raw data according to STOOG Style
sheets and (3) a user interface to facilitate the
creation and reuse of style-sheets. We believe that
by using STOOG, both end-users and developers
will save time and efforts in their attempts to
visually explore large amounts of information.
7 PERSPECTIVE
In the future we plan to extend our language with
more complex interactions. We are interested in
extending our toolkit for graph hierarchies. Finally
we plan to conduct controlled experiments on
different users.
REFERENCES
Adar, E. 2006. GUESS: a language and interface for graph
exploration. CHI '06. ACM, New York, NY, 791-800.
Bertin, J. La Graphique et le Traitement Graphique de
L'information. La graphique de Communication. p. 22.
Flammarion, 1977.
Bertin, J. 1983 Semiology of Graphics. University of
Wisconsin Press.
Baudel, T. Canonical Representation of Data-Linear
Visualization Algorithms and its Applications. ILOG
Research report. 2003. http://techreports.ilog.com
Baudel, T. 2004. Browsing Through an Information
Visualization Design Space. CHI '04. ACM, New
York, NY, 765-766.
Bostock, M. and Heer, J. 2009. Protovis: A Graphical
Toolkit for Visualization. TVCG’09 15, 6, 1121-1128.
Cammarano, M., Dong, X., Chan, B., Klingner, J., Talbot,
J., Halevey, A., and Hanrahan, P. 2007. Visualization
of Heterogeneous Data. TVGC’2007
Card, S., Mackinlay, J., and Shneiderman, B. 1999.
Readings in Information Visualization: Using Vision
to Think. Morgan Kaufmann Publishers Inc., San
Francisco, CA.
Collins, C. DocuBurst: Document Content Visualization
Using Language Structure. Infovis’2006. Baltimore
(2006)
Eisenberg, J. D. 2002 SVG Essentials. 1. O'Reilly &
Associates, Inc.
Gansner, E. R. and North, S. C. 2000. An Open Graph
Visualization System and its Applications to Software
Engineering. Softw. Pract. Exper. 30, 11, 1203-1233.
Haeberli, P. E. 1988. ConMan: A Visual Programming
Language for Interactive Graphics. SIGGRAPH
Comput. Graph. 22, 4 (Aug. 1988), 103-111.
Hanrahan P, Stolte C., Mackinlay J., Tableau Software,
Visual Analysis for Everyone,
http://www.tableausoftware.com/, January 2007.
Heer, J., Card, S. K., and Landay, J. A. 2005. Prefuse: a
Toolkit for Interactive Information Visualization. CHI
'05. ACM, New York, NY, 421-430.
Heer, J., Viégas, F. B., and Wattenberg, M. 2007.
Voyagers and Voyeurs: Supporting Asynchronous
Collaborative Information Visualization. CHI '07.
ACM, New York, NY, 1029-1038.
Kazoun, C. and Lott, J. 2007 Programming Flex 2: the
Comprehensive Guide to Creating Rich Media
Applications with Adobe Flex. O'Reilly Media, Inc.
Mackinlay, J., Hanrahan, P., and Stolte, C. 2007. Show
Me: Automatic Presentation for Visual Analysis.
TVGC’07 13, 6, 1137-1144.
Perer, A. and Shneiderman, B. 2006. Balancing Systematic
and Flexible Exploration of Social Networks.
TVGC’06 12, 5, 693-700
Phan, D., Xiao, L., Yeh, R., Hanrahan, P., and Winograd,
T. 2005. Flow Map Layout. Infovis’05, Washington,
DC, 29.
Pietriga, E. 2006. Semantic Web Data Visualization with
Graph Style Sheets. SoftVis '06. ACM, New York,
NY, 177-178.
SableCC Project: http://sablecc.org/wiki
Stijn van Dongen, Graph Clustering by Flow Simulation.
PhD thesis, University of Utrecht, May 2000.
W3C, 2006. Cascading Style Sheets, April.
http://www.w3.org/Style/CSS/.
STOOG - Style-Sheets-based Toolkit for Graph Visualization
131
