
GlobeOLAP
Improving the Geospatial Realism in Multidimensional Analysis Environment
Vinícius Ramos Toledo Ferraz and Marilde Terezinha Prado Santos
Computer Department, Federal University of São Carlos, Rod. Washington Luiz, km 235, São Carlos, SP, Brazil
Keywords: Thematic Mapping, Geovisualization, SOLAP, Virtual Globes, KML.
Abstract: The combination of Geographic Data Warehouses (GDW) and Spatial OLAP (SOLAP) provide efficient
browsing and storing of very large spatio-temporal databases. However, some advanced techniques of
geovisualization are not well supported in many of these tools. Three-dimensional Thematic Mapping
through Virtual Globes is one of them, and it can provide a friendly but powerful mechanism for summarize
visually huge amounts of geospatial-analytical data and their changes over time. This paper shows the
GlobeOLAP, a prototype of a Web-based SOLAP tool that allows the customized generation of many types
of Thematic Maps to be visualized three-dimensionally in a Virtual Globe (Google Earth), together with the
traditional tabular view. This tool can improve management decisions by allowing managers to identify
patterns and build knowledge in a spatial realistic environment.
1 INTRODUCTION
Storing and browsing efficiently very large
geospatial databases for multidimensional analysis
and decision making can be a challenging task.
Many authors point Geographic Data Warehouses
(GDW) and Spatial On-Line Analytical Processing
(SOLAP) as a good approach (Bédard, 1997; Rivest
et al., 2003; McHugh, Roche, Bédard, 2008; Tao and
Papadias, 2009) to such task. By combining this
mature technology of Business Intelligence with
very useful functionalities from Geographic
Information Systems (GIS), it is possible to provide
a complete and homogeneous platform for decision
support.
The inherent complexity of geospatial data
(Wieczorek and Delmerico, 2009) and its related
decision problems (Andrienko et al., 2007), makes
evident the need of interactive visualization
mechanisms that not only displays data and allows
its browsing but also do it intuitively, making
substantially easier for human beings the pattern
recognition and to build knowledge that will help to
solve real problems (Dykes, MacEachren, Kraak,
2005).
Within a typical GDW-SOLAP approach,
geospatial data have several levels of aggregation
and can be retrieved under many perspectives
through multidimensional analysis. In this case, it is
necessary some particular techniques for
summarizing and presenting, in an organized way,
the results of complex, multidimensional and
geospatial queries.
This work shows the GlobeOLAP, a prototype of
a Web-based SOLAP tool, which is capable of
generating several types of KML-based Thematic
Maps with a high level of customization to be
visualized within a three-dimensional environment
provided by a Virtual Globe. Consequently, decision
makers can experience the advantages of a plausible,
flexible and friendly geospatial analysis
environment.
The remainder of this paper consists of three
main sections. First, in section 2, we discuss some
key concepts together with related works. Next, in
section 3, we present the prototype architecture and
its functionalities through a study case in the domain
of a national education system planning analysis.
Finally, we make some conclusions and discuss
future works.
2 RELATED CONCEPTS
AND WORKS
Essentially, in this section, we try to present some
answers to the following question: “Once geospatial
data are inherently complex and its related problems
99
Ramos Toledo Ferraz V. and Terezinha Prado Santos M. (2010).
GlobeOLAP - Improving the Geospatial Realism in Multidimensional Analysis Environment.
In Proceedings of the 12th International Conference on Enterprise Information Systems - Human-Computer Interaction, pages 99-107
DOI: 10.5220/0002977100990107
Copyright
c
SciTePress

are sometimes difficult to solve through an
automated approach, how can we build
computational tools capable of retrieve and
interactively explore very large geospatial databases,
providing an intuitive, realistic and analytical
environment for efficient decision making?”
2.1 Geographic Data Warehouses and
Spatial On-line Analytical
Processing
The combination of Data Warehouses (DW) and On-
Line Analytical Processing (OLAP) technologies
(Chaudhuri, Dayal, 1997; Inmon, 2002; Kimball and
Ross, 2002; Song, 2009; Abelló and Romero, 2009)
is widely used to establish environments for decision
support that prioritizes efficient querying of huge
amounts of historical, clean and consolidated data.
Frequently, a geospatial perspective is needed
for strategic analysis. A DW that contains geospatial
data is called Geographic Data Warehouse (GDW).
A GDW is generally modeled using one of the
flavors of star schema. This kind of
multidimensional modeling is comprised by a fact
table with one or more measures that can be numeric
or geospatial. The calculation of these measures is
made regarding a set of dimensions of interest.
A GDW can be spatially queried and processed
by a Spatial OLAP (SOLAP) tool that allows easy
and fast exploration of very large geospatial data
repositories and offers a set of visualization
techniques such as maps, tables and diagrams
(Bédard, 1997; Bédard, 2005; Rivest et al., 2005)
Additionally to OLAP operators (e.g. drill-down,
roll-up, slice and dice, pivot and drill across),
different authors have proposed a number of SOLAP
operators. Ruiz and Times (2009) reviewed these
proposals and organized them into a taxonomy.
Siqueira et al. (2009) propose to add one or more
geospatial dimensions to avoid redundancy. Further
reading on GDW modeling strategies can be seen in
Damiani and Spaccapietra (2006), as well as index
structures can be found in Tao and Papadias (2009).
2.2 Virtual Globes as Geobrowsers
The entry point of a SOLAP tool is its graphical
interface. Many authors have been integrating
Geobrowsers to their SOLAP solutions in order to
bring suitable visualization techniques for geospatial
data.
Geobrowser is defined by Craglia et al. (2008) as
a software that offers interactive navigation in a set
of information organized over a geographic space. It
can be seen as the visualization module of a GIS.
Between the free 2D Geobrowser that provide
API for mashup on web applications, stand out
Google Maps (Google, 2010a), Bing Maps
(Microsoft, 2010), Yahoo! Local Maps (Yahoo,
2010) and OpenLayers (OpenLayers, 2010). These
API offer pan, zoom, layer control and exhibition of
detailed information about geospatial objects, plus a
set of services such as geocoding, route calculation
and local search. Most of these API also provide
access to some base layers whose set of tiles has two
main types: street/boundaries maps or remote
sensing images.
However, it is quite known that 2D Geobrowsers
are deficient in portraying dynamic and three-
dimensional phenomena, causing a gap of realism
between the bi-dimensional model and the real
world. Some works have pointed that Virtual Reality
(VR) techniques can help to mitigate this issue,
especially regarding to knowledge construction for
decision making (MacEachren et al., 1999;
MacEachren et al., 2004; Hodza, 2009). VR
provides 3D environments capable of giving to the
users a feeling of "being there", enhancing their
cognitive experience.
Fortunately, there are 3D Geobrowsers such as
Google Earth (Google, 2009b) and NASA World
Wind (NASA, 2010) that uses a three-dimensional
model of the Earth surface, known as Virtual Globe
(Butler, 2006). To overlay this model, the same base
layers of maps and remote sensing images are used,
but now with a new projection which includes an
orientation angle for each tile. Additionally to the
same other functionalities present in 2D
Geobrowsers, we got the camera control to travel
through the space in any desired inclination and to
rotate the virtual globe with ease.
The most popular 3D Geobrowser between
general users is Google Earth because of its ease to
use (Goodchild, 2008). Moreover, there are desirable
functionalities in Google Earth such as access to
user-generated content, high rendering performance,
the resolution of the satellite images and orthophotos
reaching to 1m/pixel in hundreds of places,
visualization of 3D models and orthorectified
volumetrically images.
For developers in particular who want to use
maps in their decision support tools, mashing up
Google Earth API (Google, 2009c) with a web-
based application makes possible to generate
datasets and add them in a georeferenced virtual
reality environment as "custom overlays" of vector
and raster geospatial elements. However, for users in
particular who want to use this realistic environment
for analyzing summarized thematic data and make
ICEIS 2010 - 12th International Conference on Enterprise Information Systems
100

decisions, all mentioned technologies could bring
better results if we add among them a set of
geovisualization techniques.
2.3 Thematic Mapping
The main type of map for analysis of summarized
and contextualized (both geographically and
thematically) data are Thematic Maps (TM).
MacEachren (1979) sees Thematic Cartography as a
representation of the spatial distribution of
phenomena at specific points in time. Therefore, he
states Thematic Cartography as a primary
mechanism of visual communication suggesting that
TM have played substantial influence in knowledge
construction and dissemination.
Slocum et al. (2005) brings an overview of all
aspects of TM, including the set of existing
techniques, its corresponding symbolization
principles and when to use them. All techniques and
symbols supported in this work are discussed in
section 3.
TM are widely used in today’s GIS, but we point
some arguments that suggest TM as powerful
visualization artifacts for GDW/SOLAP
environment. First, any GDW is intrinsically
thematic, since every dimension can be seen as a
theme (e.g. one can say that the transformation of a
query from "sales quantity by product" to "sales
quantity by client" is a theme change). Following,
data can be aggregated in many ways by a number
of (S)OLAP operators which go toward a theme
refining. Finally, the resultsets from these queries
can contain geospatial data (e.g. client's "region"
attribute), thus some TM could be efficiently drawn
in order to allow geospatial-enabled analysis and
decision making.
2.4 Advantages and Issues of the Third
Dimension
The use of Virtual Globes for thematic mapping
brings some technical advantages. Most of 2D
Geobrowsers uses Mercator projection which is a
good choice for mosaics of remote sensing imagery,
but causes area distortions which is bad for thematic
mapping. This issue is partly overcome in Virtual
Globes because of its Perspective Orthographic
projection (Sandvik, 2008). A second point is the
whole new thematic mapping techniques using
volume symbols (Slocum et al., 2005) that a three-
dimensional environment allows, such as Prism
maps.
Combining three-dimensional thematic mapping
and Virtual Globes for analytical purposes are an
emergent approach, and some authors raise potential
issues to be addressed. Goodchild (2008) warns that
overlaying Virtual Globes with survey and census
statistics may produce confusing hybrids of the
visual and symbolic, which is also pointed by
Monmonier (1996) when he claims that any map
must omit all non-essential features. Shepherd
(2008) remembers that this is an old discussion
among researchers and cites the varying of scale
caused by perspective visualization, which
prejudices the volume estimation by humans and,
consequently, the comparison among volume
symbols.
On the other hand, Shepherd raises advantages of
the three-dimensional mapping, such as: (1) a richer
environment where symbols are more detailed and
there is more space for information on the same
display; (2) possibility of extruding areas to
emphasize and to detail a traditional visual variable
(see the second example in section 3.2) or to
introduce a new one; (3) possibility of resolving the
problem of symbol occlusion more efficiently than
in 2D maps (e.g. by adding transparency and
spinning the globe); and finally, (4) providing a
familiar environment for complex analysis, by
taking advantage of the user's intimacy with the
Earth shape, then providing a convenient and
intuitive cognitive experience. Tiede and Lang
(2010) also point such familiarity and conducted
case studies with three-dimensional symbols for
analytical-geospatial data, concluding that
unfamiliar scientific content can be grasped more
directly by simple embedding it in a seamless
geospatial context.
This work was conducted considering such
discussion and partial solutions to these problems, as
well as its advantages can be seen at sections 3.2 and
section 4. Furthermore, three-dimensional thematic
mapping through Virtual Globes is not a natural
evolution or the state-of-art of digital mapping, but
actually one additional and useful functionality in
mapping tools, including SOLAP solutions, which
existing implementations we discuss briefly in the
next section.
2.5 Related Works on Geovisualization
in SOLAP Tools
There are several proposals, prototypes and full
SOLAP tools, including both free and commercial
final products that are already established in
Business Intelligence market. Each one of these
tools has its own innovations, strengths and
weakness. We will discuss briefly these tools.
GlobeOLAP - Improving the Geospatial Realism in Multidimensional Analysis Environment
101
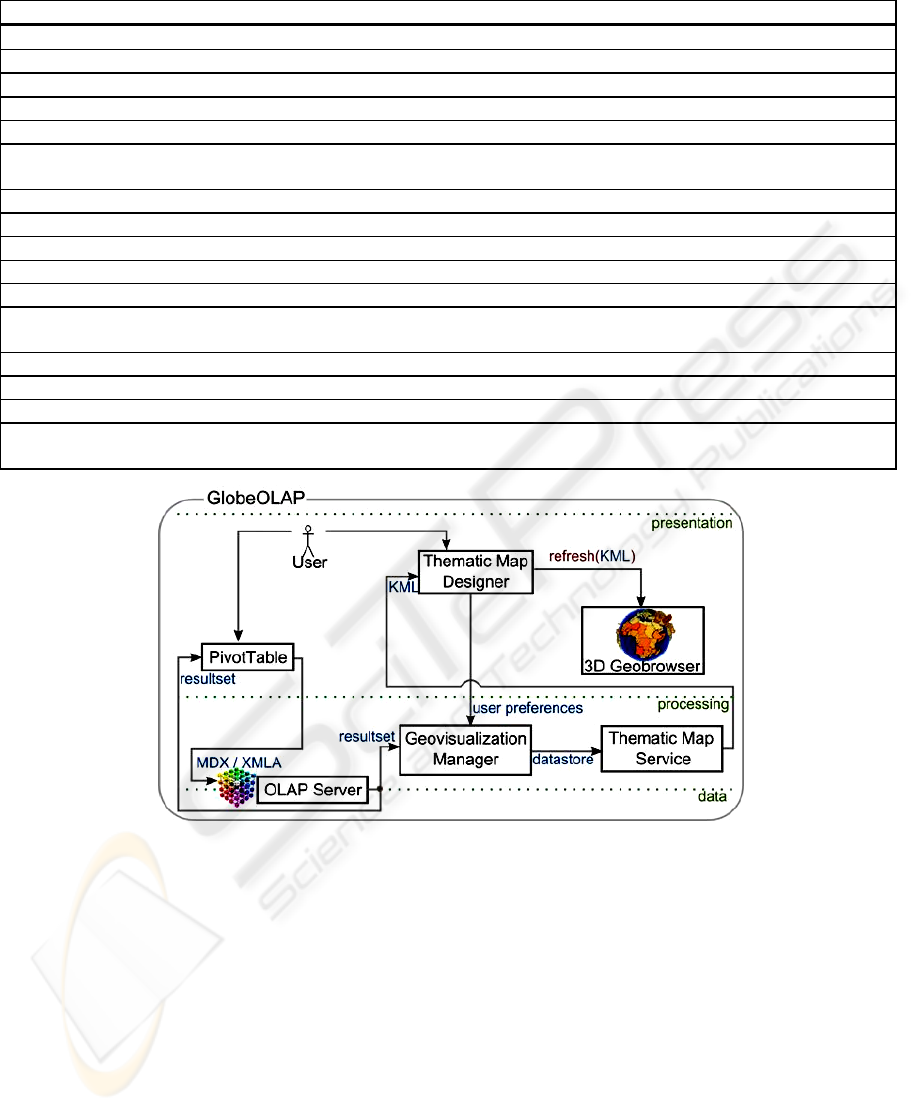
Table 1: Comparison of existing SOLAP tools.
Authors Tool name Platform Geobrowser Geovisualization techniques
Han et al. (1997)
GeoMiner Desktop 2D
Simple
Shekhar et al. (2000) Map Cube Desktop 2D Simple, choropleth and multimap
Stolte et al. (2002)
Rivet Desktop 2D
Simple and choropleth
Fidalgo et al. (2004) GMLA WS Client Web 2D Simple
Scotch and Parmanto (2005) SOVAT Desktop 2D Simple and choropleth
Rivest et al. (2005)
JMap® Spatial
OLAP Extension
Desktop 2D
Simple, choropleth, proportional symbol,
multimap
Colonese et al. (2005) PostGeoOlap Desktop 2D Simple
Bimonte et al. (2007) GeWOlap Web 2D Simple, choropleth, bar, pie
Compieta et al. (2007) - Desktop 3D Simple, remote sensing and complex vectors
Silva et al. (2008) WebGeoOlap Web 2D Simple and remote sensing
Di Martino et al. (2009) GooLAP Web 3D Simple, remote sensing, 3D-bar, pie
Pentaho
Pentaho Google
Maps Dashboard
Web 2D
Simple, colored point
ESRI OLAP for ArcGIS Desktop 2D Simple, bars
JRubik JRubik Web 2D Simple, bars
SpatialAnalytics SOLAPLayers Web 2D Simple, choropleth
GlobeOLAP Web 3D
Simple, remote sensing, choropleth, prism,
bar and custom proportional symbols
Figure 2: An overview of GlobeOLAP architecture.
The GeoMiner tool, introduced by Han et al. (1997),
allows OLAP operations over GDW and includes an
efficient method for materialization of geospatial
datacubes. Map Cube, a data operator proposed by
Shekhar et al. (2000), generates galleries of maps as
visualization method for a given set of aggregated
geospatial data. Stolte et al. (2002) developed the
Rivet tool which focuses in multiscale visualization
for generating abstract overviews of data in a GDW.
Scotch and Parmanto (2005) presented SOVAT, an
effort to implement new SOLAP operators so that
both geospatial and numeric aggregations can be
performed. Compieta et al. (2007) investigates VR
and SOLAP integration for building simulation
environments of climate phenomena with complex
vectors.
Recently some works focused in Web-based and
distributed SOLAP tools. Fidalgo et al. (2004)
proposed OLAP and GIS bridges through GMLA
Web Services. Bimonte et al. (2006) developed
GeWOlap which are also based on open source
tools. Silva et al. (2008) made a Web mashup with
Google Maps in their WebGeoOlap tool which
kernel are based on PosGeoOlap tool from Colonese
et al. (2005). Di Martino et al. (2009) presented a
Web-based prototype of SOLAP tool that makes use
of existing well-established modules such as
Mondrian OLAP Server, JPivot and Google Earth as
geobrowser.
ICEIS 2010 - 12th International Conference on Enterprise Information Systems
102

There are also final products which aim to bring
some SOLAP functionalities to users of DW/OLAP
software packages. Among commercial solutions,
Rivest et al. (2005) presented JMap® Spatial OLAP
Extension, one of the most complete existing
SOLAP tools with regard to the set of SOLAP
operators and geovisualization techniques provided.
Pentaho Google Maps Dashboard (Pentaho, 2010a)
is part of an open-source and commercial package
for Business Intelligence which allows to plot
colored point symbols reflecting localizations of
objects of interest and a numerical measure
regarding them. Yet another commercial tool is
OLAP for ArcGIS (ESRI, 2010). Among free and
open-source solutions, SOLAPLayers
(Spatialanalytics, 2010) is a web mapping client for
exploring geospatial data cubes and create
choropleth maps. Finally, JRubik (JRubik, 2010) has
a SOLAP module that allows creating bar chart
maps.
An overview of geovisualization capabilities of
all cited works are summarized in Table 1. Besides
the obvious transition for Web-based SOLAP tools,
it is possible to see that the use of Virtual Globes in
SOLAP tools is quite rare. Furthermore, the use of
three-dimensional thematic maps for
multidimensional exploration was practically
unexplored in literature. This motivated us to
investigate the potential of combining such
technologies. The main result is a SOLAP tool
prototype called GlobeOLAP.
3 THE GlobeOLAP PROTOTYPE
This section is dedicated to the GlobeOLAP system
prototype. We will discuss its architecture;
enumerate its functionalities of analytic
geovisualization and how they can improve decision
support solutions. Some issues are also discussed
along this section.
3.1 Architecture
The chosen architecture preserves the possibility of
changing the Geobrowser or even the OLAP server,
with low additional refactoring cost. A three-tier
approach was applied. Each tier comprises a set of
modules based on open standards. Figure 2 shows an
overview of the architecture, where all modules are
presented following SADT notation for better
comprehension of the information flow.
3.1.1 Presentation Tier
The main role of this tier is to provide some of the
interactive visualization techniques considered in
this work. In order to achieve this goal, we designed
the following modules:
a. Pivot Table: Shows resultsets in a tabular
view and allow dynamic modification of the query
through interactive OLAP operations and an ad hoc
Multi-Dimensional eXpressions (MDX) query
editor. In our prototype we used JPivot (JPivot,
2010).
b. 3D Geobrowser: A Virtual Globe capable of
rendering three-dimensional and animated thematic
maps. We choose Google Earth API (Google,
2010c) which consists of a Web browser plug-in and
a set of JavaScript libraries for custom overlaying of
the globe with thematic data.
c. Thematic Map Designer: Allows user to set
their thematic mapping preferences (e.g. color scale,
classification method, TM type, among other
Thematic Cartography project decisions).
3.1.2 Processing Tier
The Processing Tier is responsible for processing
requests from Presentation Tier and generation of
resultsets and thematic maps. The modules are
following:
a. OLAP Server: This module has both
Processing Tier and Data Tier components since
existing OLAP Servers such as Mondrian (Pentaho,
2009b) perform internally the MDX query parsing
and also handle with database connection drivers.
Subsequently, the OLAP Server receives a response
from DBMS which include analytical and geospatial
data, so that a resultset can be formatted. Finally,
this module sends it simultaneously to the Pivot
Table and to Geovisualization Manager.
b. Geovisualization Manager: Behaves as an
interface between 3D Geobrowser, Thematic Map
Designer and OLAP Server. As soon as it receives a
new resultset from OLAP Server, this module
merges user preferences with the resultset into a data
store which is then encapsulated within a REST
(Fielding and Taylor, 2002) request for the Thematic
Map Service. Once TM is generated, it is sent to
Thematic Map Designer.
c. Thematic Map Service (TMS): This module is
a standardized geospatial Web service, more
precisely a Web Processing Service (WPS) (OGC,
2007). TMS has a mandatory Execute() operation
which receives as parameter the request containing
the encapsulated data store. After extracting this data
store, TMS has all data needed (user preferences,
GlobeOLAP - Improving the Geospatial Realism in Multidimensional Analysis Environment
103
summarized data and geospatial data) for generating
a Thematic Map.
The kernel of the modules TMS and Thematic Map
Designer is a generation engine of KML-based
Thematic Maps, adapted from Sandvik (2008).
3.1.3 Data Tier
Data Tier is comprised of some of the modules from
the OLAP Server that derivate SQL queries from
MDX and XML mappings between dimensional
model and physical model of the GDW. The other
module in this tier is the GDW itself and its DBMS
hosting.
3.2 Study Case
In order to set an evaluation for our proposal, we
implemented an instance of GlobeOLAP
architecture for the domain of a national education
system planning. This study case was conducted
under the context of a larger project called
WebPIDE, which main goal is integrating several
heterogeneous databases containing real data from a
set of national evaluations applied by the Brazil’s
Ministry of Education.
We choose a test called SAEB (Evaluation
System for Basic Education) which is applied every
two years for 4
th
and 8
th
grades for basic education
and 3
rd
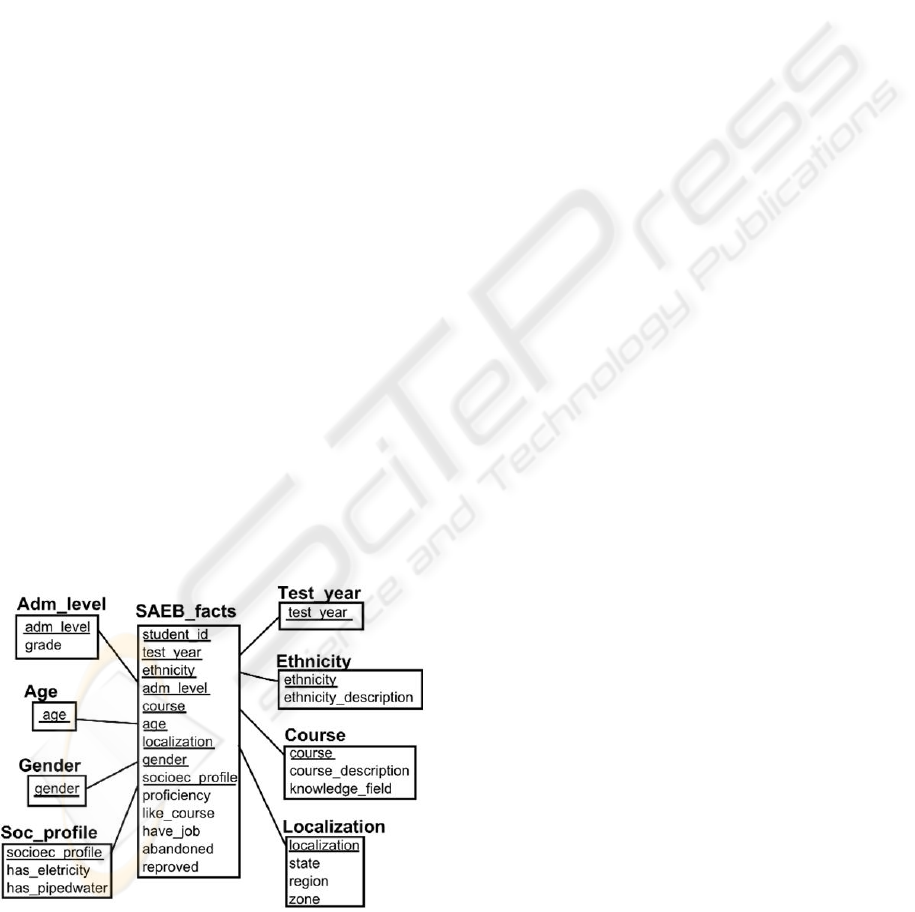
grade for high school students. We built a
GDW which included cleanup analytical data
extracted from the original dataset. Figure 3 shows
its schema. GDW was modelled using a star schema
and a geospatial dimension (geometry attributes
were omitted).
Figure 3: The GDW proposed for the SAEB tests.
Writing an XML schema and loading it on
Mondrian, it is allowed the tabular view of the data
through JPivot and the execution of OLAP operators
for multidimensional exploration.
By slicing ‘Test Year=2003’, choosing
Localization as column and Avg Proficiency as a
measure, we can answer the following question:
“Which are proficiency average the students have in
each state in 2003?” By the end of these OLAP
operations, a choropleth Thematic Map is rendered
in the geobrowser, as can be seen in Figure 4. The
map shows evidence of the better proficiency of
students from the southern and south states of the
country.
The user is allowed to choose, at any time,
different colour scales, classifications methods,
thematic mapping techniques, types of labels, among
other settings. For instance, let us choose Prism
map, setting a max height of ‘600000’. In this case,
the polygons of are proportionally raised up
according to the chosen measure, as we can see in
Figure 5.
Height and colour are used as visual variables for
the same measure to emphasize it and to allow the
appearance of some detail such as height difference
between polygons classified with the same colour.
When such difference becomes too high, despite the
"emphasizing factor" works even better, a potential
issue with prism maps shows up: there is possibility
of visual occlusion of lower areas by taller prisms.
Setting suitable max height is important to avoid it.
It is also important to choose a suitable
transparency for the map, so that it can be more
opaque when no other prism or volume symbol is
hidden, less opaque in the contrary, or substantially
transparent when other features or lower layers are
useful in the analysis.
Moreover, the presence of labels, legend and
descriptions in the map help users with some
difficulty with estimation of volumes and with the
lack of a “zero point” while spinning the globe (and
consequently, rotating polygons and prisms).
4 CONCLUSIONS AND FUTURE
WORK
It is possible to use three-dimensional Thematic
Maps and Virtual Globes for geospatial-enable
visualization of multidimensional queries. It can
make easer for managers to summarize and analyze
huge amounts of data and make faster decisions.
Some issues still need to be addressed such as the
world mapping become prejudiced in a Virtual
Globe, since only half of the world is visible at once.
ICEIS 2010 - 12th International Conference on Enterprise Information Systems
104
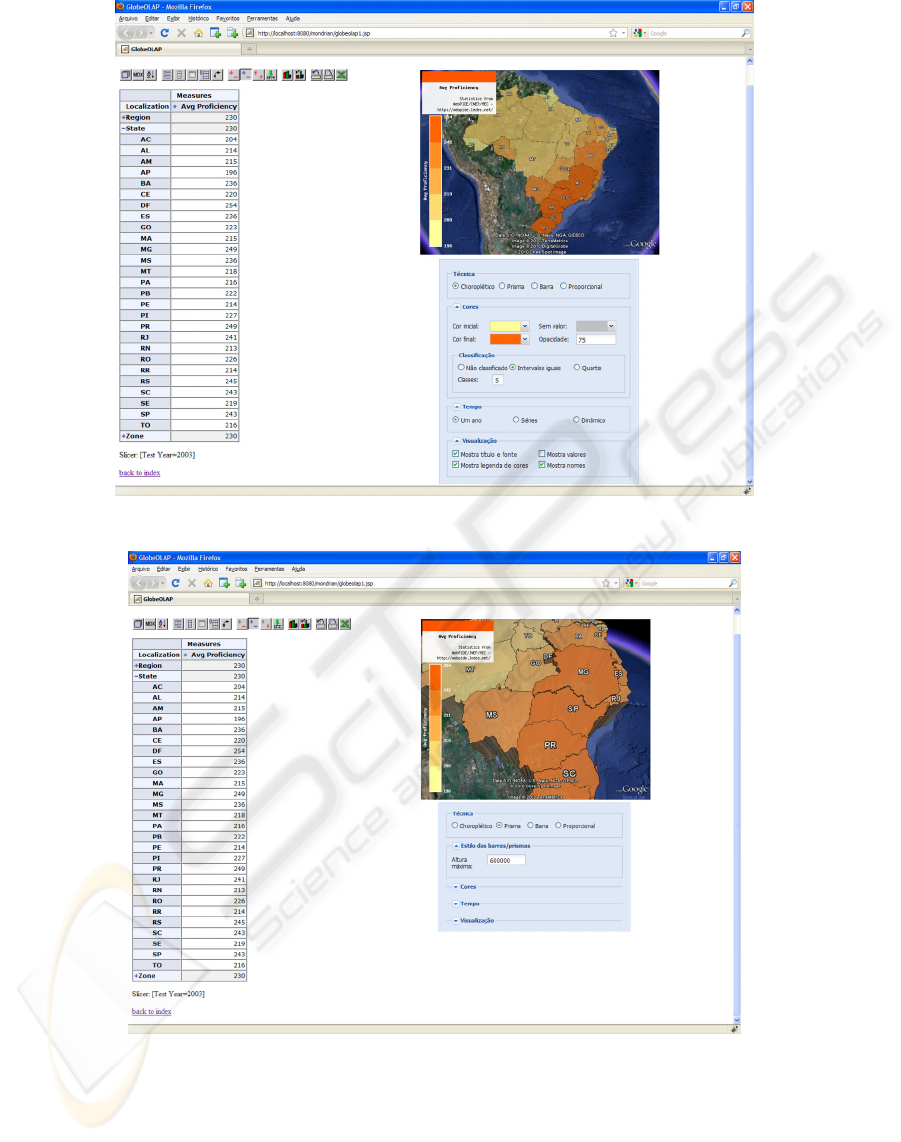
Figure 4: GlobeOLAP showing results in a choropleth thematic map.
Figure 5: GlobeOLAP showing results in a prism thematic map.
In future work we will to use two side-by-side
Virtual Globes to overcome this situation. Pie chart
thematic maps will also take place on GlobeOLAP.
The GlobeOLAP prototype demonstrated to be very
customizable, bringing a high level of
personalization for most of the common Thematic
Cartographic Project decision.
The main idea of this work was tested against real
data and users reports will help to define further
future improvements.
GlobeOLAP - Improving the Geospatial Realism in Multidimensional Analysis Environment
105

ACKNOWLEDGEMENTS
We thank CAPES and INEP for providing funds to
the WebPIDE project under the Education
Observatory grant, as well as data for the case study.
We also thank FAPESP and CNPq for supporting
correlated projects which converged to this work.
REFERENCES
Abelló A., Romero, O. (2009) On-Line Analytical
Processing. In Liu L., Özsu M. T. (Ed.), Encyclopedia
of Database Systems (Vol. 20, pp. 2731-2735). Berlin:
Springer.
Andrienko G. et al. (2007). Geovisual analytics for spatial
decision support: Setting the research agenda.
International Journal of Geographical Information
Science, 21(8), 839-857. doi:10.1080/
13658810701349011
Bédard, Y., (1997). Spatial OLAP. In Geomatics IV,
Annual Forum on R&D. Canadian Institute of
Geomatics.
Butler, D. (2006). Virtual globes: The web-wide world.
Nature, (439), 776-778. doi:10.1038/439776a
Bédard , Y. et al. (2005). Merging Hypermedia GIS with
Spatial On-Line Analytical Processing: Towards
Hypermedia SOLAP. In Stefanakis, E. et al. (Ed.),
Geographic Hypermedia (Lecture Notes in
Geoinformation and Cartography), 167-187. Berlin:
Springer. doi: 10.1007/978-3-540-34238-0
Bimonte, S. et al. (2006). GeWOlap: A Web Based Spatial
OLAP Proposal. In Second International Workshop on
Semantic-based Geographical Information Systems.
Springer-Verlag.
Chaudhuri S., Dayal, U. (1997). An overview of data
warehousing and OLAP technology. ACM SIGMOD
Record, 26(1), 65-74. http://doi.acm.org/10.1145/
248603.248616
Colonese, G. et al. (2004). PostGeoOlap: an Open-Source
Tool for Decision Support. In II Brazilian Symposium
on Information Systems.
Compieta, P. et al. (2007). Exploratory spatio-temporal
data mining and visualization. Journal of Visual
Languages and Computing, 18, 255-279.
doi:10.1016/j.jvlc.2007.02.006
Craglia et al., Next-Generation Digital Earth. (2008)
International Journal of Spatial Data Infrastructures
Research, 3, 146-167.
Dykes, J., MacEachren, A. M., Kraak, M. (2005).
Exploring Geovisualization. Amsterdam: Elsevier.
da Silva, R. O. L., Manhães, R. S., Gitahy, P. F.
WebGeoOlap: Visualização de dados
multidimensionais e geográficos para ambiente web.
Revista de Sistemas de Informação, 1. FSMA.
Damiani, M. L., and Spaccapietra S. (2006). Spatial Data
Warehouse Modeling. In Darmont, J. & Boussaid, O.
(Ed.), Processing and Managing Complex Data for
Decision Support (pp. 1-27). IDEA Group Publishing.
Di Martino, S. et al. (2009). Integrating Google Earth
within OLAP Tools for Multidimensional Exploration
and Analysis of Spatial Data. Enterprise Information
Systems (LNBIP), 24, 940-951. doi:10.1007/978-3-
642-01347-8_78
ESRI (2010). OLAP for ArcGIS. Retrieved February 22,
2010, from http://www.esri.com/software/arcgis/
extensions/olap/
Fidalgo, R. N. et al. (2004). Providing Multidimensional
and Geographical Integration Based on a GDW and
Metamodels. In SBBD’2004, XIX Brazilian
Symposium on Databases. SBC.
Field, R. T. and Taylor, R. N. (2002). Principled design of
the modern Web architecture. ACM Transactions on
Internet Technology (TOIT), 2(2), 115-150.
http://doi.acm.org/10.1145/514183.514185.
Goodchild, M. F. (2008). The use cases of digital earth.
International Journal of Digital Earth, 1(1), 31–42.
Taylor & Francis. doi:10.1080/17538940701782528
Google (2010a). Google Maps API. Retrieved February
22, 2010, from http://code.google.com/apis/maps/
Google (2010b). Google Earth. Retrieved February 22,
2010, from http://earth.google.com/
Google (2010c). Google Earth API. Retrieved February
22, 2010, from http://code.google.com/apis/earth/
Han, J., Kopersky, K., Stefanovic, N. (1997). GeoMiner:
A System Prototype for Spatial Data Mining. ACM-
SIGMOD Int. Conf. Management of Data. New York:
ACM Press.
Hodza, P. (2009). Evaluating User Experience of
Experiential GIS. Transactions in GIS, 13(5-6), 503-
525. Blackwell Publishing. doi:10.1111/j.1467-
9671.2009.01176.x
Inmon, W. H. (2005). Building the data warehouse (4th
ed.). New York: John Willey and Sons.
JPivot (2010). JPivot. Retrieved February 22, 2010, from
http://jpivot.sourceforge.net/
JRubik (2010). Introduction to JRubik. Retrieved February
22, 2010, from http://rubik.sourceforge.net/jrubik/
intro.html
Kimball, R. and Ross, M. (2002). Data Warehouse Toolkit
(2nd ed.). New York: John Willey and Sons.
MacEachren, A. M., (1979). The evolution of thematic
cartography: A research methodology and historical
review. Canadian Cartographer, 16, 17-33.
MacEachren, A. M. et al. (1999). Virtual environments for
geographic visualization: potential and challenges.
New Paradigms in Information Visualization and
Manipulation, 35-40. New York: ACM Press.
MacEachren, A. M. et al. (2004). Geovisualization for
Knowledge Construction and Decision Support. IEEE
Computer Graphics and Applications, 24(1), 13-17.
Los Alamitos: IEEE Computer Society Press. doi:
10.1109/MCG.2004.1255801
McHugh, R., Roche, S., Bédard, Y. (2008). Towards a
SOLAP-based public participation GIS. Journal of
Environmental Management, 90(6), 2041-2054.
doi:10.1016/j.jenvman.2008.01.020
ICEIS 2010 - 12th International Conference on Enterprise Information Systems
106

Microsoft (2010). Bing Maps Platform. Retrieved
February 22, 2010, from http://www.microsoft.com/
maps/developers/
Monmonier, M. (1996). How to Lie with Maps (2nd ed.).
Chicago: The University of Chicago Press
NASA (2010). NASA World Wind. Retrieved February 22,
2010, from http://worldwind.arc.nasa.gov/java/
OGC (2007). The OpenGIS® Web Processing Serivce.
Retrieved February 22, 2010, from
http://www.opengeospatial.org/standards/wps/
OpenLayers (2010). OpenLayers: Free Maps for the Web.
Retrieved February 22, 2010, from
http://openlayers.org/Pentaho (2010a). Pentaho
Google Maps Dashboard Technical Overview.
Retrieved February 22, 2010, from
http://community.pentaho.com/google_maps/
Pentaho (2010a). Pentaho Google Maps Dashboard.
Retrieved February 22, 2010, from
http://community.pentaho.com/google_maps/
Pentaho (2010b). Pentaho Analysis Services: Mondrian
Project. Retrieved February 22, 2010, from
http://mondrian.pentaho.org/
Rivest, S., Bédard, Y., Proulx, M. J., Nadeau, M. (2002) .
SOLAP: A new type of user interface to support
spatio-temporal multidimensional data exploration and
analysis. In Proceedings of the ISPRS Joint Workshop
on Spatial, Temporal and Multi-Dimensional Data
Modelling and Analysis.
Rivest, S. et al. (2005). SOLAP technology: Merging
business intelligence with geospatial technology for
interactive spatio-temporal exploration and analysis of
data. ISPRS Journal of Photogrammetry & Remote
Sensing, 60, 17-3. doi:10.1016/j.isprsjprs.2005.10.002
Ruiz C. V., Times, C. V. (2009) A Taxonomy of SOLAP
Operators. In SBBD’2009, XXIV Brazilian Symposium
on Databases. SBC.
Sandvik, B. (2008). Using KML for Thematic Mapping.
M.Sc. in Geographical Information Science.
University of Edinburgh (dissertation).
Shekhar, S. et al (2000). Map Cube: A Visualization Tool
for Spatial Data Warehouses. In Miller, H. J. and Han,
J. (Ed.), Geographic Data Mining and Knowledge
Discovery, 73-108. New York: Taylor & Francis.
Shepherd, I. D. H. (2008). Travails in the Third
Dimension: A Critical Evaluation of Three-
Dimensional Geographical Visualization. Geographic
Visualization (pp. 199-222). New Jersey: John Wiley
& Sons.
Schotch, M., Parmanto, B. (2005). SOVAT: Spatial OLAP
Visualization and Analysis Tool. In 38th Hawaii
International Conference on System Sciences.
Siqueira, T. L. L. et al. (2009). The impact of spatial data
redundancy on SOLAP query performance. Journal of
Brazilian Computer Society, 15(2). Campinas: SBC.
doi:10.1590/S0104-65002009000200003
Slocum, T. A. et al. (2005). Thematic Cartography and
Geographic Visualization (2nd ed.). Upper Saddle
River, NJ: Pearson Prentice Hall.
Song, I. Data Warehouse. In Liu L., Özsu M. T. (Ed.),
Encyclopedia of Database Systems (Vol. 1, pp. 2731-
2735). Berlin: Springer.
Spatialanalytics (2010). SOLAPLayers. Retrieved
February 22, 2010, from http://www.spatialytics.org/
projects/solaplayers/
Stolte, C., Tang, D., Hanrahan, P. (2002). Multiscale
Visualization Using Data Cubes. IEEE Transactions
on Visualization and Computer Graphics, 9(2), 176-
187. doi: 10.1109/TVCG.2003.1196005
Tao, Y., Papadias D. (2009). Spatio-Temporal Data
Warehouses. In Liu L., Özsu M. T. (Ed.),
Encyclopedia of Database Systems (Vol. 1, pp. 2731-
2735). Berlin: Springer.
Tiede, D., Lang, S. (2010). Analytical 3D views and
virtual globes – scientific results in a familiar spatial
context. ISPRS Journal of Photogrametry and Remote
Sensing [in press].
Wieczorek, W. F., Delmerico, A. M. (2009). Geographic
information systems. Wiley Interdisciplinary Reviews:
Computational Statistics, 1(2), 167-186.
doi:10.1002/wics.21
Yahoo (2010). Yahoo! Maps Web Services API. Retrieved
February 22, 2010, from http://
developer.yahoo.com/maps/
GlobeOLAP - Improving the Geospatial Realism in Multidimensional Analysis Environment
107
