
PERIPHERAL VISION PATTERN DETECTION DYNAMIC TEST
João P. Rodrigues, João D. Semedo, Fernando M. Melicio
Institute Systems and Robotics, Technical University, Av Rovisco Pais 1 TN6.21, Lisbon, Portugal
Agostinho C. da Rosa
Laseeb-System and Robotics Institute, Technical University, Lisbon, Portugal
Keywords: Pattern Recognition, Peripheral Vision, Foveal Vision, Electrooculogram.
Abstract: This work proposes a test that evaluates how well a subject can recognize and relate objects in the
peripheral and foveal field while focused on some different task and how well this subject can make
decisions based on this visual information. Although there exist a few peripheral vision tests in
ophthalmology for checking the homogeneity and the reach of the vision field, these professional or clinical
grade tests need a fixing or resting system to immobilize the head and also to instruct to the subject to gaze
on a reference point. This test doesn’t evaluate the homogeneity of the visual field alone but also how well
the information that is visually acquired is processed. Automatic detection of ocular movement is used to
separate the results due to peripheral vision from those due to central vision. This test was applied to twelve
junior soccer players and successfully identified those that used more peripheral vision, eye scanning or
those that didn’t want to collaborate and clicked randomly.
1 INTRODUCTION
The aim of this work was to develop a test that
evaluates peripheral vision and how well it is used
by athletes. Although peripheral field of vision tests
are already available and can accurately measure the
peripheral field of vision, they give no information
about how this extra information is used. On the rare
attempts to do so, there was no care in assuring that
the test subjects were really using their peripheral
vision and not performing eye scanning. This, added
to the fact that decisions based in the peripheral
visual field is one of the most decisive skill in the
performance of some professional athletes, lead to
development of a test platform able to efficiently
infer about the quality of this skill.
1.1 Peripheral Vision
The human eye is constituted by some major
components: cornea, iris, pupil, lens, retina, macula,
optic nerve, choroid and vitreous. For the purpose of
this article it is interesting to take a closer look at the
retina and its relation to the peripheral vision.
The retina is a nerve layer lining the back of the eye
composed by rods and cones, two types of
photosensitive cells. Cones concentrate around the
fovea and are responsible for color vision. The need
to look directly at an object to sharpen the vision
results from the positioning of cones in the retina, as
this movement centers de image on the fovea -
foveal vision.
The peripheral vision is mostly due to the rods,
which are equally distributed around the retina, with
the exception of the fovea, where only cones are
present. Rods are very light-sensitive, working
mostly at low intensities of light, as they become
saturated in normal day conditions. They do not
distinguish color and one of their most important
features is the capability of motion detection.
Although there is a higher percentage of rods than
cones in the area of the eye responsible for the
peripheral vision, there still is color information in
this perception but not so evident. Besides lower
color information, peripheral vision also lacks of
spatial resolution, when compared to foveal vision.
The fact that foveal vision field richer in color and
resolution may lead to a frequent underestimation
and waste of the peripheral vision field by most
242
P. Rodrigues J., D. Semedo J., M. Melicio F. and C. da Rosa A. (2010).
PERIPHERAL VISION PATTERN DETECTION DYNAMIC TEST.
In Proceedings of the 12th International Conference on Enterprise Information Systems - Human-Computer Interaction, pages 242-247
DOI: 10.5220/0002977402420247
Copyright
c
SciTePress

people. However, its characteristics suggest that it
can play a crucial role in different types of tasks and
taking it into account can be beneficial.
1.2 Objectives
The objective of this work was to develop a reliable
test to determine how well a subject can recognize
and relate objects in the peripheral and foveal field
while focused on some different task. In other
words, the test should measure how well a subject
can be aware of his surroundings. This objective is
because the target subjects of this test are mostly
athletes (in this study, soccer players) that benefit
from this skill. In soccer or basketball for example,
this skill is of the utmost importance while players
dribble along the field, focused on their dribble and,
at the same time, distinguishing their team mates
from the opponents or from the referee, choosing
which team mate to pass, acknowledging field
contours or targeting the goal. This way, it is
important that this test accomplishes the following
requirements:
• Display test images for the peripheral visual
field.
• Display test images for the foveal visual field.
• Ask the subject for some response when a certain
relation between the test images is met.
• Engage the subject in some task other than
distinguishing the test images at the same time.
• Score the subjects performance in the test.
• Distinguish a response due to peripheral vision
from eye scanning.
This last point is decisive for the quality of the
results because it is possible that a subject eye scans
the objects meant for the peripheral visual field thus,
seeing them with the foveal visual field. This would
violate the main objective of this test that is about
how well the information present in peripheral and
foveal visual fields is processed and related.
Moreover, peripheral vision is probably the most
important factor responsible for a players orientation
in the field (Levi et al., 2002).
2 PLATFORM
There exist a few peripheral vision tests in
ophthalmology for checking the homogeneity and
the reach of the vision field. These tests needs a
fixing system to immobilize the head and also
instruction to the subject not to gaze on a reference
point. Since the peripheral vision is a perceptual
function, its assessment needs feedback from the
subject self evaluation which is not reliable or more
convenient through an indirect but objective
response. In order that only peripheral vision is
being used the experimenter has to control the
existence of eye scanning by visual inspection.
Initial works by Stiles measured the sensitivity to
background lights with different wavelengths (Stiles,
1959) and lead to the emerging of new automated
tests later called by Short Wavelength Automated
Perimetry (SWAP). This test can be used to detect
visual field loss in patients with glaucoma but still
has the limitation of subjective observation of eye
movement (Johnson et al., 1993).
In this work we proposed a simple test system based
on a PC with a large screen for visual test delivery,
but with an acquisition hardware and biologic
amplifier for acquiring the electrooculogram (EOG),
giving priority to the detection of horizontal
scanning. Although different colors and shapes are
stimulating the peripheral visual field, determining
the individual thresholds for each wavelength is not
in the scope for this test. This, and the fact that eye
scanning can be detected, distinguishes this test from
the previous. It is not supposed to be a medical
diagnostic test but a way to measure information
processing from different visual fields.
2.1 Test Structure
The general screen layout of the test is shown in
Figure 1. It consisted of a flat LCD screen (size 102
cm in diagonal) and the subject is seated in front of
it at a distance of 53 cm. This setup ensures a
horizontal vision angle of 60º and a vertical vision
angle of 33.75º.
Figure 1: Test screen. The objects at the vertices should be
captured by peripheral vision.
PERIPHERAL VISION PATTERN DETECTION DYNAMIC TEST
243
The test screen has four objects in each corner and a
central object moving slowly. The stimuli are
composed by different set of objects with a
programmed duration or persistence. The sequence
of stimulus is completely programmable by a script
file that can be loaded into the system prior to the
session starts.
There are two types of stimulus: the target stimulus
is when the screen shows simultaneously at least
three equal objects (including the center one). In
order to ensure a sixty degree the target stimulus has
always at least one object in the left and right side of
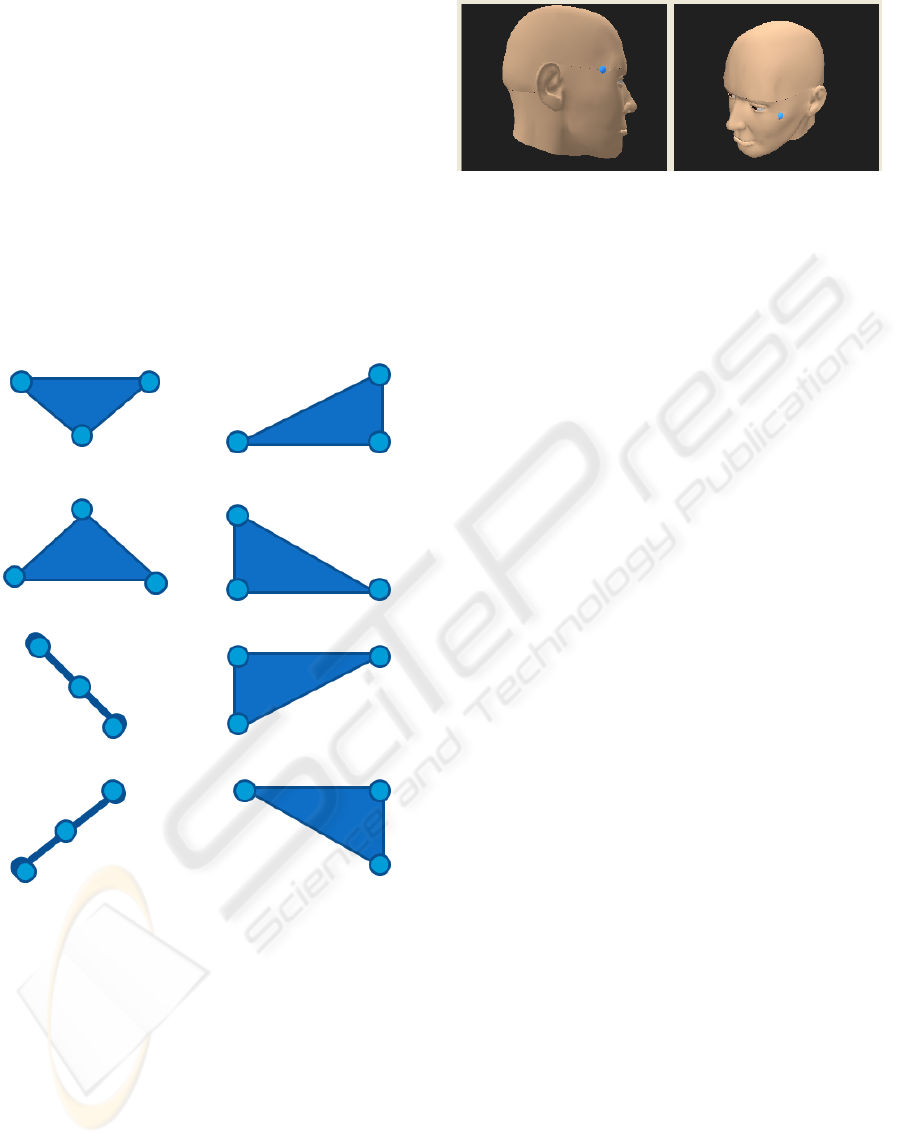
the screen. Figure 2 represents the possible target
configurations where the circles represent each
object.
Figure 2: All possible configurations of objects that
produce a target stimulus in the test.
In order to distinguish between responses with or
without eye scanning the asymmetric outer cantus
montage is used (see Figure 3). This particular
montage configuration allows the capture of both
horizontal and vertical eye movements and due to
this specific placing it is more sensitive in the
Horizontal axis than the vertical one allowing to
filter out the eye blinks artifacts, mostly due to eye
blinks that are dominated by vertical components.
In order to engage more, the test subject has to
control a mouse pointer, tracking the central object
and click on it whenever a target stimulus is
Figure 3: One eye electrode is placed 0.5 cm below the
outer canthus, and the other electrode is placed 0.5 cm
above the outer canthus of the other eye. Differential field
effects of the retina-to-cornea dipoles recorded in these
opposing electrodes provide data on the types of eye
movements (Gerla et al., 2009).
perceived. Thus, the subject’s response can result in
a click or not.
To start each test, the user has to click in the start
button, located in the upper left corner. The test
begins two seconds after the click. The EOG that
results from looking at the start button and looking
back to the central object again can be used for
calibration of an EOG detection algorithm. There is
also the possibility of pause the test.
2.2 Eye Scanning Detection
The presence of eye scanning during tests is
determined by the information present in the EOG
channel. Eye movements are captured by the
asymmetric outer cantus montage explained
previously before being amplified. The amplified
signal is then digitalized at a rate of 250 Hz and sent
to the laptop where the test is running, via USB
protocol, and recorded. There was no need for
online EOG detection in this study because it was
not planned to give feedback about it to the test
subjects. However, every event that occurred during
the test is attached to the recorded signal (see Figure
4) so that later it can be processed by any EOG
detection algorithm. This is a better alternative
because only raw data about the test is saved,
together with the EOG. Further processing is done
offline.
2.2.1 EOG Detection Algorithm
The EOG detection algorithm developed for this test
was meant to be simple and did not take into account
de direction of the eye movement (there is no
distinction between left, right up or down eye
movement). Nevertheless, because the raw data of
the test session is available, it is possible to use an
algorithm that distinguishes these movements to
ICEIS 2010 - 12th International Conference on Enterprise Information Systems
244
determine what was the object in the test that was
being scanned with the foveal vision field.
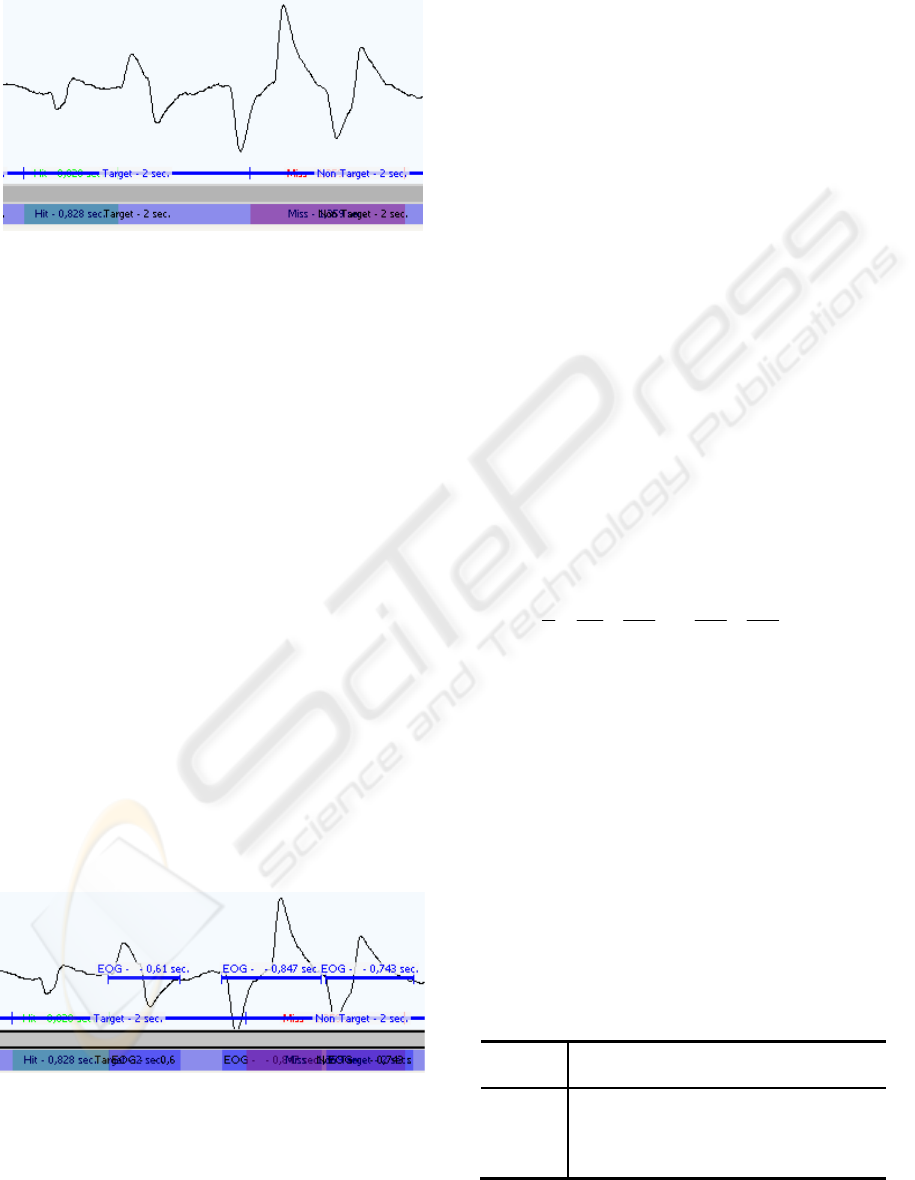
Figure 4: Signal labeled with the events that occurred
during the test. The subject clicked 829 ms after the target
stimulus and clicked again 1359 ms after non target
stimulus.
For calibration sample, the developed algorithm can
use the signal in the initial seconds of the test where
the subject clicks the start button, any pre-selected
region or the entire signal. Both calibration sample
and the test signal to be processed are filtered by a
low pass filter with a 5 Hz cut off frequency. Then,
the absolute maximum max of the calibration sample
is determined (there is no need to distinguish the
direction of the movement) and the test signal is
normalized by this value. Signal extremes are found
when the first derivative of the signal is zero. Only
the extreme with absolute value higher than a certain
percentage a of max are considered as possible
candidates for an EOG. In most cases this is enough
to conclude that there was EOG present in the
channel. However, if necessary, the algorithm can
decide if the extreme found is from an EOG or not
by looking into the distance d between the second
derivative zeros around the maximum and
comparing them with the results from the calibration
sample as well as with the sum of the absolute
values of the second derivative s between these
zeros.
Figure 5: Signal labeled with test events and eye
movements.
After this, each EOG is marked in the signal, where
the information from the test was already marked
(Figure 5). This way, it is possible to determine if
the subject’s decision to any stimulus in the test is
based only on peripheral vision or helped by eye
scanning. If EOG is detected after the beginning of a
stimulus and before the subject’s response, it is
considered to be based on eye scanning.
2.3 Test Score
The results from the test are treated in three different
ways: global results; only peripheral vision results;
only eye scanning results. Global results are those
that take into consideration the responses due to
peripheral vision and eye scanning together.
Peripheral vision results only have responses based
in peripheral vision (without EOG) and eye scanning
results only have responses based in eye scanning.
For each set of results the following events are taken
into account: True Positive (TP) stands for clicking a
target; True Negative (TN) means the subject
ignored a non-target; False Positive (FP) is
accounted whenever a non-target is clicked; False
Negative (FN) stands for ignoring a target. These
events are used to calculate the indexes that evaluate
the performance in this test. Again, for each set of
results a score is calculated by Equation 1:
100
2
1
×
⎥
⎦
⎤
⎢
⎣
⎡
⎟
⎠
⎞
⎜
⎝
⎛
−+
⎟
⎠
⎞
⎜
⎝
⎛
−=
T
FN
NT
TN
NT
FP
T
TP
score
(1)
Where T is the total number of targets and NT is the
total number of non targets. This index is calculated
for the global, peripheral and eye scanning results,
resulting in three different indexes. This score
ranges from -100% to 100%. If the subject doesn't
click in any target or clicks in all (correct and false)
the score is 0%. If the subject only clicks in correct
targets and doesn't miss any one the score is 100%.
If the subject clicks in every false target and doesn't
click in any correct one the score is -100%.
The average response time is also given for each set
of results, so it is possible to check if peripheral
vision responses are in average faster or slower than
eye scanning. An example is shown in Table 1
Table 1: Average response time associated to each test.
Target
Type
Target time
(ms)
Response Response
time (ms)
NonTarget 3984,38 Clicked: Peripheral 1656,25
NonTarget 4015,62 Peripheral
NonTarget 3984,38 Peripheral
Target 4000 Clicked: Peripheral 1187,5
PERIPHERAL VISION PATTERN DETECTION DYNAMIC TEST
245

3 TEST PROTOCOL
Twelve junior soccer players with varying field
positions and average ages of seventeen were tested
by this application. The test setup only requires the
placement of the electrodes that took about three
minutes for each player. After that, the test
objectives and functioning were explained in the
same way for all twelve players. Then, they were
allowed to start the test when feeling prepared.
Before the tests, each player was informed that no
eye scanning was allowed.
Each session consisted of two pre-programmed set
of stimulus of approximately one minute duration
each. In the first set the objects are plain colored
circles while in the second one the objects may have
mixed colors and shapes making it much harder to
differentiate. In order to add additional difficulty to
the test, the frequency of the stimulus increases
along each session in both tests. Figure 6 shows a
frame from the first test while figure 7 shows a
frame belonging to the second test.
Test1 Test2
Figure 6: Test objects only vary in color in Test1 while in
Pattern Test vary in color and shape.
4 RESULTS
Table 2 shows the results from the two tests for four
players. Columns Global 1% and Global 2%
represent the global score for Color Test and Pattern
Test respectively and TG% the average of both.
Columns Pher 1% and Pher 2% are the scores from
the peripheral responses for Color Test and Pattern
Test respectively and TP% their average. Columns
Scan 1% and Scan 2% are the scores from the eye
scanning responses for Color Test and Pattern Test
respectively and TS% their average. From the
examples present in Table 2: the highlighted subject
(last row) appeared to be clicking randomly and the
score reflected his lack of dedication to the test; the
subject in the first row was the one that used more
eye scanning and a very few peripheral vision; the
subject from second row has the opposite situation
and the subject in the third row uses both peripheral
and eye scanning.
Table 2: Test results.
5 CONCLUSIONS
Despite the request for avoiding eye scanning,
almost every subject used it more than once.
Interestingly, in most cases, the average delay for
the eye scanning response is higher than the average
delay from peripheral vision response. There are
obvious cases of subjects that score higher in both
global and peripheral scores. During both tests one
subject seemed to be clicking randomly and his
results were very close to 0% in both. This way, this
test shows promising results to be a good indicator
of a persons’ capability of deciding according to his
surroundings while performing a different task. It
also discriminates between two ways of
acknowledging their surroundings: by peripheral
vision or eye scanning. With a stable and precise
evaluation tool for this skill it is possible to
experiment new methods to improve it.
ACKNOWLEDGEMENTS
This work was partially supported by Fundação para
a Ciência e a Tecnologia (ISR/IST plurianual
funding) through the POS_Conhecimento Program
that includes FEDER funds.
REFERENCES
Gerla V., Paul K., Lhotska L., Krajca V. (2009)
Multivariate analysis of full-term neonatal
polysomnographic data. Trans Info Tech Biomed
13:104-110.
Johnson C. A., Adams A. J., Casson E.J., Brandt J. D.
(1993) Progression of Early Glaucomatous Visual
Field Loss as Detected by Blue-on-Yellow and
Standard White-on-White Automated Perimetry. Arch
Ophthalmol 111:651-656.
Levi D. M., Hariharan S., Klein S. A. (2002) Suppressive
and facilitatory spatial interactions in peripheral
ICEIS 2010 - 12th International Conference on Enterprise Information Systems
246

vision: Peripheral crowding is neither size invariant
nor simple contrast masking. J. Vis 2:167-177.
Stiles W. S. (1959) Color vision: the approach through
increment-threshold sensitivity. Proceedings of the
National Academy of Sciences of the United States of
America 45:100-114.
PERIPHERAL VISION PATTERN DETECTION DYNAMIC TEST
247
