
A TWO-PHASE PRE-FILTERING APPROACH TO THE
AUTOMATIC SCREENING OF DIGITAL FUNDUS IMAGES
B
´
alint Antal, Andr
´
as Hajdu
University of Debrecen, Faculty of Informatics, POB 12, 4010 Debrecen, Hungary
Adrienne Csutak
University of Debrecen, Medical and Health Science Centre, Nagyerdei Krt. 98, 4032 Debrecen, Hungary
T
¨
unde Pet
˝
o
Moorfields Eye Hospital, London, U.K.
Keywords:
Biomedical image processing, Medical decision-making, Quality assurance, Medical expert systems.
Abstract:
In this paper, we present an approach to decrease the computational burden of an automatic screening system
designed for diabetic retinopathy. The proposed method consists of two steps. First, a pre-screening algorithm
is considered to classify the input digital fundus images based on their abnormality. If an image is found to
be abnormal, it will not be analyzed further with robust lesion detector algorithms. As an improvement, we
introduce a novel feature extraction approach based on clinical observations. The second step of the proposed
method detects regions which contain possible lesions for images that have been passed pre-screening. These
regions will serve as inputs to lesion detectors later on, which can achieve better computational performance
by operating on specific regions only instead of the entire image. Experimental results show that both two
steps of the proposed approach are valid to efficiently exclude a large amount of data from further processing
to improve the performance of an automatic screening system.
1 INTRODUCTION
Retinal fundus photographs are widely used in the di-
agnosis and consequent treatment of various eye dis-
eases, such as diabetic retinopathy (DR), age related
macular degeneration (AMD) and glaucoma. DR is
one of the most frequent causes of visual impairment
in developed countries and is the leading cause of new
cases of legal blindness among those in the working
age. DR can be prevented and its progression slowed
down if diagnosed and treated early. Screening for
DR is the mainstay of identifying patients at risk. The
result of screening is determined by the recognizable
lesions of the retina.
Nowadays, automated detection systems have be-
come very popular in medical imaging, including DR
screening (Abramoff et al., 2008). Our current inter-
est is to develop an automatic system to detect abnor-
malities caused by DR. We also consider the insertion
of a pre-filtering phase before the detailed analysis,
which is, to the best of our knowledge, is not a part of
other systems. Our approach is realized in two steps:
pre-screening and pre-filtering. During pre-screening,
we classify the images as severely diseased (highly
abnormal) or to be forwarded to further processing.
The aim of this step is twofold. On the one hand,
we minimize the risk that an abnormal image pass the
screening without a warning, since it is immediately
spotted by the automatic system before detailed anal-
ysis. On the other hand, we save computational time,
since only the not abnormal fundus images are ana-
lyzed in details. Figure 1 gives an impression about
these two classes. In the case of fundus images, ma-
chine learning algorithms are often applied to classi-
fication based on feature vectors. We extract features
based on clinical observations about the inhomogene-
ity of the diseased retina.
As a second – pre-filtering – step of our approach,
we extract those candidate subregions of fundus im-
ages that are expected to contain specific lesions. The
155
Antal B., Hajdu A., Csutak A. and Petõ T. (2010).
A TWO-PHASE PRE-FILTERING APPROACH TO THE AUTOMATIC SCREENING OF DIGITAL FUNDUS IMAGES.
In Proceedings of the International Conference on Signal Processing and Multimedia Applications, pages 155-158
DOI: 10.5220/0002988101550158
Copyright
c
SciTePress
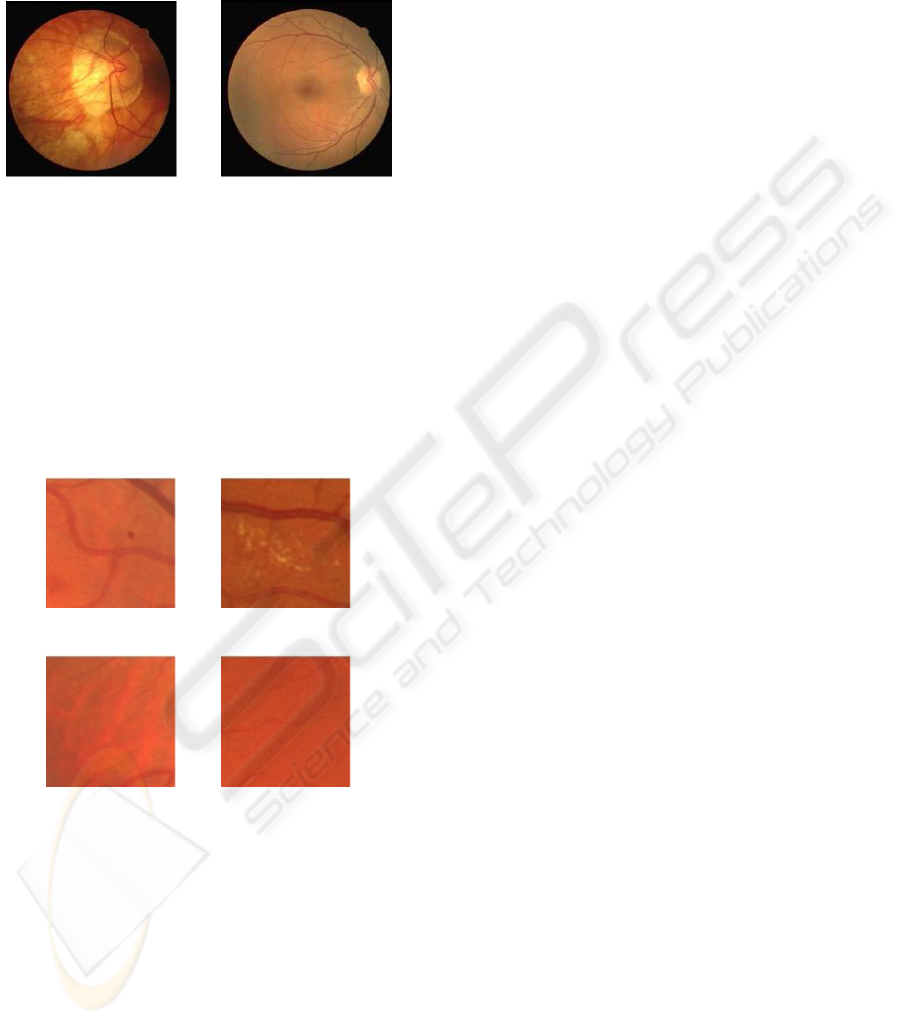
most common lesion on the fundus is the microa-
neurysm (see Figure 2a), which is an early sign of
diabetic retinopathy. A microaneurysm appears as a
small red spot on the retina.
(a) (b)
Figure 1: Samples from the image set (both taken from the
DRIVE database (Staal et al., 2004)); (a) abnormal fundus,
(b) fundus image that needs detailed analysis.
The detection of DR related bright lesions (exu-
dates) has a rich literature, as well. Exudates appear at
an advanced stage of diabetic retinopathy (see Figure
2c). The retinal pigment epihelium (RPE) is usually
caused by age-related macular degeneration. The sign
of RPE is the inhomogeneous surface of the retina, as
it is shown in Figure 2c.
(a) (b)
(c) (d)
Figure 2: (a) microaneurysms, (b) bright lesions (exudates),
(c) retinal pigment epihelium, (d) normal retina.
To find candidate regions containing lesions, our
approach is based on the fact that asides form its
anatomical parts, the intensity values of the normal
retina surface have small saliences (see Figure 2d).
If there is a connected set of salient values with a
given cardinality, we can assume that there is a le-
sion within the examined region. The goal is to pre-
serve those regions only, which possibly contain le-
sions. The rest of the paper is organized as follows.
In section 2 we present our approach for classifying
the images as abnormal or not (pre-screening). Sec-
tion 3 exhibits how candidate regions are pre-filtered
on fundus images that have passed the pre-screening
phase. The datasets and corresponding experimental
results are shown in section 4. Finally, some conclu-
sions are drawn in section 5.
2 PRE-SCREENING
– CLASSIFYING THE INPUT
IMAGE
As the first step of our approach, we check whether
the image has so severe abnormality that the patient
should be sent directly to a medical expert. In the case
of high-loaded automatic systems, skipping these im-
ages will enhance the performance, since detailed
analyses do not take place. The pre-screening is re-
alized based on machine learning algorithms. Next,
we summarize the components of pre-screening orga-
nized into consequent steps.
2.1 Pre-processing
As a pre-processing step, we convert the input
RGB images to grayscale ones as proposed e.g. in
(Sopharak et al., 2008), to get a suitable representa-
tion for possible disorders. Then, we apply adaptive
histogram equalization (AHE) as an intensity normal-
ization step proposed by (Youssif et al., 2006). Fi-
nally, we rescale the images to the size of 90 × 90
pixels.
2.2 Feature Vectors and Classifiers
We also take advantage of the clinical observation
that fundi with severe diabetic retinopathy often have
inhomogeneity caused by retinal pigment epithelium
(RPE) atrophy, which is the waste of the pigmented
cell layer of the retina. Composing feature vectors
based on this observation leads to more accurate re-
sults both in classification and computational perfor-
mance, as will be presented in the results section.
To extract these features, we used the following ap-
proaches:
• Inhomogeneity. Let the image be split into dis-
joint subimages of size s×s, e.g. with s = 5. Then,
for each pixel within a subimage, we compute the
sum of intensity differences larger than a given
threshold t for every subsequent subimage pixels.
After this step, we divide this sum with the size of
the subimage. If this number is larger than zero,
the feature is set to 1, otherwise to 0.
SIGMAP 2010 - International Conference on Signal Processing and Multimedia Applications
156
• Standard Deviation. For each subimage we cal-
culate the standard deviation. This approach is for
referential purposes.
• Combined. The combination of the inhomogene-
ity feature and the standard deviation.
3 PRE-FILTERING
– EXTRACTING REGIONS
WITH LESION CANDIDATES
As the second step of our approach, we extract re-
gions with lesions candidate in the images that passed
the pre-screening phase. Since these images must
undergo detailed image analyses to extract specific
lesions later on, this pre-filtering is highly recom-
mended to restrict the input of the corresponding de-
tector algorithms. Now we summarize the steps how
the candidate regions are extracted.
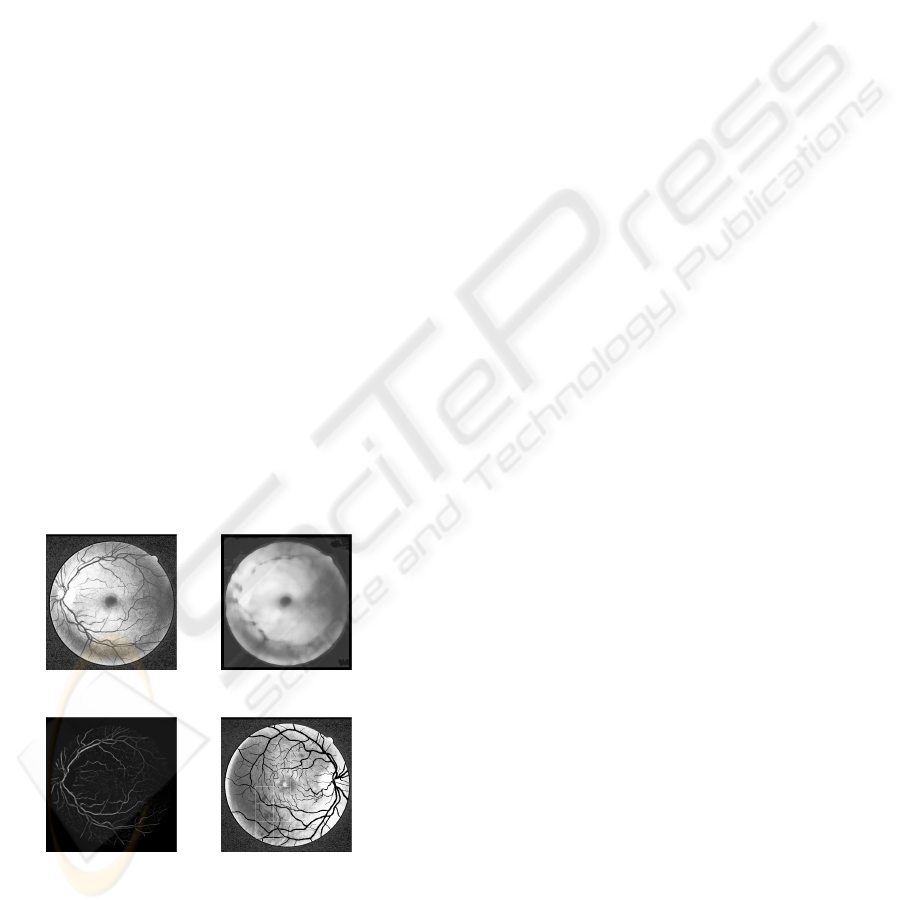
3.1 Pre-processing
Similarly to the pre-processing steps discussed for the
pre-screening phase, we use the green plane of the im-
age by following literature recommendations (Youssif
et al., 2006). Then, we perform histogram equaliza-
tion on the image to reduce the vignetting effect (see
Figure 3a) and calculate the background image by ap-
plying a strong median filter of size A × A (e.g. with
A = 25).
(a) (b)
(c) (d)
Figure 3: (a) the green plane after histogram equalization,
(b) the background image, (c) the pre-processed image for
candidate region extraction, (d) regions with lesion candi-
dates.
We use the background image shown in Figure
(see Figure 3b), to perform shade correction by sub-
tracting it from the original image.
To suppress noise, we apply a median filter of size
B × B (e.g. with B = 13) to the shade corrected im-
age. As the final pre-processing step, we apply un-
sharp masking to increase the acutance (see Figure
3c).
3.2 Removal of Anatomical Parts
Detecting the anatomical parts of the fundus is an im-
portant step before lesion detection. For example, the
optic disc appears as the brightest circular patch on
the fundus, whose presence may disturb the detection
of exudates. Removing the vessel system is also rele-
vant, since a small portion of it appears basically the
same as haemorrhages. Besides these two anatomical
parts, we also remove the macula, because for cer-
tain region sizes, some parts of it can appear as a lo-
cally salient object. For these tasks, we use the vessel
detector published by (Staal et al., 2004), the mac-
ula detector of Petsatodis (Petsatodis et al., 2006) and
the optic disc detector described in (Sopharak et al.,
2008).
3.3 Statistical Analysis of Regions
We split the image into disjoint regions of size s × s
(e.g. with s = 75). For each region, we compute
the local mean µ and the standard deviation σ of
its intensity values. Let d
sig
(x, y) = x − y. We
label the pixel P (x, y) having intensity I (x, y) as
high, if d
sig
(I (x, y) , µ) > σ, while P (x, y) is low, if
d
sig
(I (x, y) , µ) < −σ. Otherwise, P remains unla-
beled. After labeling, we select connected compo-
nents, which composed of pixels with identical labels
and with cardinality at least n. If a component sat-
isfied these conditions, we consider that as a lesion
candidate. We use the areas which possibly contain
lesions as input for specific lesion detectors, designed
for e.g. microaneurysms or exudates.
4 RESULTS
4.1 Results on Pre-screening
Our experimental dataset consisted of 34 training and
28 test images, classified by ophthalmologists. We
selected images from three databases: the publicly
available DRIVE (Staal et al., 2004), DIARETDB1
(Kauppi et al., 2007) and the database provided by
the Moorfields Eye Hospital, London, UK for our re-
search purposes. We label the elements of the test
A TWO-PHASE PRE-FILTERING APPROACH TO THE AUTOMATIC SCREENING OF DIGITAL FUNDUS
IMAGES
157

database as images with serious disorder (first class)
and images to be processed further (second class). We
used a Naive Bayes classifier and trained for the com-
bined features extracted from all regions of the im-
ages as disclosed in section 2.2. With this approach,
we have successfully classified all elements of the test
dataset. To make the approach faster, we used back-
ward elimination for feature subset selection. That is,
we have selected the best 11 regions each image to be
extracted the features from for classification. In this
case, our approach still provided no false predictions
with the computational time below milliseconds.
4.2 Results on Pre-filtering
We have tested our approach on those images which
have been classified as ”to be processed further” by
the previous pre-screening phase and the positive
samples of the training set. The detector missed only
1 fundus image which contained lesions. Our results
are summarized in Table 1 in details containing the
value of the size parameters s, the number of correctly
/ incorrectly (true / false) identified regions, the num-
ber of misclassified images and the percentage of the
remaining pixels.
Table 1: Experimental results on pre-filtering.
Size (s) True False Mis- Percentage
classified
10 24 10 4 0.05
25 26 10 4 0.34
50 25 9 5 1.28
75 27 3 1 2.5
100 16 7 5 3.47
200 4 4 5 4.82
With this regions candidate detection, we can re-
duce the total number of pixels of the database from
more than 6 millions to 168 750, which is nearly 2,5%
of the original data. To demonstrate how its reduction
affected consequent detailed image processing anal-
ysis, we tested a specific lesion detector. Namely,
the computational time of the state-of-the-art microa-
neurysm detection algorithm (Fleming et al., 2006)
reduced by 90% after this candidate selection step.
5 CONCLUSIONS
We have presented an automatic approach that can
separate fundus images with serious lesions from the
ones that should undergo detailed screening. This step
can direct patients with serious lesions immediately
to ophthalmologists by automatic screening systems.
With a use of a Naive Bayes classifier, we were able to
classify all the test images correctly. As a secondary
pre-filtering step for images passing pre-screening,
we have presented an approach which is eligible to
detect areas which possibly contain lesions. As a fair
trade off with accuracy, we gain high computational
performance with using only small regions to detect
the actual lesions within.
ACKNOWLEDGEMENTS
This work was supported in part by the J
´
anos Bolyai
grant of the Hungarian Academy of Sciences, and
by the TECH08-2 project DRSCREEN - Develop-
ing a computer based image processing system for
diabetic retinopathy screening of the National Of-
fice for Research and Technology of Hungary (con-
tract no.: OM-00194/2008, OM-00195/2008, OM-
00196/2008).
REFERENCES
Abramoff, M., Niemeijer, M., Suttorp-Schulten, M.,
Viergever, M. A., Russel, S. R., and van Ginneken,
B. (February 2008). Evaluation of a system for au-
tomatic detection of diabetic retinopathy from color
fundus photographs in a large population of patients
with diabetes. Diabetes Care, 31:193–198.
Fleming, A. D., Philip, S., and Goatman, K. A. (2006). Au-
tomated microaneurysm detection using local contrast
normalization and local vessel detection. IEEE Trans-
actions on Medical Imaging, 25(9):1223–1232.
Kauppi, T., Kalesnykiene, V., Kmrinen, J., Lensu, L., Sorri,
I., Raninen, A., Voutilainen, R., Uusitalo, H., Klvi-
inen, H., and Pietil, J. (2007). Diaretdb1 diabetic
retinopathy database and evaluation protocol. Proc. of
the 11th Conf. on Medical Image Understanding and
Analysis (MIUA2007), pages 61–65.
Petsatodis, T. S., Diamantis, A., and Syrcos, G. P. (16-17
September 2006). A complete algorithm for automatic
human recognition based on retina vascular network
characteristics. Era1 International Scientific Confer-
ence, Peloponnese, Greece.
Sopharak, A., Nwe, K. T., Moe, Y. A., Dailey, M. N., and
Uyyanonvara, B. (February 27-29, 2008). Automatic
exudate detection with a naive bayes classifier. In The
2008 International Conference on Embedded Systems
and Intelligent Technology.
Staal, J., Abramoff, M., Niemeijer, M., Viergever, M., and
van Ginneken, B. (2004). Ridge based vessel segmen-
tation in color images of the retina. IEEE Transactions
on Medical Imaging, 23:501–509.
Youssif, A. A. A., Ghalwash, A. Z., and Ghoneim, A. S.
(2006). Comparative study of contrast enhancement
and illumination equalization methods for retinal vas-
culature segmentation. Proc. Cairo International
Biomedical Engineering Conferemce.
SIGMAP 2010 - International Conference on Signal Processing and Multimedia Applications
158
