
ON THE BER ESTIMATION OF EXPERIMENTAL DIRECT
DETECTION OFDM SYSTEMS
Tiago Alves and Adolfo Cartaxo
Group of Research on Optical Fibre Telecommunication Systems, Instituto de Telecomunicac¸˜oes, DEEC
Instituto Superior T´ecnico, Avenida Rovisco Pais 1, 1049-001, Lisboa, Portugal
Keywords:
Optical fiber communications, Orthogonal frequency division multiplexing, Performance evaluation.
Abstract:
We propose to extend the exhaustive Gaussian approach (EGA) to assess the bit error ratio (BER) of ex-
perimental direct detection optical orthogonal frequency division multiplexing setups. Excellent agreement
between the actual probability density function (PDF) of each subcarrier and the Gaussian PDF estimated
from a set of experimental runs is shown. The proposed EGA allows evaluate quickly the BER as only a few
hundreds of runs are required to reach stabilized BER estimates. The BER estimated by EGA has shown an
excellent agreement with the BER estimates provided by direct error counting.
1 INTRODUCTION
Orthogonal frequency division multiplexing (OFDM)
has been proposed in the past few years as a promis-
ing technology to be used in different range opti-
cal networks (Llorente et al., 2008; Lin et al., 2008;
Schmidt et al., 2009). The main impairments of
OFDM-based networks have been extensively ana-
lyzed experimentally and through numerical simu-
lation (Schmidt et al., 2009; Schuster et al., 2008;
Alves and Cartaxo, 2009; Lowery, 2008; Jansen et al.,
2009; Peng et al., 2008). The performanceassessment
has been accomplished by using three main figures
of merit: direct error counting (DEC), error vector
magnitude (EVM) and Q factor. DEC provides rig-
orous bit error ratio (BER) estimates but the amount
of transmitted data required to achieve low BER lev-
els may lead to unacceptable measurement time. The
assessment of the system performance from EVM and
Q factor approaches allows overcome this limitation.
However, these approaches may lead to unreliable
estimates of the system performance as the statisti-
cal distribution of the subcarriers distortion may not
be rigorously taken into account due to the assump-
tions of the analytical formulation each approach re-
lies on. Furthermore, the different signal-to-noise
ratio (SNR) of each subcarrier is not considered by
these approaches. Further information regarding the
validity range of these figure of merits to evaluate the
performance of DD OFDM systems can be found in
(Alves and Cartaxo, 2010), where the BER was as-
sessed for two types of DD-OFDM systems through
numerical simulation.
In a previous work, a novel approach to evaluate
the BER of each subcarrier of a direct detection (DD)
optical OFDM system through numerical simulation
has been proposed (Alves and Cartaxo, 2009). In
that case, the mean and the standard deviation (STD)
of each subcarrier of each OFDM symbol are ob-
tained through numerical simulation and analytically,
respectively, and an exhaustive Gaussian approach
(EGA) is used to evaluate the BER of each subcar-
rier. The main advantage of the EGA is the possibil-
ity to take into account separately the noise and inter-
ference effects. In this work, we propose to extend
that approach to experimental DD-OFDM systems by
evaluating the statistical properties of each subcarrier
required by the EGA from a set of experimental runs.
2 EXHAUSTIVE GAUSSIAN
APPROACH DESCRIPTION
The EGA considers that the received components (I
and Q) of each OFDM subcarrier are well described
by a Gaussian distribution (confirmed numerically in
(Alves and Cartaxo, 2009)). The extension of the
EGA to experimental setups is based on the estima-
tion of the mean and STD of each subcarrier over a
set of experimental runs. In this case, the BER of the
I or Q component of the k-th subcarrier is given by:
154
Alves T. and Cartaxo A. (2010).
ON THE BER ESTIMATION OF EXPERIMENTAL DIRECT DETECTION OFDM SYSTEMS.
In Proceedings of the International Conference on Data Communication Networking and Optical Communication Systems, pages 154-158
DOI: 10.5220/0002988701540158
Copyright
c
SciTePress

BER
(I,Q)
[k] =
1
N
s
N
s
∑
i=1
a
(i)
(I,Q)
[k]=0
Q
F
(I,Q)
[k] −m
(i)
(I,Q)
[k]
σ
(i)
(I,Q)
[k]
+
1
N
s
N
s
∑
i=1
a
(i)
(I,Q)
[k]=1
Q
m
(i)
(I,Q)
[k] −F
(I,Q)
[k]
σ
(i)
(I,Q)
[k]
. (1)
where m
(i)
(I,Q)
[k] is the mean and σ
(i)
(I,Q)
[k] is the STD
of the k-th subcarrier of the i-th OFDM symbol at the
output of the system setup, given by:
m
(i)
(I,Q)
[k] =
1
N
r
N
r
∑
n=1
y
(i)
(I,Q),n
[k]
σ
(i)
(I,Q)
[k] =
"
1
N
r
N
r
∑
n=1
y
(i)
(I,Q),n
[k] −m
(i)
(I,Q)
[k]
2
#
1
2
(2)
where y
(i)
(I,Q),n
[k] is the received I or Q component of
the subcarrier transmitted in the n-th run and N
r
is the
number of runs. In eq. (1), a
(i)
(I,Q)
[k] identifies the bit
transmitted in the (I,Q) component of the k-th sub-
carrier of the i-th OFDM symbol and F
(I,Q)
[k] is the
decision threshold level of the k-th subcarrier. N
s
is
the number of transmitted OFDM symbols per run
and Q(x) = 0.5erfc
x
√
2
. Eq. (1) considers that bi-
nary phase shift keying (BPSK) or quadrature phase
shift keying (QPSK) symbol mapping is used. Nev-
ertheless, the estimation of the BER using the EGA
for other more efficient mappings can still be accom-
plished by developing a generalized version of eq. (1)
and using the same procedure to evaluate the means
and the standard deviations of each subcarrier as the
one described in this work. If BPSK symbol map-
ping is used (with symbols j and −j), the means and
the standard deviations of eq. (1) are relative to the Q
component only. Instead, if QPSK is used and assum-
ing that the I and Q signal components at the equal-
izer output are uncorrelated and that Gray mapping is
used, the BER of each OFDM subcarrier is given by
BER[k] =
1
2
[1−(1−BER
I
[k]) (1−BER
Q
[k])], where
BER
I
[k] and BER
Q
[k] are the BER of the I and Q
components of each subcarrier at the equalizer out-
put given by eq. (1). The overall BER is evaluated
averaging the BER over all information subcarriers.
It should be stressed that the EGA described by
eq. (1) to evaluate the BER of each subcarrier con-
siders a Gaussian distribution for noise and allows
characterizing correctly the statistical distribution of
the distortion rather than using a Gaussian distribution
to characterize the distortion induced on all subcarri-
ers, as assumed when the BER is calculated from the
EVM or the Q factor. This indicates that distortion-
induced degradation due to, for instance, electro-optic
modulator nonlinearity, non-ideal frequency response
of the different devices, I/Q imbalance or phase offset,
should be correctly accounted by eq. (1). The distor-
tions effects that are not addressed in this work will
be investigated in future work.
3 EXPERIMENTAL SETUP
OFDM ultra-wideband(UWB) signals are used in this
work to demonstrate the accuracy of the extended
EGA to estimate the BER in experimental setups. The
results presented in (Alves and Cartaxo, 2009) sug-
gest that the proposed method can also be used to es-
timate experimentally the BER of other DD-OFDM
signals, as the ones proposed for long-haul systems.
The OFDM-UWB radio signal is composed by 128
subcarriers from which 100 are used as information
subcarriers, the spectrum occupies 528 MHz of band-
width and the time interval of each OFDM symbol is
312.5 ns. Further details on the OFDM-UWB signal
generation can be found in (Alves and Cartaxo, 2009),
(ECMA-368, 2007).
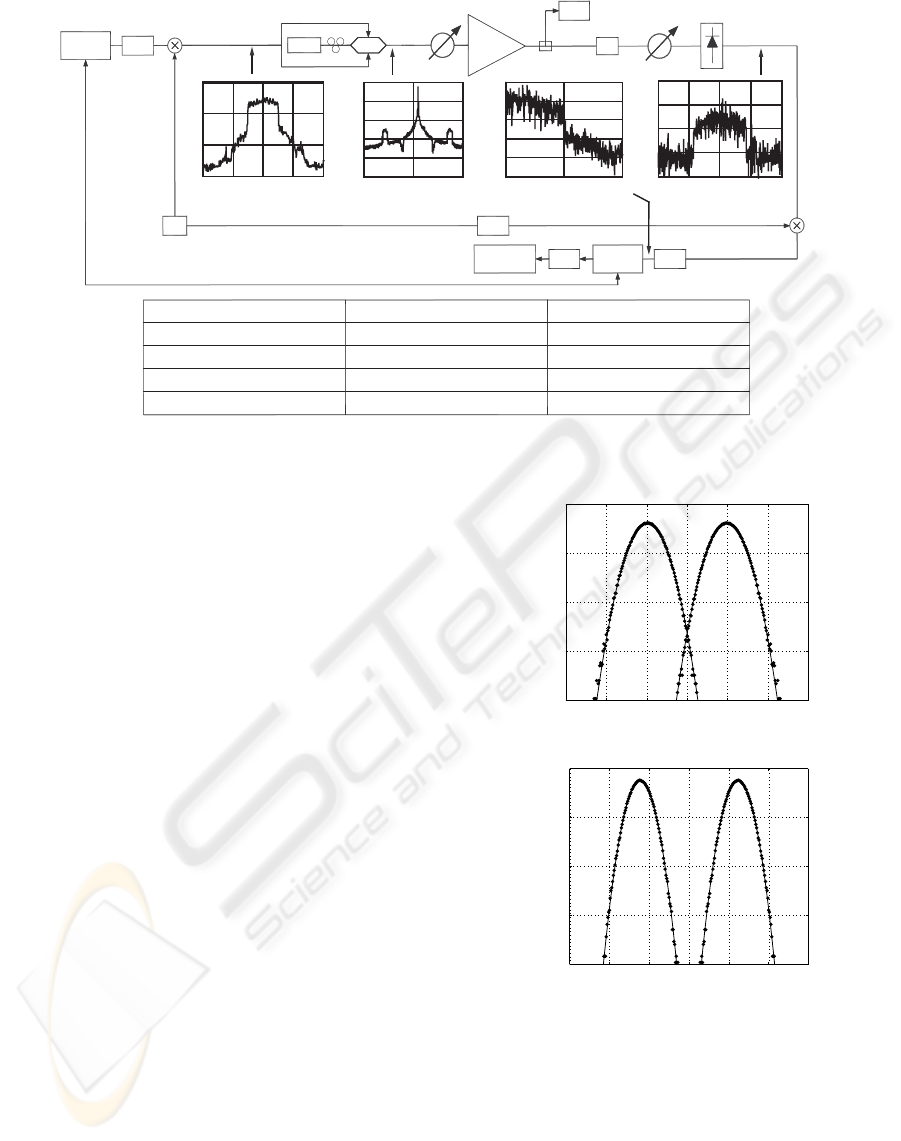
Figure 1 shows the experimental setup used to as-
sess the accuracy of the proposed EGA. The measured
spectra of the OFDM-UWB signal along the setup are
also shown as insets in Figure 1. The OFDM-UWB
baseband signal is generated off-line and converted to
the electrical domain by a Tektronix AWG7052 oper-
ating in continuous mode. The OFDM-UWB signal
is composed by 32 symbols and BPSK mapping is
employed. The baseband OFDM-UWB signal is up-
converted to the first UWB subband with carrier fre-
quency of 3.4 GHz and is then applied to a Sumitomo
single-electrode 10 Gbit/s intensity modulator biased
at the quadrature point. Due to the lack of electrical
amplifiers with adequate bandwidth, only a 4% mod-
ulation index (defined as the ratio between the root
mean square voltage of the OFDM signal applied to
the modulator arms and the modulator bias point) is
reached and, as a consequence, a high optical signal-
to-noise ratio (OSNR) has to be used to achieve ac-
ceptable BER levels. A variable optical attenuator
(VOA) and an optical amplifier (noise figure of 4.5
dB) are used to adjust the OSNR (defined in a ref-
erence optical bandwidth of 0.1 nm). At the optical
receiver, the signal is optically filtered by a Kylia de-
multiplexer with 50 GHz of channel spacing and 32
GHz of bandwidth, and photodetected by a Discov-
ery Semiconductors PIN with 0.7 A/W and 9 GHz
of bandwidth. The detected OFDM-UWB signal is
down converted and low-pass filtered to reduce the
ON THE BER ESTIMATION OF EXPERIMENTAL DIRECT DETECTION OFDM SYSTEMS
155
2.4 2.9 3.4 3.9 4.4
frequency [GHz]
193.095 193.1 193.105
frequency [THz]
2.8 3.1 3.4 3.7 4
5 dB/div.
0 250 500
frequency [GHz]
frequency [MHz]
20 dB/div.
20 dB/div.
5 dB/div.
AWG
LPF
LO
Laser
PC
VOA
EDFA
OSA
10%
OF
PIN
90%
VOA
EDL
LPF
5 Gs/s
DSO
5 Gs/s
DSP
synchronization marker
BER
Estimation
AWG: arbitrary waveform generator
DSO: digital signal oscilloscope
DSP: digital signal processing
LO: local oscillator
EDL: electrical delay line
EDFA: erbium doped fiber amplifier
LPF: low-pass filter
PC: polarization controller
VOA: variable optical attenuator
OSA: optical spectrum analyzer
PIN: positive-intrinsic-negative
OF: optical filter
TF: transmission fiber
BER: bit error ratio
Figure 1: DD optical OFDM system used to assess the accuracy of the EGA in experimental setups. Measured spectra of the
signals at different points of the system setup (insets).
noise and the out-of-band distortion. Two different
Mini-Circuits low pass filters (LPF) are used in the
experiments in order to analyze different distortion
situations: the VLFX-225 (-3 dB bandwidth of 345
MHz) and the VLFX-300 (-3 dB bandwidth of 450
MHz). Finally, the OFDM signal is acquired by a real
time oscilloscope Agilent DSO81204A that is con-
nected to a PC to perform the OFDM demodulation
and equalization by digital signal processing (DSP),
and BER measurement.
4 EXPERIMENTAL RESULTS
In this study, the accuracy of the proposed approach
is assessed considering only noise and distortion in-
duced by the frequency response of the devices. The
number of experimental runs required to get stabilized
BER estimates is also analyzed while fibre transmis-
sion and nonlinear system effects will be addressed in
future work.
The validity of the Gaussian distribution consid-
ered for each OFDM subcarrier in the EGA is ana-
lyzed by comparison with the actual probability den-
sity functions (PDF) obtained experimentally. 4×10
5
runs have been used to evaluate the PDFs.
Figure 2 shows the actual PDFs of the Q compo-
nent of four OFDM subcarriers at the equalizer output
and the PDFs obtained when the Gaussian distribu-
tion is considered. Figure 2 shows that the Gaussian
distribution fits very well the actual PDF of the sub-
carriers and that the subcarriers located at the edges
of the spectrum present high variance leading to dif-
−3 −2 −1 0 1 2 3
−3.5
−2.5
−1.5
−0.5
0.5
signal amplitude
log
10
PDF
a)
−3 −2 −1 0 1 2 3
−3.5
−2.5
−1.5
−0.5
0.5
signal amplitude
log
10
PDF
b)
Figure 2: PDF of the subcarriers at the system output for
OSNR=27.3 dB and considering the subcarriers located in
a) the edges and b) the middle of the OFDM-UWB spec-
trum. Gaussian PDF (lines) and actual PDF (marks). LPF:
VLFX-225.
ferent SNRs between the subcarriers, as mentioned
before. As the tail region is also adequately described
by a Gaussian distribution, Figure 2(a) indicates that
a very good accuracy of the BER estimates obtained
from the EGA is expected. The main advantages of
DCNET 2010 - International Conference on Data Communication Networking
156
0 200 400 600 800 1000
−7
−6
−5
−4
−3
−2
−1
runs
log
10
BER
OSNR=25.4dB
OSNR=26.4dB
OSNR=27.3dB
OSNR=28.4dB
OSNR=29.3dB
lines: DEC; marks: EGA
LPF: VLFX−225
a)
0 20 40 60 80 100
−9
−7
−5
−3
−1
subcarrier index
log
10
BER
lines: DEC; marks: EGA
OSNR=26.4dB
OSNR=27.3dB
LPF: VLFX−225
b)
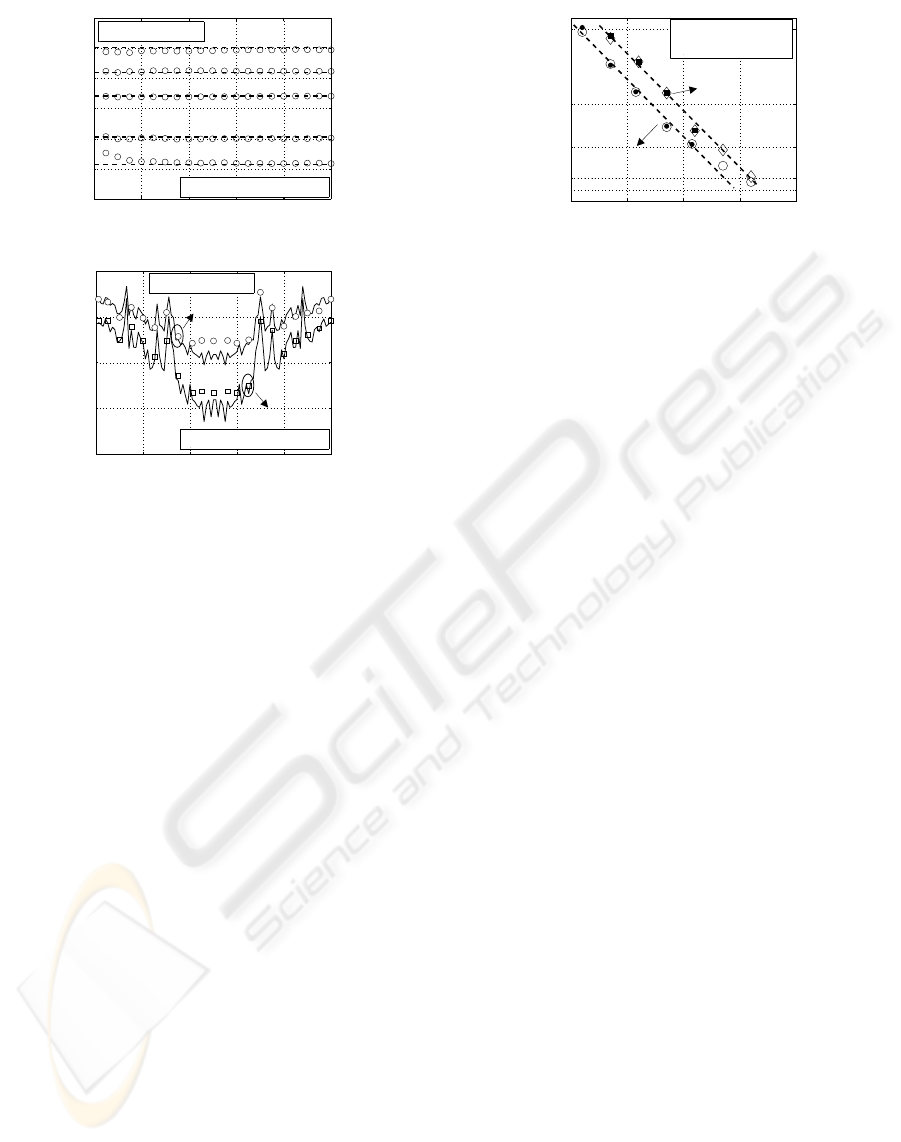
Figure 3: a) BER as a function of the noise runs. b) BER as
a function of the subcarriers index.
the proposed EGA are the fast and good estimates
of the system performance independently of the BER
levels. Hence, one of the key parameters of the EGA
is the number of runs needed to achieve good BER
estimates.
Figure 3(a) depicts the BER of the OFDM sys-
tem as a function of the number of runs used in the
EGA to estimate the properties of the Gaussian dis-
tribution. The BER obtained from the DEC is also
shown as a reference. In order to obtain a good con-
fidence on the BER estimates, the BER provided by
DEC is evaluated when at least 100 errors occur in the
subcarrier with worst performance. Figure 3(a) shows
that a few hundreds of noise runs are enough to obtain
confident overall BER estimates using the EGA, inde-
pendently of the OSNR level. Nevertheless, in the fol-
lowing, 1000 noise runs are considered in order to get
a reasonable confidence on the estimation of the BER
of the subcarriers showing lower BER. Figure 3(b)
shows the BER as a function of the subcarrier index
(subcarriers with lower indexes correspond to subcar-
riers transmitted at lower frequencies) for two OSNR
levels. The BER obtained with DEC is evaluated over
3.3 ×10
5
and 4.3 ×10
5
runs for the case with lower
and higher OSNR, respectively. Figure 3(b) shows
that the BER of each subcarrier provided by EGA fits
well the BER measured by DEC. The discrepancy ob-
served in the estimated BER of the center subcarriers
is attributed to rare error events. Figure 3(b) shows
also that some subcarriers present high BER peaks.
25 27 29 31 33
−10
−8
−6
−4
−2
OSNR [dB]
log
10
BER
DEC: filled marks
EGA: empty marks
LPF: VLFX−300
LPF: VLFX−225
Figure 4: BER as a function of the OSNR.
This is due to the non-ideal frequency response of the
devices.
Figure 4 presents the BER of the optical OFDM-
UWB system as a function of the OSNR for the two
LPFs considered along this work. The BER obtained
with DEC is evaluated when at least 100 errors occur
on the subcarrier with worst performance. The com-
parison between the BER estimated by both methods
shows that the BER can be estimated using the EGA
with a very good agreement with DEC, independently
of the OSNR levels, avoiding the high amount of data
necessary to estimate the BER from DEC. For in-
stance, for the VLFX-225 LPF and OSNR=29.3 dB
case, the BER estimated by DEC requires (to get 100
errors in the subcarrier showing worst performance)
the transmission of 3.84×10
6
OFDM-UWB symbols
whereas the EGA only requires 3.2 ×10
4
symbols.
This difference is still higher when the estimation of
lower BER levels is desired as more symbols are re-
quired to estimate the BER using DEC.
5 CONCLUSIONS
An extension of the exhaustive Gaussian approach
(EGA) to estimate the BER of each subcarrier in ex-
perimental direct-detection OFDM setups has been
proposed. It has been experimentally shown that
the actual statistical distribution of each OFDM sub-
carrier is well described by a Gaussian distribution
whose statistical properties are estimated over a set
of few hundreds of noise runs. Additionally, the ex-
perimental results have shown that the BER of each
OFDM subcarrier estimated by the EGA agrees very
well with the actual BER obtained from direct error
counting with the advantage of providing fast esti-
mates, independently of the estimated BER levels.
The comparison between the BER estimates pro-
vided by the EGA with ones obtained using the EVM
or the Q factor approaches in DD OFDM experimen-
tal setups will be reported elsewhere.
ON THE BER ESTIMATION OF EXPERIMENTAL DIRECT DETECTION OFDM SYSTEMS
157

ACKNOWLEDGEMENTS
The work of Tiago Alves was supported by Fundac¸˜ao
para a Ciˆencia e a Tecnologia (FCT) from Por-
tugal under contract SFRH/BD/29871/2006. This
work was also supported in part by the EU FIVER-
FP7-ICT-2009-4-249142 project and FCT-funded
TURBO-PTDC/EEA-TEL/104358/2008 project.
REFERENCES
Alves, T. and Cartaxo, A. (2009). Semi-analytical ap-
proach for performance evaluation of direct-detection
OFDM optical communication systems. Optics Ex-
press, 17(21):18714–18729.
Alves, T. and Cartaxo, A. (2010). Analysis of methods of
performance evaluation of direct-detection orthogonal
frequency division multiplexing communication sys-
tems. Fiber and Integrated Optics, 29(3):accepted pa-
per.
ECMA-368 (2007). High Rate Ultra Wideband PHY and
MAC Standard. ECMA-International, Geneve, 2nd
edition.
Jansen, S., Amin, A., Takahashi, H., Morita, I., and
Tanaka, H. (2009). 132.2 Gbit/s PDM-8QAM-OFDM
transmission at 4-b/s/Hz spectral efficiency. Photon.
Technol. Lett., 21(12):802–804.
Lin, C., Lin, Y., Chen, J., Dai, S., Shih, P., Peng, P., and Chi,
S. (2008). Optical direct-detection OFDM signal gen-
eration for radio-over-fibre link using frequency dou-
bling scheme with carrier supression. Optics Express,
16(9):6056–6063.
Llorente, R., Alves, T., Morant, M., Perez, J., Cartaxo, A.,
and Marti, J. (2008). Ultra-wideband radio signals dis-
tribution in FTTH networks. Photon. Technol. Lett.,
20(11):945–947.
Lowery, A. (2008). Amplified-spontaneous noise limit of
optical OFDM lightwave systems. Optics Express,
16(2):860–865.
Peng, W., Zhang, B., Wu, X., Feng, K., Willner, A., and
Chi, S. (2008). Experimental demonstration of 1600
km ssmf transmission of a generalized direct detec-
tion optical virtual ssb-ofdm system. In Proceedings
of the European Conference on Optical Communica-
tions. IEEE.
Schmidt, B., Lowery, A., and Du, L. (2009). Low sample
rate transmitter for direct-detection optical ofdm. In
Proceedings of the Optical Communications Confer-
ence. OSA.
Schuster, M., Randel, S., Bunge, A., Lee, S., Breyer, F.,
Spinnler, B., and Petermann, K. (2008). Spectrally
efficient compatible single-sideband modulation for
OFDM transmission with direct detection. Photon.
Technol. Lett., 20(9):670–672.
DCNET 2010 - International Conference on Data Communication Networking
158
