
EXPERIMENTAL EVALUATION OF RADIO FREQUENCY
SPECTRUM SENSING DETECTORS IN TV BANDS
Petr Sramek, Karel Povalac and Roman Marsalek
Brno University of Technology, Department of Radio Electronics, Purkyňova 118, Brno, 612 00, Czech Republic
Keywords: Cognitive radio, Radio communications, Spectrum sensing.
Abstract: This paper deals with real time experiments with spectrum sensing in TV bands. First, different spectrum
sensing algorithms suitable for fast signal detection of digital TV signals are reviewed. The performance of
several selected detectors has been evaluated on data of real TV transmission in Brno region. Three different
implementations have been setup – first using the Universal Software Radio Peripheral device, second using
PC with data acquisition card sampling the DVB-T tuner intermediate frequency output and the third based
on the implementation of energy detector in Xilinx Virtex IV FPGA. Moreover the experiments with
decision fusion from heterogeneous detectors have been performed.
1 INTRODUCTION
The requirements on current radio communication
technologies are significantly increasing in order to
provide high reliable high speed communications.
The user desires are often in contrast to
technological limits like spectrum availability.
Cognitive radio (CR) has been introduced as a
promising technology to effective spectrum
utilization in wireless communication (Quan, 2008).
All the cognitive radio users are divided into the
primary (licensed) and secondary users. In a CR
network secondary users scan the frequency
spectrum (try to detect a spectrum holes in time or
frequency domain) and adapt transmission
parameters to actual available communication
channel. The work described hereinafter has been
focused on the detection of licensed users in TV
bands. Digital Video (DVB-T) and analogue
broadcasting belong to primary users. The main goal
of the spectrum sensing device is to distinguish
between two basics hypothesis:
:
, 1,2,…,,
(1)
where H
stands for the absence and H
for the
presence of primary user signal. In the case of valid
H
the channel is unused and contains only noise
term v
n
. The hypothesis H
represents the case of
primary user presence, where s
n
is the primary
user’s signal and v
n
is the additive noise term.
The paper is structured as follows. The section 2
reviews the basic spectrum sensing detectors and
presents their brief comparison. Section 3 is devoted
to the overview of possible methods for decision
fusion from various devices. In section 4, the setup
for experiments in TV band is presented, while the
measurement results are summarized in section 5.
2 SPECTRUM SENSING
ALGORITHMS
Many spectrum sensing detectors have been
proposed for the use in cognitive radio applications.
There are several criteria like the simplicity,
robustness, sensing time and application range,
helpful for the appropriate choose of the detector.
Below the three main families of different
algorithms for sensing will be briefly reviewed.
2.1 Energy Detection
Energy detector is the most common way of
spectrum sensing because of low computational and
implementation complexities (Shankar, 2005),
(Yuan, 2007). It decides about the data occupation
by simple estimation of the energy in the channel.
The receivers do not need any knowledge about the
primary users. The received signal is detected by
55
Sramek P., Povalac K. and Marsalek R. (2010).
EXPERIMENTAL EVALUATION OF RADIO FREQUENCY SPECTRUM SENSING DETECTORS IN TV BANDS.
In Proceedings of the International Conference on Signal Processing and Multimedia Applications, pages 55-60
DOI: 10.5220/0002995500550060
Copyright
c
SciTePress

comparing the output of the energy detector with a
threshold. The threshold λ depends on the noise
floor and is compared with test statistic
given
by 0):
|
|
.
(2)
Some of the energy detector disadvantages can be
characterized as: bad performance under low signal
to noise ratio values, poor detecting of spread
spectrum signals and problems with selection of the
threshold for detecting users. Many methods of
energy detection are based on the periodogram
principle or its modifications. Some of the
approaches will be further discussed in next section.
2.2 Matched Filtering
Matched filtering is considered as convenient
method for detection of primary users if the
transmitted signal is known a priori (Cabric, 2006).
It is also called as coherent detector. The method
requires good knowledge about primary user signal
such as modulation type, bandwidth, carrier
frequency, etc. The test statistic is compared with
threshold and in the discrete form is defined by
(Quan, 2008):
,
(3)
where
denotes known signal.
2.3 Cyclostationary Sensing
It is also called Feature Detection. Cyclostationary
based sensing uses the unique pattern of the signal to
detect its presence (Gardner, 1991). Major primary
signals are modulated by the sinusoidal carriers or
have cyclic prefixes. Periodic correlation function is
used for detecting signals in a frequency spectrum.
The feature detection belongs to more difficult
implementations. The method is described in detail
in (Quan, 2008). It is sensitive to the impairments
between the cyclic frequency, carrier frequency and
sampling frequency.
3 DECISSION AND ITS FUSION
One of the main problems related with the correct
decision about the spectrum usage is the appropriate
threshold setting. This problem is frequently solved
by empirical methods based on measurement from
real environment. In this case the assumption of free
channel with white noise only is deployed for all
above-mentioned methods of spectrum investigation.
The performance of the detectors can be well
characterized using the ROCs (Receiver Operation
Characteristics). During the estimation of ROCs, the
decision threshold is moved along the probability of
false alarm P
fa
and the real probabilities of correct
incumbent’s signal detection (detection probability)
are computed.
In order to improve the reliability of decision
about channel utilization it is possible to fuse
decision results from more than one detector
(Kattepur, 2007). These detectors can be located at
one place or the spatial distribution of them can be
employed. Currently, the most of the research in this
domain employs the detectors of the same type
(mostly energy detectors). Essentially each detector
can be of different type than others. We consider
that every detector gives Boolean result for every
channel at every decision period. The fusion of these
results can be performed by one of the basic rules:
AND, OR, majority, eventually more sophisticated
rules using weighting and statistical models.
4 EXPERIMENTAL SETUP
This section is devoted to the description of
individual spectrum sensing methods selected for the
experiments and three different experimental
implementations.
4.1 Used Sensing Methods
Four different spectrum sensing methods has been
used thorough the experiments. First two of them
correspond to the energy detection family (see
section 2.1), other two uses either some statistical
properties of signals (key features) or the cyclic
prefix property of DVB-T OFDM signal.
4.1.1 Welch Periodogram
Let’s assume signal {x[n]}
0
N-1
with length of N
samples. The Welch spectrum estimate can be
obtained using the equation (Madisetti, 1998):
()
∑∑
=
−
=
−
=
K
k
L
n
fnj
k
enxnw
LK
fP
1
2
1
0
2
W
)()(
11
π
,
(4)
where x
k
(n)=x(n+(k-1)D), L is the length of segment,
K stands for number of segments. The Welch’s
SIGMAP 2010 - International Conference on Signal Processing and Multimedia Applications
56

method is similar to Bartlett periodogram, the
difference lies in using D samples overlap of
segments and multiplying every segment by window
function w(n). Typical overlap values are 25%, 50%
or 75% of segment length L.
4.1.2 Multi Window Spectral Estimation
This method (sometimes called Multi tapper
method) uses the set of orthogonal sequences as the
windows applied to the periodograms. Final
spectrum estimate is given as the average of all
particular periodograms. The discrete prolate
spheroids - Slepian sequences are often used as the
windows.. The corresponding power spectrum
estimate is given as (Thomson, 1982):
()
∑∑
−
=
−
=
−
=
1
0
2
1
0
2
MW
)()(
11
m
i
N
n
fnj
ki
i
enxnw
m
fP
π
λ
(5)
Where m represents number of used windowing
sequences, w
i
and λ
i
are the i-th sequence and its
eigenvalue respectively.
4.1.3 Signal Key Features
This method initially proposed for the modulation
type classification has been proposed in (Ulovec,
2008). In that paper, several features (most of them
statistical moments) have been defined. During our
experiments, we have used mainly the feature
denoted A
S.
More informations about the method can
be found in the original paper. Defined signal key
features can be used also for modulation type
recognition. In TV bands, the classification into 3
classes – DVB-T, analog TV or noise is possible in
the assumption of sufficiently high SNR.
4.1.4 Cyclic Prefix Correlation
The correlation algorithm generally defined as:
)m()()( +=
∑
∞
−∞=
∗
ngnfnR
m
fg
(6)
can be used for signal presence detection. There are
several possible alternatives of signals f and g
assignment (autocorrelation, correlation of received
signal with known preamble etc.). We have used the
special property of the OFDM signal used for DVB-
T (ETSI, 2009) broadcasting – cyclic prefix. Sliding
correlation of two signals with duration of cyclic
prefix length and time separation corresponding to
the length of OFDM symbol useful part has been
used. Because both signals actually present in the
windows are almost identical, the peaks in the
correlation function will occur. The correlation peak
and average values have been measured and
compared with selected threshold.
4.2 Experimental Implementations
4.2.1 Sensing Device in Universal Software
Radio Peripheral
In this first described implementation, the radio
frequency signal has been received by the Universal
Software Radio Peripheral (USRP) device equipped
with TV tuner TVRX, both commercially available
from Ettus Reseach company. The received complex
baseband signal has been acquired to Simulink
environment, where the above mentioned sensing
methods have been tested. The issue of this
implementation for the use in European countries is
in different bandwidth of TV tuner developed for US
use.
4.2.2 PC-based Sensing Device by Sampling
DVB Tuner Output
This implementation has been based on the sampling
of the intermediate frequency output of
commercially available Humax F3-FOX T DVB-T
receiver. The received signal has been digitized by
Gage CompuScope 12400 card. The sampling
frequency of 100MHz with 12 bit resolution has
been used. The data have been subsequently
converted into baseband with the use of Hilbert
transformer and downsampled by factor of 10 in
order to relax the processing complexity.
4.2.3 FPGA Sensing Device by Sampling
DVB Tuner Output
The energy detector based on the periodogram was
synthesized for FPGA Virtex IV (device xc4vsx35)
device with use of the Xilinx System Generator
environment. For the real time implementation the
Memec Virtex IV MB Development Kit with
analogue module P240 was chosen (Memec design,
2005). Hardware details are described in the
following paragraph. The analogue module provides
dual channel analogue inputs and outputs. The A/D
converters are 14 – bits up to 125 MSPS. Similarly
to the previous case, the intermediate frequency
signal from DVB-T receiver has been sampled by
the A/D converters in analog module as is shown in
Figure 1.
EXPERIMENTAL EVALUATION OF RADIO FREQUENCY SPECTRUM SENSING DETECTORS IN TV BANDS
57
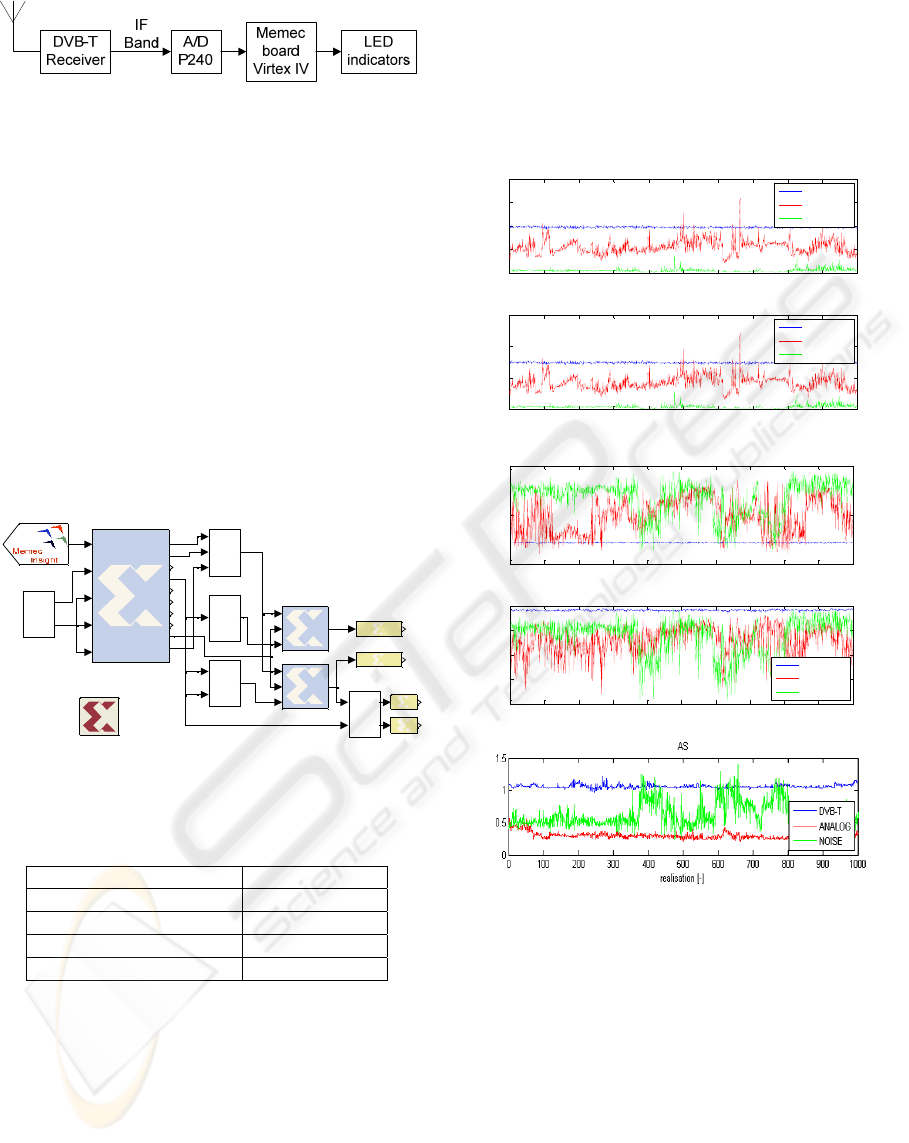
Figure 1: The block diagram of spectrum sensing chain
with FPGA Virtex IV device.
The band from 32 MHz to 40 MHz,
corresponding to one TV channel around the 36MHz
IF has been used for the energy detection. Simplified
block schematic prepared in Xilinx System
generator is shown in Figure 2. Two LED diodes
were used as signal present/absent indicator. The
power is computed at the output of FFT block with
possibility to average the individual periodograms.
Computed power in the band of interest is compared
with the threshold determined in order to guarantee
desired false alarm/correct decision probability. If
the detected power is higher than threshold level it is
signalized by green LED indicator inversely by red
LED indicator. The device utilisation is summarized
in Table 1.
Figure 2: Simplified block diagram of the FPGA
implementation (created in Xilinx System Generator).
Table 1: Device Utilization of the Virtex IV xc4vsx35.
Logic type Utilization [%]
Number of Slice Flip Flops 14
Number of 4 input LUTs 16
Number of occupied slices 25
Number of DSP48 slices 32
5 RESULTS
The test statistics (detector outputs) calculated from
1000 realizations for used detectors are shown in
Fig. 3. Each measurement has been performed for
three channels – one used by DVB-T multiplex, one
occupied with analog TV and one channel with no
transmission (noise and outside band interferences
only). It is evident, that for the presented situation
(relatively high SNR), the detectors can more or less
distinguish between the case of present DVB –T
signal, present analogue TV signal and no signal.
The method based on the cyclic prefix correlation is,
from its principle, suitable only for DVB-T signal
detection.
Figure 3: Test statistics for various detector types . From
top to bottom: Welch periodogram, MultiWindow,
Correlation (average value), Correlation (max value), key
feature AS.
The corresponding ROC curves for channels
occupied with digital TV, analog TV (PAL) and no
signals for Multi Window, key feature AS and
correlation detectors are presented in Fig. 4. Note
that the presented performance corresponds to the
situation of relatively strong received useful signal
and that the detector’s performance for low Signal to
Noise Ratios (SNR) will differ. It is expected that a
correlation detector would outperform both energy
based detectors in low SNR situation.
b
rst
en
q
Used_band
b
rst
en
q
Unused_band
In1
In2
Out1
Out2
Subsystem1
Out1
Out2
Subsystem
Ou t
RED
Out
Gateway Out3
Out
Gateway Out1
Ou t
GREEN
xn_re
xn_im
st a rt
fwd_inv
fwd_inv_we
xk_re
xk_im
xn_index
xk_index
rfd
busy
dv
edone
done
blk_exp
Fast Fourier Transform 6.0
In1
In2
Out1
Define used TV band
In1Out1
Define unused TV band
In1
In2
In3
Out1
Abs & POWER
ADC1_D
A/DC1 P240 Analog
Sy stem
Generator
0 100 200 300 400 500 600 700 800 900 1000
0
0.01
0.02
0.03
0.04
Welch
DVB-T
ANALOG
NOISE
0 100 200 300 400 500 600 700 800 900 1000
0
2
4
6
x 10
-5
MultiWindo w
realisation [-]
DVB-T
ANALOG
NOISE
0 100 200 300 400 500 600 700 800 900 1000
0
0.5
1
Correlation AVG
0 100 200 300 400 500 600 700 800 900 1000
0.2
0.4
0.6
0.8
1
Correlation MAX
realis atio n [-]
DVB-T
ANALOG
NOISE
SIGMAP 2010 - International Conference on Signal Processing and Multimedia Applications
58
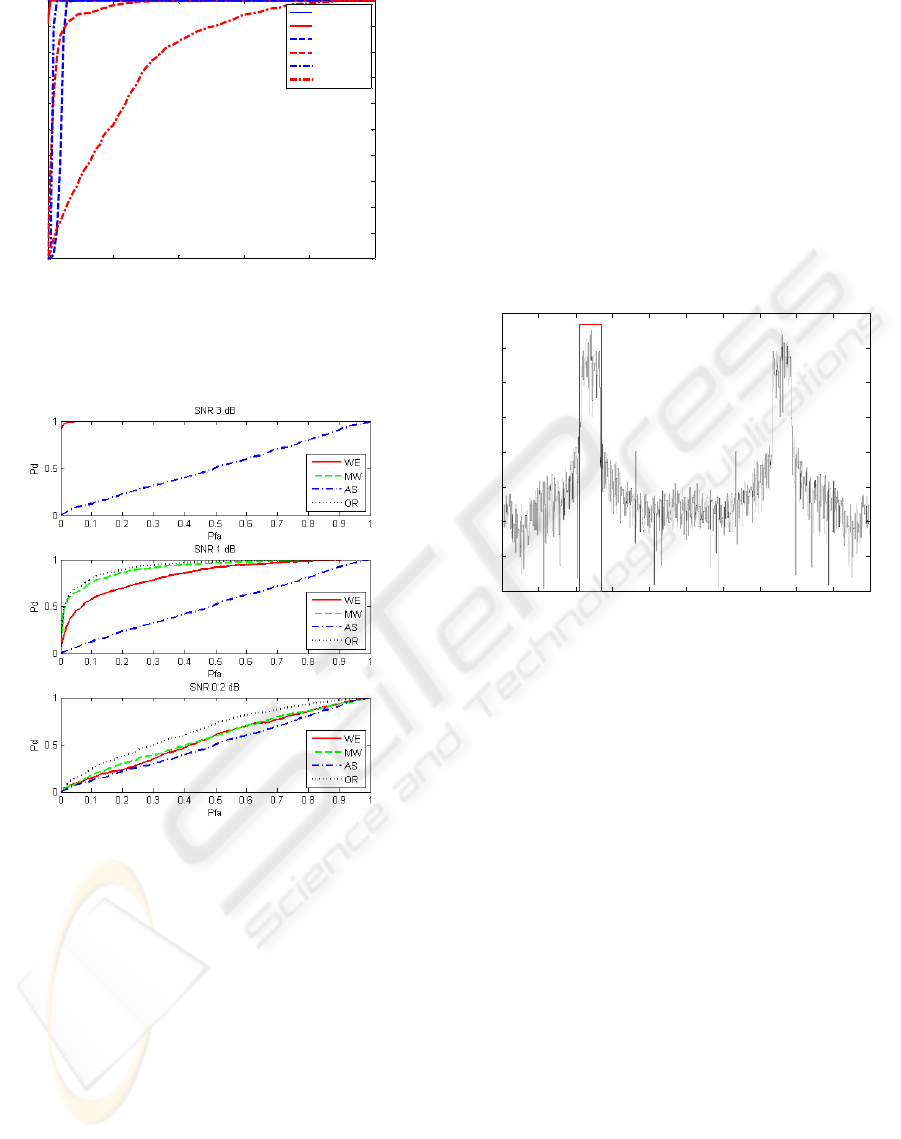
Figure 4: ROC curves for Multi Window (MW), key
feature AS and correlation (Corr) detectors for both digital
and analog TV signals sampled at DVT-T receiver IF
output.
Figure 5: ROC curves for three investigated detectors –
Welch (WE), MultiWindow (MW), key feature AS,
together with OR fusion of Welch’s and Multi Window in
various SNR.
In order to obtain the ROC curves for lower SNR,
the Additive White Gaussian Noise has been added
in MATLAB to signals sampled at DVB-T receiver
IF output. The estimated ROC curves for three SNR
values and three selected detector types computed in
MATLAB are shown in Fig. 5. The fourth ROC in
the graph denoted OR corresponds to decision fusion
of results provided by Welch’s and Multi Window
method with logical function OR. It is evident that
this method improves the ROC shape, hence the
quality of detection method is increased. As the
situations with considerably low SNR have been
assumed, the key feature based method AS does not
perform well for such low SNR’s. The performance
of other methods for 3dB SNR is almost perfect. For
SNR equal to 1dB, it is possible to distinguish
different performance of each method. For very low
SNR of 0.2 dB, the performance is highly degraded.
It can be improved using OR or any other form of
decision fusion.
The last figure – Fig. 6 shows an example of
power spectrum estimate from the FPGA
implementation. The case corresponds to the channel
occupied by the DVB-T multiplex signal. The
channel centered at IF frequency is marked by the
red box.
Figure 6: Power frequency spectrum estimation computed
by the FPGA based sensing device (DVB-T transmitting
in the tested channel).
6 CONCLUSIONS
The experimental verification of four various
spectrum sensing detectors in TV bands has been
presented. The three experimental implementations
have been briefly described and the results obtained
by the measurement and analysis of real TV
channels in Brno region have been presented. The
results have been presented in form of test statistics
for 1000 consecutive measurement realizations and
the corresponding ROC curves have been calculated.
During the experiments, the channels with high
signal quality resulting in high signal to noise ratio
has been measured. The performance of three
detectors (Welch periodogram, Multi Window
method and key feature) for low SNR has been
further evaluated by the computer simulation with
the added AWG noise.
Further work will be directed towards
incorporating more advanced type of detectors, their
evaluation for a network of several mobile sensing
0 0.2 0.4 0.6 0.8 1
0
0.1
0.2
0.3
0.4
0.5
0.6
0.7
0.8
0.9
1
Pfa
Pd
MW digital
MW analog
AS digital
AS analog
Corr digital
Corr analog
0 0.1 0.2 0.3 0.4 0.5 0.6 0.7 0.8 0.9 1
-90
-80
-70
-60
-50
-40
-30
-20
-10
Power spectral function calculated by PERIODOGRAM
fs [-]
P [dB]
EXPERIMENTAL EVALUATION OF RADIO FREQUENCY SPECTRUM SENSING DETECTORS IN TV BANDS
59

devices and towards to integration of the sensing
process together with the adaptive multicarrier
cognitive radio system.
ACKNOWLEDGEMENTS
The work described in this paper was financially
supported by the Czech Grant Agency under grant
No. 102/09/0776, doctoral grant No. 102/08/H027,
by the research program MSM 0021630513
"Advanced Electronic Communication Systems and
Technologies (ELCOM)“ and by the research
program COST IC0803 under support of the Czech
Ministry of education grant no. OC09016.
REFERENCES
Z. Quan et al., 2009. Collaborative wideband sensing for
cognitive radios: An overview of challenges and
solutions, IEEE Signal Process. Mag., vol. 25, no. 6,
pp. 60–73, Nov. 2008.
S. Shankar, C. Cordeiro, and K. Challapali, 2005.
Spectrum agile radios: utilization and sensing
architectures, in Proc. IEEE Int. Symposium on New
Frontiers in Dynamic Spectrum Access Networks,
Baltimore, Maryland, USA, Nov. 2005, pp. 160–169.
Y. Yuan et al., 2007. KNOWS: Cognitive radio networks
over white spaces, in Proc. IEEE Int. Symposium on
New Frontiers in Dynamic Spectrum Access Networks,
Dublin, Ireland, Apr. 2007, pp. 416–427.
D. Cabric, A. Tkachenko, and R. Brodersen, 2006.
Spectrum sensing measurements of pilot, energy, and
collaborative detection, in Proc. IEEE Military
Commun. Conf., Washington, D.C., USA, Oct. 2006,
pp. 1–7.
J. G. Proakis, 2001. Digital Communications, 4th ed.
McGraw-Hill.
T. Yucek, H. Arslan, 2009. A Survey of Spectrum Sensing
Algorithms for Cognitive Radiao Applications, IEEE
Communications Surveys & Tutorials, vol. 11, no. 1,
pp. 116–130, First Quarter 2009.
U. Gardner, 1991. Exploitation of spectral redundancy in
cyclostationary signals, IEEE Signal Processing Mag.,
vol. 8, no. 2, pp. 14–36, 1991.
A. K. Kattepur et al., 2007. Data and decision fusion for
distributed spectrum sensing in cognitive radio
networks, In Proceedings of Information,
Communications & Signal Processing, 2007 6th
International Conference, December 2007, p. 1 - 5
Madisetti, K. Vijay, et al., 1998. The digital signal
processing handbook. USA : CRC Press, 1998. 1776
s. ISBN 0-8493-8572-5.
D. Thomson, 1982. Spectrum estimation and harmonic
analysis, Proceedings of IEEE, vol. 70, pp. 1055-1096
September 1982.
K. Ulovec, 2008. Recognition of OFDM Modulation
Method, Radioengineering, vol. 17, No. 1 April 2008
European Standard ETSI EN 300 744: Digital Video
Broadcasting (DVB); Framing structure, channel
coding and modulation for digital terrestrial television
[online]. V1.6.1. 2009-01. Available on: <http:/
/www.etsi.org/deliver/etsi_en/300700_300799/300744
/01.06.01_60/en_300744v010601p.pdf>
Virtex-4 MB Development Board User’s Guide, AVNET -
Memec, December 2005.
SIGMAP 2010 - International Conference on Signal Processing and Multimedia Applications
60
