
BREAST MASS DETECTION USING BILATERAL FILTER
AND MEAN SHIFT BASED CLUSTERING
Farhang Sahba and Anastasios Venetsanopoulos
Department of Electrical and Computer Engineering, Ryerson University, Toronto, Canada
Keywords:
Mammography images, Mass detection, Mass segmentation, Bilateral filter, Mean shift, Computer-aided de-
tection.
Abstract:
This paper presents a new method for mass detection and segmentation in mammography images. The ex-
traction of the breast border is the first step. A bilateral filter is then applied to the breast area to smooth
the image while preserving the edges. Image pixels are subsequently clustered using an adaptive mean shift
scheme that employs intensity information to extract a set of high density points in the feature space. Due to its
non-parametric nature, adaptive mean shift algorithm can work effectively with non-convex regions resulting
in suitable candidates for a reliable segmentation. The clustering is then followed by further stages involving
mode fusion. An artificial neural network is also used to remove the false detected regions and recognize the
real masses. The proposed method has been validated on standard database. The results show that this method
detects and segments masses in mammography images effectively, making it useful for breast cancer detection
systems.
1 INTRODUCTION
Breast cancer is one of the leading causes of cancer-
related deaths in women (Horner et al., 2009). There
is considerable evidence that early detection and treat-
ment of suspicious lesions is crucial for the prognosis
of the patient as well as significantly increasing the
chance of survival. Mammography is proven to be
one of the most reliable methods for early detection
of breast cancer. However, mammography images are
among the most difficult medical images to interpret
because the features that indicate disease are typically
very small and there is a wide range of anatomical
patterns that can occur. Furthermore, each individual
scan is also prone to interpretation error (reported to
be as high as around 30%) and visual analysis of ra-
diographic images is subjective (Lee, 2007; Berman,
2007). While one expert may identify a particular
lesion as a candidate for more investigation, another
radiologist may rate the same lesion as insignificant.
Consequently, some lesions are missed or misinter-
preted. Therefore, there is a growing interest in in-
corporating automated techniques, such as computer-
aided detection systems, to act as a “second look”
and analyze these images (Morton et al., 2006). To
this aim, over the past few years, different approaches
have been proposed that help radiologists in the detec-
tion of breast lesions in mammography images
(Cheng et al., 2006). An important category of these
approaches is based on statistical parametric models.
These models implicitly assume cluster convexity in
the feature space. A powerful alternative to these
models is to apply an unsupervised non-parametric
approach. Mean shift algorithm proves to be one of
the best of such approaches. In recent years, mean-
shift algorithm has been introduced and successfully
used to develop some techniques in image processing
tasks (Comaniciu and Meer, 2002; Jimenez-Alaniz
et al., 2006; Mayer and Greenspan, 2009). It is a non-
parametric feature-space clustering technique which
does not require prior knowledge of the cluster num-
bers, while also not restricting the shape of the clus-
ters. In this paper, we present a new method employ-
ing this technique to detect and segment breast masses
in a reliable manner. We have used mean shift algo-
rithm due to its ability to work successfully with non-
convex regions as well as its noise smoothing behav-
ior, which results in appropriate candidates for seg-
mentation. The proposed method is relatively easy
to implement with adaptivity with respect to the im-
age characteristics. Experimental results prove our
method to be both effective and efficient and hence
of potential for such an application. The paper is or-
ganized as follows. The mean shift algorithm is de-
88
Sahba F. and Venetsanopoulos A. (2010).
BREAST MASS DETECTION USING BILATERAL FILTER AND MEAN SHIFT BASED CLUSTERING.
In Proceedings of the International Conference on Signal Processing and Multimedia Applications, pages 88-93
DOI: 10.5220/0002997600880093
Copyright
c
SciTePress
scribed in Section 2. The proposed methodology is
presented in Section 3. Section 4 contains the experi-
mental results and Section 5 concludes the paper.
2 MEAN SHIFT CLUSTERING
Given n data points x
i
, i = 1, ...,n in a `-dimensional
feature vectors ℜ
`
, the density estimate at point x with
kernel K(x) and window radius h
i
is obtained as (Co-
maniciu and Meer, 2002):
ˆ
f
K
(x) =
1
n
n
∑
i=1
1
h
d
i
K
x − x
i
h
i
(1)
For radially symmetric kernels with bounded sup-
port it suffices the following equation:
K(x) = c
k,d
k(kxk
2
) (2)
where c
k,d
is a normalization factor assuring K(x) in-
tegrates to 1 and h
i
is the window size or kernel band-
width which determines the range that the kernel lo-
cated in x
i
uses (Georgescu et al., 2003)(Comaniciu
and Meer, 2002). The following kernel function is
used in our work:
K(x) =
1
2
c
−1
d
(d + 2)(1 −x
T
x) i f x
T
x < 1,
0 otherwise,
(3)
According to this function, called Epanechnikov ker-
nel, the mean integrated square error between the
principal probability density function and the kernel
density estimation is minimized. The zeroes of the
gradient of the estimated density function
ˆ
f
K
indi-
cate the modes of this function (Comaniciu and Meer,
2002):
∇
ˆ
f
K
(x) =
2c
k,d
n
n
∑
i=1
1
h
d+2
i
(x
i
−x)g
x − x
i
h
i
2
!
(4)
where according to equation 3, k
0
(x), derivative of
function, k(x) exist and g(x) = −k
0
(x). The equa-
tion 4 can simply be rewritten in the following form
(Georgescu et al., 2003):
∇
ˆ
f
K
(x) =
2c
k,d
n
"
n
∑
i=1
h
d+2
i
g
x −x
i
h
i
2
!#
× m
h
(x) (5)
where
m
h
(x) =
∑
n
i=1
h
d+2
i
x
i
g
X−X
i
h
i
2
∑
n
i=1
h
d+2
i
g
X−X
i
h
i
2
− x (6)
The first term in equation 5, is proportional to the
density estimate at x computed using kernel function
G(x) = c
g,d
g(kxk
2
). The second term, m
h
(x), in this
equation however is the “mean shift”. It shows that
the mean shift vector always moves toward the direc-
tion of the higher density regions.
Clustering with mean-shift is obtained using an
iterative procedure starting from each feature vector
(data point) of the dataset and doing the following
(Comaniciu and Meer, 2002):
1 - Starting from point x
t
and calculation of the mean
shift vector m
h
(x),
2 - Shifting the window center from x
t
to x
t+1
=
x
t
+ m
h
(x
t
).
It continues until converged to a point where the
gradient of density function is zero and then asso-
ciates the feature vector with the corresponding con-
vergence mode. In fact, this algorithm is an iteratively
climbing technique to the nearest stationary point of
the data with the highest local density where the den-
sity gradient is also zero. It is important to note that
in the mean shift algorithm there is no need to initial
the cluster positions. In addition, the cluster number
is the result of the algorithm and not to be specified in
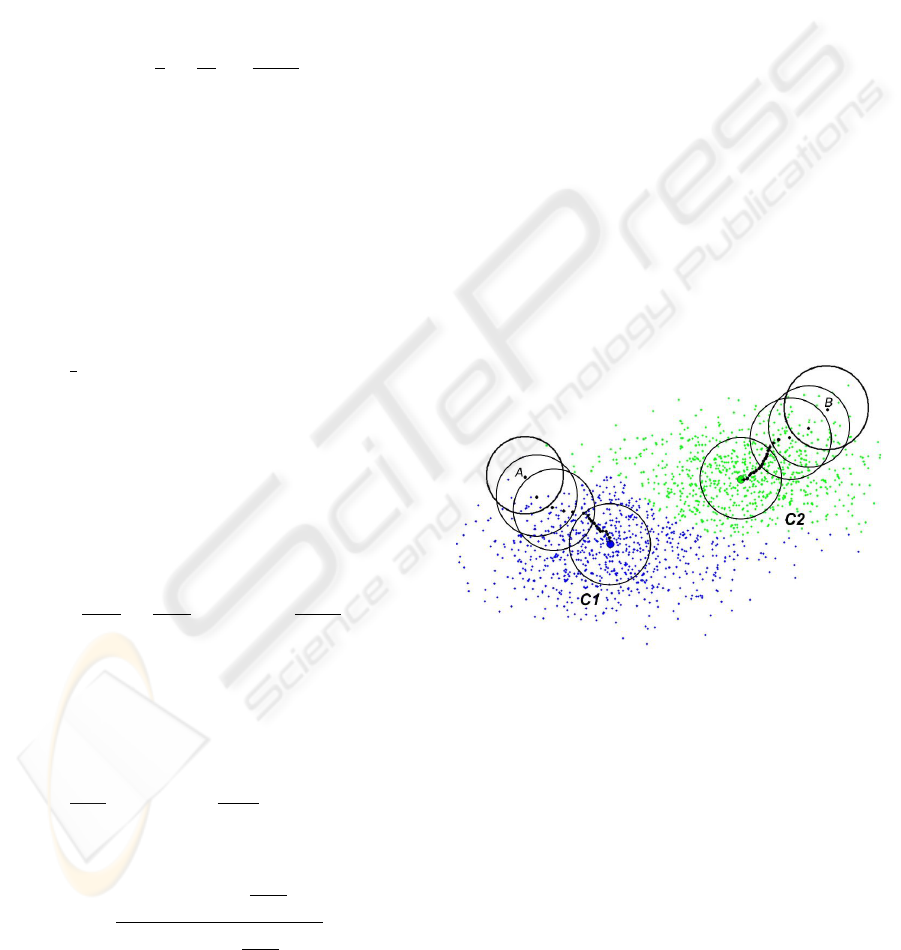
advance. Figure 1 shows two clusters and two sample
points each going to the center of the relevant cluster
using the mean shift algorithm.
Figure 1: Mean shift algorithm for two clusters and two
sample points. The mean shift vector always moves toward
the direction of the higher density regions where points A
and B are finally assigned to the clusters C
1
and C
2
, respec-
tively. The circles show kernel bandwidths which determine
the range of the data used in a specific point.
3 METHODOLOGY
The purpose of this work is to introduce an approach
that detects and segments masses in mammography
images. The proposed model is shown in Figure 2
and the following subsections detail these algorithms.
BREAST MASS DETECTION USING BILATERAL FILTER AND MEAN SHIFT BASED CLUSTERING
89
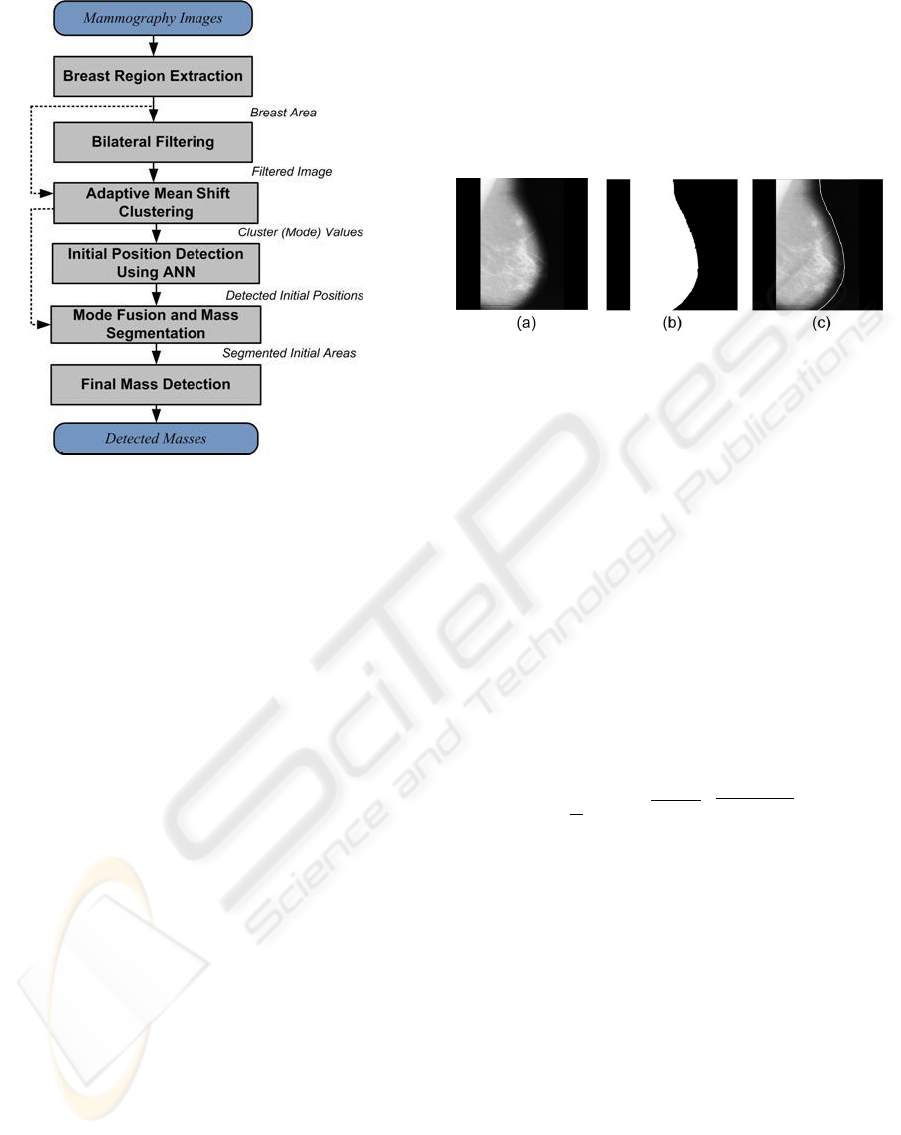
Figure 2: Block diagram of the proposed method for detec-
tion of masses in mammography images.
3.1 Extraction of the Breast Region
The goal of this step is to find the breast region. Breast
region estimation is an important requirement as it
can improve the accuracy of further analysis as well
as decreasing the processing time. First, the breast
area is initially extracted using a global thresholding
method. For this purpose, the technique presented in
(Ojalaa et al., 2001) is found to be more effective due
to its adaptive nature. In this technique, the automatic
threshold selection is based on the fact that there is
a local discontinuity among the histogram bins be-
tween the breast region and the background area. The
global threshold t
0
is determined by finding the his-
togram bin that has the maximum increase of the lo-
cal histogram discontinuity. The intensity of this bin
specifies the intensity level of the breast boundary.
This method can yield acceptable results even in low-
quality mammograms in which the breast boundary
is difficult to recognize (Ojalaa et al., 2001). For lo-
cating the final breast boundary, a fast filtering algo-
rithm based on robust regression is used (Sahba and
Venetsanopoulos, 2009). In this method, the center of
gravity of the initial thresholded region is used as the
central point of a polar coordinate system. Then the
area between the most elevated point and the lowest
point of this region is divided into equally spaced rays
originating from the central point. The rippled breast
boundary points located on the intersection of the bor-
der of the initial thresholded region and these rays are
indicated and used as the observed data for the local-
ly weighted filter (Cleveland and Devlin, 1988). This
filter smooths the rippled boundary points and re-
stores the shape of the breast boundary. Fig.3 (a), (b)
and (c) show a mammography sample image, the ini-
tial thresholded region, and the result of the robust
regression filter to find the final breast boundary, re-
spectively.
Figure 3: (a) Original breast image, (b) initial thresholded
region containing rippled boundary, (c) finding the breast
border using robust regression filter.
3.2 Bilateral Filtering
Bilateral filtering is a simple and non-iterative edge-
preserving smoothing method. In contrast to many
other smoothing filters which simply replace the gray
level value of a pixel with its weighted average of its
neighbors, the bilateral filter uses both spatial and in-
tensity values for this purpose (Tomasi and Manduchi,
1998). In fact, the weighted sum of the pixels in a
neighborhood depends on both the spatial and inten-
sity distances. By using this strategy edges are pre-
served while noise is filtered out.
If I(p) defines the image value at a pixel location p
with q pixels in its W (p) neighborhood, the output of
the bilateral filter,
˜
I(p), is calculated as follows:
˜
I(p) =
1
C
∑
q∈W (p)
e
−kq−pk
2
2σ
2
s
e
−kI(q)−I(p)k
2
2σ
2
i
I(q) (7)
where σ
s
and σ
i
are the parameters adjusting the
weights in spatial and intensity domains, respectively,
and C is a normalization factor. As can be seen, bi-
lateral filter combines gray levels based on both their
spatial proximity and gray level similarity such that
more weights are given to near values in both do-
mains. In our application, the bilateral filter is ap-
plied to the pixels located in the breast area of the
mammography images to smooth gray levels while
preserving the edges around the masses which is fun-
damental for the further stages.
3.3 Adaptive Mean Shift based
Clustering
Intensity values are the input for the non-parametric
adaptive mean shift clustering stage. As described in
SIGMAP 2010 - International Conference on Signal Processing and Multimedia Applications
90
Section 2, the adaptive mean shift algorithm is started
from each feature point in the image, being pixel in-
tensity values, and move it to a convergence peak rep-
resenting a mode. The starting pixels, having consis-
tent features, fall to the same convergence mode and
make a uniform cluster. Therefore, the output of this
algorithm is a set of clusters (modes presenting a com-
pact form of the data).
The size of the window, h
i
, is the only parame-
ter of the mean shift algorithm that should be speci-
fied. When an unchanging h
i
is used for all feature
points and iterations, the algorithm is called the fixed
bandwidth mean shift. In contrast, when a different
window size h
i
is used for each feature point x
i
the
algorithm is called adaptive mean shift (Georgescu
et al., 2003). It has been shown that the adaptive
mean shift works better than the fixed bandwidth
(Mayer and Greenspan, 2009). In the technique in-
troduced in (Georgescu et al., 2003), an approximate
method for neighborhood finding is used to achieve a
fast adaptive mean shift implementation (Mayer and
Greenspan, 2009). We adopt this strategy for our al-
gorithm. In this technique, the bandwidth value is
computed based on the norm distance between x
i
and
its m-nearest neighbors feature vectors as follows:
h
i
= kx − x
i,m
k (8)
This is applied to each feature vector. They have
suggested that the number of associated neighbors m
should be chosen such that there is adequate increase
in the density of inside feature points for supporting
the kernel functions having bandwidths h
i
. The way
that the possible values of m can be derived is ex-
plained in (Georgescu et al., 2003).
After this stage, each pixel is labelled by its con-
vergence mode where each mode states the local char-
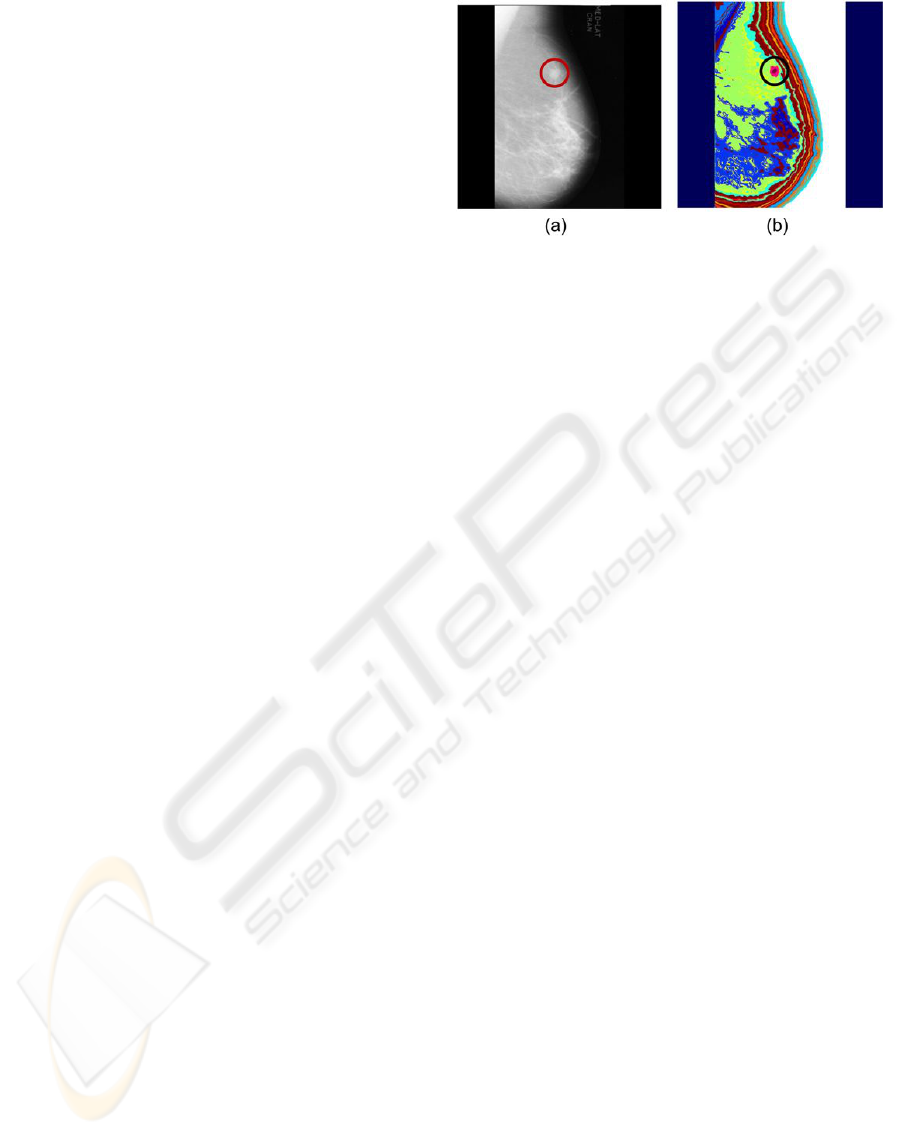
acteristics of the intensity values. Figure 4 shows a
sample mammography image containing a mass and
the result after applying the bilateral filter and adap-
tive mean shift clustering. An important advantage of
the above procedure is that the core of a mass (cen-
tral high intensity area of the mass) makes an isolated
cluster. This is because of the high density and uni-
form behavior of the intensities present in this area.
This is specially true after smoothing using the bilat-
eral filter. We use this fact for the further stages.
3.4 Detection of the Initial Positions
After data filtering and clustering, the detection of the
initial position of the masses is essential. Therefore,
the position of the isolated clusters corresponding
to the core of the masses must be identified. This
is performed using a three-layer artificial neural
network (ANN) classifier. For this purpose, the core
Figure 4: (a) Original image containing a mass, (b) The
result after applying the bilateral filter and adaptive mean
shift algorithm. The mass and its corresponding clusters are
marked in these images.
regions corresponding to the masses and non-masses
were selected to train the classifier. The features used
to represent core regions are:
Intensity features:
- Average intensity
- Variance of their intensities
- Contrast measure
- Entropy and,
Shape features:
- Area
- Perimeter
- Compactness
- Convexity
- Boundary roughness
- Mean and standard deviation of the normalized
radial length.
The above features are used as the inputs of the
neural network where its output is a binary value indi-
cating whether the core of a mass exists or not. Exper-
imental evaluation shows that these features can suit-
ably distinguish the cores corresponding to the real
masses. Of course, some false cores may also pass the
test and generate non-relevant initial positions which
can be removed in the further stages.
3.5 Mass Segmentation using Mode
Fusion
Due to the ability of adaptive mean shift clustering
in terms of work with non-convex regions, the shapes
of the clusters around the core, have a close similar-
ity with the local structure of the mass. Therefore, a
fusion procedure is performed to combine these clus-
ters and make the final segmentation. It is important
to note that in this stage, a mean shift algorithm is ap-
plied to the original (non-filtered) pixel values within
the areas of the initial detected positions, generated in
BREAST MASS DETECTION USING BILATERAL FILTER AND MEAN SHIFT BASED CLUSTERING
91
the previous stage (section 3.4). This is essential for
achieving the accurate clusters for the final segmen-
tation. After the clustering of the original pixels in
the areas of the initial detected positions, a window
around the centroid point of the cluster corresponding
to the core of the mass is considered and gradually
grows to capture more areas. In fact, spatial properties
are also incorporated to perform a proximity analysis.
The initial window is corresponding to the largest cir-
cle surrounded by the core area. After each growth,
the modes located in the area of the window are an-
alyzed. If the difference between their mode values
and the mode of the core area is less than a preset
value, it merges to the core to make a larger region.
The windowing routine is again performed with the
newly obtained area. This procedure proceeds until
no more modes satisfy the above intensity closeness
condition or the captured area is more than a specific
value. As an important property of the mean shift
algorithm, clusters can form arbitrary shapes and it
can consequently produce an appropriate segmenta-
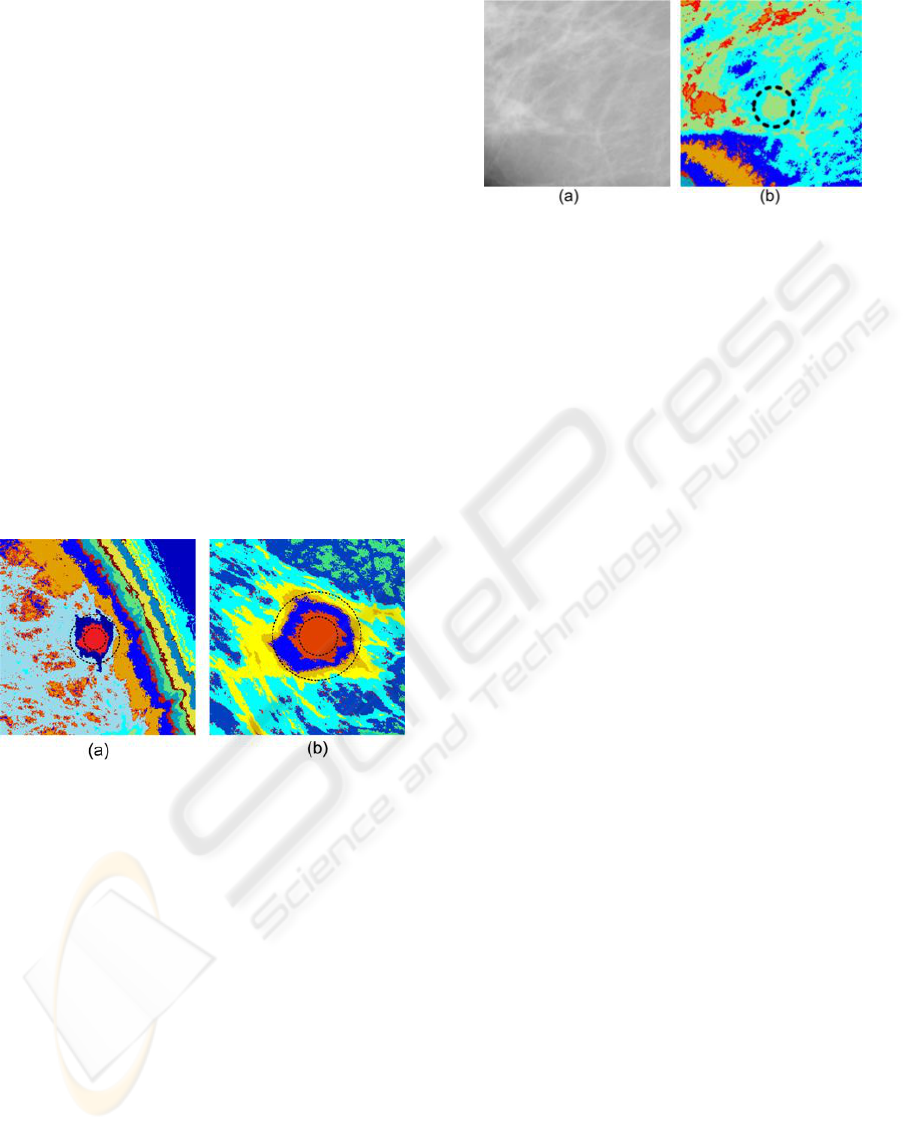
tion after the fusion procedure. Figure 5 shows sam-
ple windowing and fusion procedure for two masses.
Figure 5: Fusion procedure using the growing windows
method for two masses.
3.6 Final Mass Detection
Some false cores may pass the test carried out in sec-
tion 3.4 and generate non-relevant detected areas after
the mode fusion. To eliminate these areas, a similar
artificial neural network classifier is again applied, but
this time with the same features corresponding to the
new areas created after the mode fusion. The new
classifier uses the features obtained from the mass an
non-mass regions (not their core regions) for training
and testing. Due to the good segmentation result after
the mode fusion, sufficient discrimination in the fea-
tures of these regions is expected and many of those
false detected masses are removed. Subsequently, the
positions of the real masses are recognized. Figure 6
shows one of these false regions that passes the initial
position detection test but is removed after the final
mass detection.
Figure 6: (a) An area containing no mass ,(b) The false de-
tected core indicated by dashed circle which will be further
removed.
4 EXPERIMENTAL RESULTS
In this study, the mammography images were se-
lected from MIAS databases so that all the masses are
marked by experts. The images had resolution of 8-
bit gray scale. In our experiment, we used 65 images
containing 80 relevant regions (benign and malignant)
and 100 negative samples extracted from non-mass ar-
eas to train the classifiers. Then the system was tested
on 35 images containing 42 masses. According to the
detection result, the true positive (TP) detection rate
was 88% with a false-positive fraction of 2.1 marks
per image. The estimated value for A
z
of ROC curve
was 0.86. We observed that due to some similarity
between the features of masses and regions contain-
ing no mass, there are some false positives after the
initial position detection. The final mass detection
stage, however, improved the performance and re-
moved many of these false areas. Compared to the re-
sults from some other statistical approaches reported
in (Cheng et al., 2006)(Petrick, Sahiner , and Comer)
in terms of detection rate, and false positive rate, our
proposed system obtain superior performance indi-
cating better discrimination capacity and robustness.
Figure 7 shows two sample images containing the de-
tected mass as well as the results of segmentation af-
ter the mode fusion. This shows that the proposed
method can detect and segment masses, making it
practical to be used in a computer-aided detection sys-
tem for breast cancer analysis.
5 CONCLUSIONS
In this paper, we presented a new, and effective mass
detection and segmentation approach for mammogra-
phy images. The proposed method is based on bilat-
eral filtering and non-parametric adaptive mean shift
clustering. The proposed method also generates re-
SIGMAP 2010 - International Conference on Signal Processing and Multimedia Applications
92
sults using an adaptive bandwidth adjustment scheme
as well as follow-up stages for further improvement
of the initial clustering results. Due to the ability of
the adaptive mean shift in terms of working with non-
convex clusters as well as its noise smoothing behav-
ior, we are able to obtain good results after the final
segmentation. Moreover, the method was validated
on real mammography database and comparing to the
similar statistical approaches, it shows improvement
in sensitivity of mass detection and better false posi-
tives rate. One of the main objectives of this work is
to provide radiologists with a computer-aided detec-
tion system aimed at studying the risk of developing
breast cancer.
For further improvement of the proposed ap-
proach, we can consider the following works:
- Applying the method to a different data set.
- Applying parameter optimization methods.
- Using other classifiers such as SVM.
- Refinement of the segmentation method based on
shape attributes to capture all lesion extension.
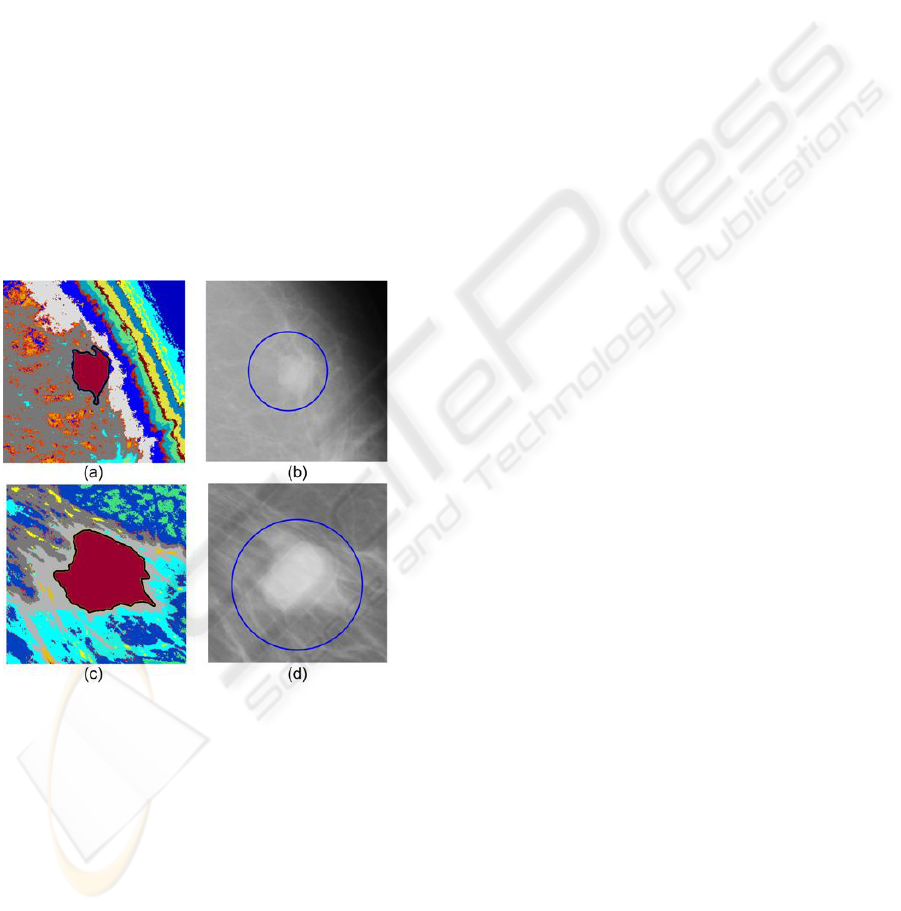
Figure 7: Final results. The final segmentation after the
mode fusion is indicated by solid black contour where the
clusters are shown by different colors. (a) and (c) are
the results of the final segmentation; (b) and (d) are their
corresponding detected areas in the original breast images
(zoomed in for better visualization).
REFERENCES
Berman, C. G. (2007). Recent advances in breast-specific
imaging. Cancer control, 14(4):338–349.
Cheng, H. D., Shi, X. J., Min, R., Hu, L. M., Cai, X. P., and
Du, H. N. (2006). Approaches for automated detection
and classification of masses in mammograms. Pattern
Recognition, 39(4):646–668.
Cleveland, W. and Devlin, S. (1988). weighted regression:
An approach to regression analysis by local fitting.
Jour. of the American Stat.l Assoc., 83:596–610.
Comaniciu, D. and Meer, P. (2002). Mean-shift: A robust
approach toward feature space analysis. IEEE Trans-
action on Pattern Analysis and Machine Intelligence,
24(5):603–619.
Georgescu, B., Shimshoni, I., and Meer, P. (2003). Mean
shift based clustering in high dimensions: A texture
classification example. In IEEE International Confer-
ence on Computer Vision, pages 456–463. IEEE.
Horner, M. J., Ries, L., Krapcho, M., Neyman, N., Aminou,
R., Howlader, N., Altekruse, S. F., Feuer, E., Huang,
L., Mariotto, A., Miller, B., Lewis, D., Eisner, M.,
Stinchcomb, D., and Edwards, B. (2009). Seer can-
cer seer cancer statistics review, 1975-2006. National
Cancer Institute, Bethesda, MD, seer.cancer.gov.
Jimenez-Alaniz, J. R., Medina-Banuelos, V., and Yanez-
Suarez, O. (2006). Data-driven brain mri segmenta-
tion supported on edge confidence and a priori tissue
information. IEEE Transaction on Medical Imaging,
25(1):74–83.
Lee, J. (2007). Qualitya radiology imperative: Interpreta-
tion accuracy and pertinence. Journal of the American
College of Radiology, 4:162–165.
Mayer, A. and Greenspan, H. (2009). An adaptive mean-
shift framework for mri brain segmentation. IEEE
Transaction on Medical Imaging, 28(8):1238–1250.
Morton, M., Whaley, D., Brandt, K., and Amrami, K.
(2006). Screening mammograms: Interpretation with
computer-aided detectionprospective evaluation. Ra-
diology, 239(2):375–383.
Ojalaa, T., Nappia, J., and Nevalainena, O. (2001). Accu-
rate segmentation of the breast region from digitized
mammograms. Computerized medical imaging and
graphics, 25:47–59.
Sahba, F. and Venetsanopoulos, V. (2009). A new fuzzy
approach to mammographic breast mass segmenta-
tion. In International Conference on Image Pro-
cessing, Computer Vision, and Pattern Recognition
(IPCV2009), pages 852–858. Las Vegas.
Tomasi, C. and Manduchi, R. (1998). Bilateral filtering for
gray and color images. In International Conference
on Computer Vision, pages 839–846.
BREAST MASS DETECTION USING BILATERAL FILTER AND MEAN SHIFT BASED CLUSTERING
93
