
TOWARDS MODELING LARGE SCALE PROJECT
EXECUTION MONITORING
Project Status Model
Ciprian-Leontin Stanciu, Dacian Tudor and Vladimir-Ioan Creţu
“Politehnica” University of Timisoara, Vasile Parvan Avenue, No. 2, 300223 Timisoara, Romania
Keywords: Software Project Management, Project Monitoring, Monitoring Model, Project Status, Project
Macro-universe, Worker Micro-universe.
Abstract: Software projects are problematic considering their high overruns in terms of execution time and budget. In
large scale projects, the monitoring activity is a very difficult task, due to the very complex relation between
resources and constraints, and must be based on a well established methodology. The outputs of the
monitoring process refer mostly to the current status of the project, which must be reflected as accurate as
possible. We propose a model for project status determination. This is a sub-model of a future monitoring
model subject of our current research. The project status model not only considers the perspective of the
project manager, which defines the macro-universe of the project, but also the perspective of every worker
involved in the project, who can be seen as manager of their assigned tasks, which defines the micro-
universe of the worker.
1 INTRODUCTION
AND BACKGROUND
In the process of project monitoring and control, a
continuous progress assessment must be done for an
effective project management, according to Radice,
Roth, O'Hara, and Ciarfella (1985). Without a good
project execution monitoring strategy, even working
with very competent managers and workers, there is
a high risk of resource waste as argued by
Humphrey (1990).
It is common for software projects to have high
implementation overrun in terms of cost and time.
This was observed through several market
researches conducted in the software production
domain. The results presented in The Standish
Group (1994), Yarmouth (2003), Jorgensen and
Molokken (2006), showed a fluctuant evolution to a
better situation. Regarding the results of the last
study, published in 2009, “Chaos Summary 2009”,
Jim Crear, The Standish Group CIO, said that these
results revealed the highest failure rate in over a
decade (The Standish Group, 2009). These results
suggest that either the planning or the monitoring
methodologies applied to software projects are
inadequate. However, in our opinion, an adequate
project monitoring is the basis of the development of
more adequate planning methodologies, so that the
results shown in the studies conducted by The
Standish Group are consequences of the lack of
satisfactory project development monitoring
methodologies.
Software development organizations should
employ various software tools for completing their
projects properly, in terms of budget, schedule and
quality, according to Serkan (2004). Hunt (2007)
suggests that including established estimation
methodology and algorithms as part of the
monitoring and control process may lead to
significant process improvements.
Several monitoring models were developed
based on system dynamics representation (System
Dynamics Society). Such models are those proposed
by Rodrigues and Williams (1997), Barros, Werner
and Travassos (2000), Bekjti and Matta (2003),
Oorschot, Sengupta and Wassenhove (2009).
Our approach to monitoring is centred on the
working behaviour of the involved human factor and
we plan to develop a monitoring model that not only
takes into consideration the manager decisions, but
also the decisions of every worker in the
development team, besides the specific operational
36
Stanciu C., Tudor D. and Cre¸tu V. (2010).
TOWARDS MODELING LARGE SCALE PROJECT EXECUTION MONITORING - Project Status Model.
In Proceedings of the 5th International Conference on Software and Data Technologies, pages 36-41
DOI: 10.5220/0003009100360041
Copyright
c
SciTePress
outputs. The project status model defines the basics
of our approach to monitoring, taking into
consideration the two natural perspectives over
project development: the macro-universe of the
software project and the micro-universe of the
worker.
In this paper, we focus on presenting the project
status model, as well as the desired features for the
proposed project monitoring model. In section 2, we
present the basics of our approach to project
monitoring, defining the project status model.
Finally, in section 3, we present the conclusions and
future work.
2 THE PROJECT STATUS
MODEL
Assume a set of projects, P, a set of tasks, Θ, and a
set of workers, W.
Definition 1 (Project). A project p
i
Є P is a
quadruplet (Θ
i
, W
i
, dep
i
, T), where Θ
i
is a subset of
Θ, W
i
is a subset of W, dep
i
is a binary relation
defined on Θ
i
, and T represents time, so that, if we
assume an arbitrary p
k
Є P, with k ≠ i, and p
k
= (Θ
k
,
W
k
, dep
k
, T), then Θ
k
∩Θ
i
= Ø (W
i
∩W
k
might not be
an empty set), no matter the time T. The elements of
the quadruplet define the macro-universe of project
p
i
at time T.
Definition 2 (Worker). A worker w
i
Є W is a triplet
(Θ
i
, ord
i
, T), where Θ
i
is a subset of Θ, ord
i
is a
binary relation defined on Θ
i
, and T represents time,
so that, if we assume an arbitrary w
k
Є W, with k ≠ i,
and w
k
= (Θ
k
, ord
k
, T), then Θ
k
∩Θ
i
= Ø, no matter
the time T. The elements of the triplet define the
micro-universe of worker w
i
at time T.
Please note that the fact that definition 2
considers that a task can be assigned to only one
worker at a time is not a restriction: for example, a
task assigned to two workers can be regarded as two
tasks with the same position in the project macro-
universe as the original task, the resulted tasks being
assigned to only one worker.
Definition 3 (Task). A task t
i
Є Θ is a quadruplet (p
i
,
w
i
, D
i
, ζ
i
), where p
i
represent a macro-universe at a
given time, w
i
represent a micro-universe at the
same given time, D
i
is the due date for task t
i
established at task creation and it is not variable in
time, and ζ
i
is a function of time that produces a
quadruplet (ES
i
, EL
i
, PES
i
, WES
i
), where ES
i
is the
estimated effort for task t
i
; EL
i
is the elapsed effort
for task t
i
, meaning the total time spent actually
working on task t
i
; PES
i
is the earliest date when
task t
i
can be started considering only the macro-
universe p
i
(PES is the acronym for Project Early
Start and it is associated with a task); WES
i
is the
earliest date when task t
i
can be started considering
the macro-universe p
i
and the micro-universe w
i
(WES is the acronym for Worker Early Start and it
is associated with a task).
It is important to be aware of the difference
between the parameter D introduced in Definition 3,
which refer to the due date of a task established at
task creation, and the actual due date of the task.
The proposed model is able to provide the
current status of the monitored project,
recommendations for the workers in order to
maximize tasks completion rate, and to notify
detected project execution problems through alarms.
2.1 Project Status Determination
In this subsection, the focus is on the model’s
equations that describe the status of the monitored
project.
We use a modified PERT to represent a project:
a directed acyclic graph, as in (Stanciu et al., 2009).
This graph’s vertices are the tasks of the project and
the arcs suggest that the pointed task is dependent to
the source task. If a task is dependent to another
task, the dependent task cannot start before the
completion of the task on which it depends.
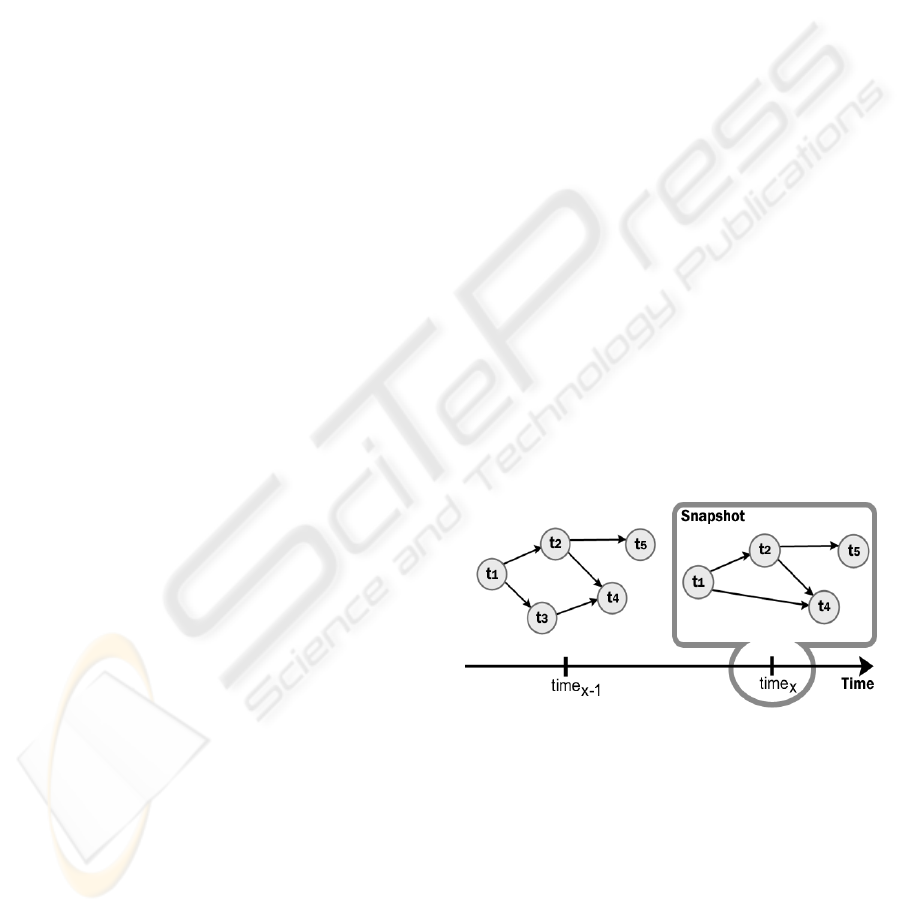
Figure 1: A project macro-universe: evolution and a
snapshot used in determining the status of the project at a
moment in time (time
x
).
In Figure 1, a project is represented at different
moments in time, suggesting the possible changes in
the project structure that can take place during
project development. However, for establishing the
status of the project at a moment in time, only the
snapshot describing the project at that moment in
time is needed. Considering the three definitions
from above, Figure 1 also illustrates the macro-
universe of the same project and its evolution from
TOWARDS MODELING LARGE SCALE PROJECT EXECUTION MONITORING - Project Status Model
37
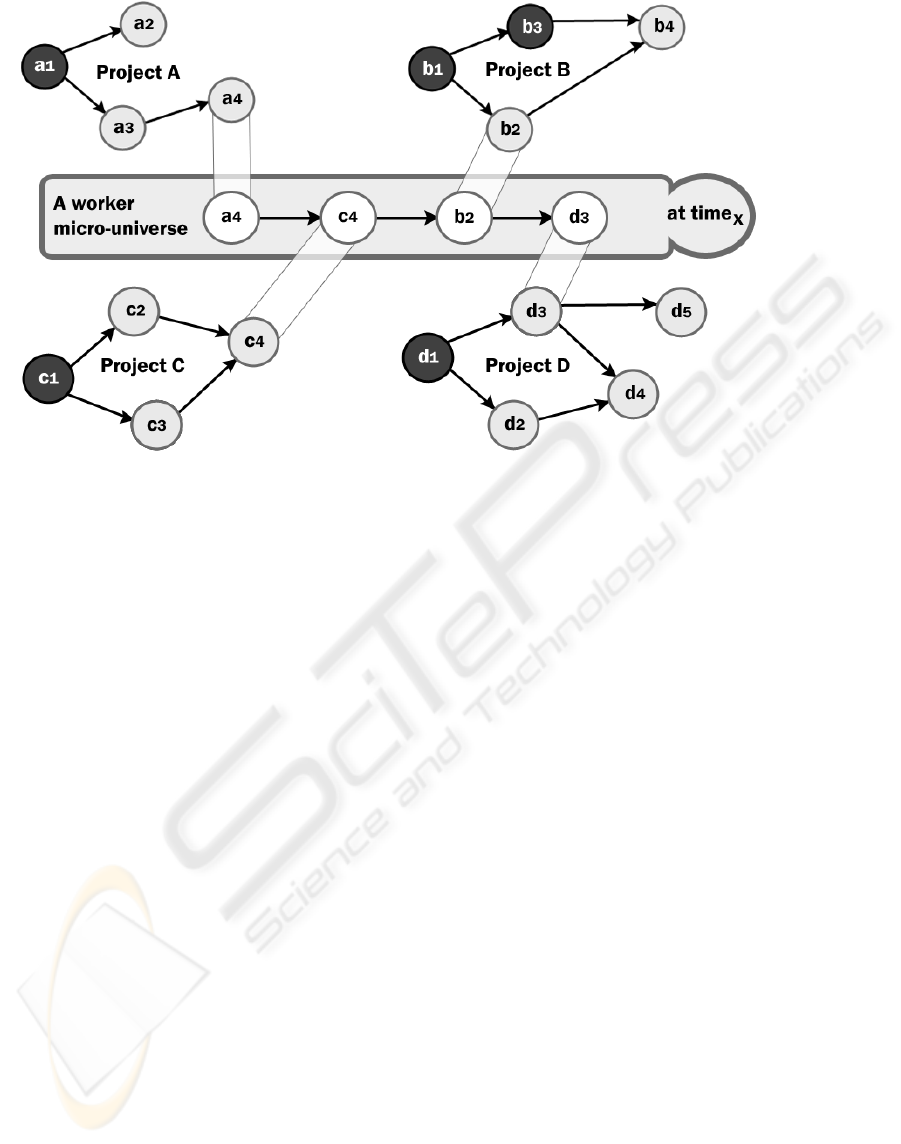
Figure 2: A worker micro-universe: a snapshot used in determining the status of the project at a moment in time (time
x
); the
tasks coloured in black (a
1
, b
1
, b
3
, c
1
, d
1
) are completed tasks.
time
x-1
to time
x
. In Figure 1, a snapshot of the
macro-universe is marked (at time
x
) to suggest that,
for establishing the project status at a particular time,
only snapshots at that particular time are used.
In an organization, there are as many project
macro-universes as projects being developed and
currently in work. In this context, the available
workers may be assigned with many tasks, from
different projects being currently in work in the
organization. Generally, in such a context, the
workers might decide the rejection of several tasks,
the order in which they execute their assigned and
accepted tasks, the re-estimation of the effort
required for the completion of their tasks and so on.
This way, the workers may be seen as the managers
of their own tasks.
Consequently, another perspective of the project
development must be taken into consideration in
monitoring. We refer to this perspective as the
micro-universe of the worker. Figure 2 illustrates
such a perspective: a worker micro-universe at a
given time.
Figure 2 shows the tasks assigned to and
accepted by a worker, ordered as desired by the
worker at a particular time. The order of these tasks
is established and can be changed at any time by the
worker, who can also re-estimate the required effort
for the completion of their tasks (ES values for the
respective tasks). Moreover, the worker reports the
elapsed effort for their tasks (EL values, meaning the
time spent actually working on the respective tasks).
These ordered tasks are further referred to as local
sequence of tasks or local order. A local order is
associated with a micro-universe of a worker at a
given time.
As suggested in Figure 2, the tasks do not
necessary belong to the same project. Every task in
the local sequence of tasks has an associated PES
and an associated WES (Definition 3 from above).
The value of PES associated to a task t
i
represents
the date on which every task, that belong to the same
project as t
i
and on which t
i
depends, is completed.
The value of WES associated to a task t
i
represents
the latest date between PES associated with t
i
and
the date when all previous tasks in the local
sequence where t
i
belongs (at the time when WES is
computed) are also completed.
Before proceeding to the model’s equations
concerning project status determination, we next
present several examples on how PES and WES
values are established, considering Figure 2.
Example 1. PES value for c
4
determined at time
x
is
the latest date between the completion date of c
2
and
the completion date of c
3
. PES value for b
2
at time
x
is time
x
since b
1
is already completed at time
x
.
Example 2. WES value for c
4
determined at time
x
is
the latest date between PES for c
4
determined at
time
x
and the completion date of a
4
. WES value for
b
2
at time
x
is the latest date between time
x
(which is
the PES value for b
2
computed at time
x
) and the
completion date of c
4
. Since c
4
is not completed at
ICSOFT 2010 - 5th International Conference on Software and Data Technologies
38

time
x
, WES value for b
2
at time
x
is the completion
date of c
4
.
The dep binary relation introduced in Definition
1 is asymmetric and not transitive, and it is defined
on the set of tasks of a project, so that given two
tasks t
a
and t
b
, (t
a
, t
b
) Є dep means that t
b
is a task on
which t
a
depends directly (t
a
cannot start before the
completion of t
b
). The ord relation introduced in
Definition 2 is asymmetric and not transitive, and it
is defined on the set of tasks assigned to a worker, so
that given two tasks t
c
and t
d
, (t
c
, t
d
) Є ord means that
t
d
is the successor of t
c
in the local order. Although
the worker to which t
c
and t
d
are assigned may
change the order of their tasks at any time, at the
given moment in time when (t
c
, t
d
) Є ord, we
consider that t
d
cannot be started or continued before
the completion of t
c
.
The value of PES for a task t
k
and a moment in
time, T, is computed using (1) if there is at least one
task on which t
k
depends (a task t
x
exists so that (t
k
,
t
x
) Є dep) and that task is not completed (ES
tx
≠
EL
tx
) at time T. Basically, PES is the date when the
depending task can be started to which is added a
number of time units representing the remaining
working time regarding the respective depending
task. Because there are cases when a task depends
on more than one task, equation (1) uses a max
operator which returns the maximum value for PES
from the values computed using the depending tasks
individually.
(1)
In the case where no task t
x
exists, (t
k
, t
x
) Є dep
and ES
tx
≠ EL
tx
, PES is given by (2) and its value is
T (current time).
(2)
The value of WES for a task t
k
(task t
k
is
assigned to the worker w
k
) and a time T is computed
using (3) if there is a task to which t
k
is the direct
successor in the local order of worker w
k
(a task t
y
exists so that (t
y
, t
k
) Є ord) and that task is not
completed (ES
ty
≠ EL
ty
) at time T. The meaning of
this formula is that a task t
k
can be started or
continued only when the following two conditions
are simultaneously met (max operator):
1) the preceding tasks in the project macro-
universe to which t
k
belongs are completed (PES
tk
);
2) the task to which t
k
is the direct successor in the
local order of worker w
k
is completed (WES of the
predecessor task, t
y
, in the local order, a task that
might be assigned to other worker, w
y
; to this WES
value is further added a number of time units
representing the remaining working time regarding
the respective predecessor task).
(3)
(t
y
, t
k
) Є ord and ES
t
y
≠ EL
t
y
In the case where no task t
y
exists so that (t
y
, t
k
)
Є ord and ES
ty
≠ EL
ty
, WES of task t
k
is given by (4)
and its value is the same as PES for task t
k
.
(4)
Considering (1), (2), (3), and (4), it is obvious
that PES and WES are time dependent. Moreover,
finding PES and WES values for every assigned task
of a project, enables the project manager to know the
date when the tasks can be started with respect to the
project structure of tasks, as wells as the date when a
the same tasks can be started with considering
workers’ decisions regarding their assigned tasks
(tasks which might not all be of the same project).
Consequently, the equations (1), (2), (3), and (4)
describe the actual status of the monitored project. In
fact, (1), (2), (3), and (4) can describe the status of
all the projects currently in work in an organization.
2.2 Recommendations for Workers
based on Project Status
The recommendations provided by the status model
refer to local task sequences, and more specifically
to the task order of execution that can be chosen by
the workers for their tasks. A possible solution for
this issue is provided by the scheduling methods
used in operating systems for ordering the execution
of processes. A good candidate for establishing the
recommended local task order of execution is the
shortest remaining time scheduling method as
illustrated by Shenoy (2008) in the context of
operating systems. According to this scheduling
method, the task with the smallest remaining
execution time to completion is executed first. An
advantage of this scheduling method refers to the
fact that the short tasks are handled very quickly.
This is especially important in the context in which,
shorter tasks generally have earlier deadlines
established in the project execution plan, so that a
worker is better to finish the short tasks first than to
pause the short tasks while trying to finish large
tasks. Another advantage of the shortest remaining
time scheduling method is that it requires little
overhead because the worker starts a new task when
TOWARDS MODELING LARGE SCALE PROJECT EXECUTION MONITORING - Project Status Model
39

the current task is completed or a new task, with
lower remaining time, is ready to be stared. The
overhead in the context of project execution refers to
the effort required by the worker transition from
working on a task to working on another task. The
amount of these transitions ought to be as little as
possible during the execution of a project.
Consequently, the shortest remaining time
scheduling method is a good candidate for the
recommendation strategy of the proposed
monitoring model.
The recommended order is obtained through
ordering the tasks assigned to a worker so that (5) is
true for all worker’s tasks, and if several tasks have
the same values for PES, further ordering of these
tasks so that (6) is true for all the tasks assigned to
the respective worker.
,
,
Є
(5)
,
,
Є
(6)
The meaning of (5) is that the tasks in a local
sequence are ordered by their PES value in an
ascending manner. The meaning of (6) is that the
local tasks with the equal PES values are ordered by
their remaining execution time.
2.3 Project Execution Problems
Detection
Based on project status, several project execution
problems can be identified. We believe there are
three main alarm categories based on project status:
alarms regarding work assignation, alarms regarding
work progress, and alarms regarding effort
estimation changes.
1) Alarms Regarding Work Assignation. An alarm
of this type may be generated when deviations from
the execution plan might occur because of the
manner in which the work is assigned. This alarm
concerns the worker and its aim is to make the
worker decide upon the rejection of their new
assigned task. Another alarm of this type may be
generated during task execution. This alarm
concerns the project manager and its aim is to make
the project manager decide upon the re-assignation
of the involved task. This type of alarms are
generated when (8) is true for at least two tasks (t
i
and t
k
) assigned to a worker, considering (7). In
equation (7), D
ti
and D
tk
are those introduced in
Definition 3 and refer to the due dates established at
task creation.
max
;
(7)
(8)
Consider the assignation of a new task to a
worker. In (7) and (8), t
i
and t
k
are two tasks
assigned to the respective worker, so that one of
these tasks is the new assigned task and the other is a
task that was earlier assigned to the same worker. In
this scenario, the meaning of (7) and (8) is that, if
there is an earlier assigned task so that the sum of
the remaining effort for this task and the remaining
effort for the new assigned task are greater than the
remaining time to the latest due date of the two
tasks, then the worker must decide upon the
rejection of the new assigned task.
Alarms of this type may be generated during task
execution as well, when there are two tasks assigned
to the same worker so that the sum of their
remaining effort are grater then the remaining time
to the latest due date of the two tasks. In such a
situation, the project manager must decide upon the
re-assignation of one of these tasks.
2) Alarms Regarding Work Progress. Alarms of
this type are generated when the work progress
endangers the completion of a particular task at the
established due date. This type of alarms concerns
both the worker to which the problematic task is
assigned and the project manager. When (9) is true,
an alarm is generated.
(9)
3) Alarms Regarding Effort Estimation Changes.
These alarms are generated when a worker re-
estimates the effort required to complete an owned
task, t
n
. In (10), δ is the hierarchical dependency
relation defined on the set of tasks of the same
project, so that (t
n
, t
i
) Є δ means that t
i
depends not
necessary directly on t
n
.
,
,
(10)
An alarm is generated when (10) is true for at
least one task that depends on the task that the
worker re-estimates. This alarm concerns mainly the
worker who makes the re-estimation. The meaning
of (10) is that the re-estimation of an owned task
influences the starting time of a future task in such a
way that the future task will not be able to be
completed at its established due date. The aim of this
alarm is to make the worker reconsider their new
estimation.
ICSOFT 2010 - 5th International Conference on Software and Data Technologies
40

3 CONCLUSIONS AND FUTURE
WORK
In this paper, we have presented a project status
model in the context of a wider research activity
concerning the development of a monitoring model
designed for large scale software projects. The
proposed model is specified formally and its main
features refer to: finding the actual status of a
project, providing recommendations to the workers,
and automated-generating alarms regarding the
actual status of the project. A distinct characteristic
of the proposed project status model and an
innovation factor is that this model takes into
consideration two perspectives over the monitored
project: the macro-universe of the project and the
micro-universe of the worker.
As next steps, we plan to develop a work
behavior prediction model to forecast worker
decisions regarding work and work estimation (EL
and ES values, respectively) for different moments
in the future based on history. Using the predicted
ES and EL values, the project status model presented
in this paper is able to compute the future probable
project status at the respective moments in the
future. The synergic combination of the project
status model with the work behavior prediction
model represents the large scale software project
monitoring model. Furthermore, we propose to
develop a software prototype that incorporates the
monitoring model. To validate the model, the
software prototype will be used during the
development of real-world software projects.
ACKNOWLEDGEMENTS
This work was supported by QuarterMill
Technologies. This work was partially supported by
the strategic grant POSDRU 6/1.5/S/13, (2008) of
the Ministry of Labor, Family and Social Protection,
Romania, co-financed by the European Social Fund
– Investing in People.
REFERENCES
Barros, M., Werner, C. M. L., Travassos, G. H. (2000).
Applying System Dynamics to Scenario Based
Software Project Management. In Proceedings of the
18th International System Dynamics Conference,
Berghen, Norway.
Bekjti, S., Matta, N. (2003). A Formal Approach to Model
and Reuse the Project Memory. In Proceedings of I-
KNOW ’03 (pp. 507-514). Graz, Austria.
Humphrey, W. S. (1990). Managing the Software Process
(pp. 301-395). In SEI Series in Software Engineering,
Addison Wesley Longman.
Hunt, B. (2007). Parametric Project Monitoring and
Control: Performance-Based Progress Assessment and
Prediction. In Aerospace Conference, IEEE (pp. 1-12).
Jorgensen, M., Molokken, K. (2006). How Large Are
Software Cost Overruns? A Review of the 1994 Chaos
Report. In Software Practitioner (Vol. 16, No. 4&5,
pp. 13-14).
Oorschot, K. E. van, Sengupta, K., Wassenhove, L. N. van
(2009). Dynamics of Agile Software Development. In
Proceedings of the 27th International Conference of
the System Dynamics Society, Albequerque, USA.
Radice, R. A., Roth, N. K., O'Hara, A. C. Jr., Ciarfella, W.
A. (1985). A Programming Process Architecture. In
IBM Systems Journal 24 (No. 2, pp. 79-90).
Rodrigues, A. G., Williams, T. M. (1997). System
Dynamics in Software Project Management: Towards
the Development of a Formal Integrated Framework.
In European Journal of Information Systems (6, pp.
51-66).
Serkan, N. (2004). An Information System for
Streamlining Software Development Process. In Turk
J. Elec. Engin. (Vol.12, No.2). Retrieved from:
http://journals.tubitak.gov.tr/elektrik/.
Shenoy, P. (2008). Operating Systems. Scheduling -
Lecture 7: September 23. In a course for
undergraduate CS students, University of
Massachusetts, Department of Computer Science.
Retrieved from http://lass.cs.umass.edu/~shenoy/.
Stanciu, C., Tudor, D., Creţu, V. I. (2009). Towards an
Adaptable Large Scale Project Execution Monitoring.
In the 5th International Symposium on Applied
Computational Intelligence and Informatics (pp. 503-
508), Timisoara, Romania. Retrieved from IEEE
Database.
System Dynamics Society. Retrieved from http://
www.systemdynamics.org.
The Standish Group. (1994). Chaos Report. A study by
Standish Group International.
The Standish Group. (2009). New Standish Group Report
Shows More Project Failing and Less Successful
Projects. Retrieved April 23, 2009, from http://
www.standishgroup.com.
Yarmouth, W. (2003). Latest Standish Group Chaos
Report Shows Project Success Rates Have Improved
by 50%. Retrieved March 25, 2003, from
http://findarticles.com.
TOWARDS MODELING LARGE SCALE PROJECT EXECUTION MONITORING - Project Status Model
41
